Tracking executive coaching performance can be challenging when key metrics are scattered across multiple spreadsheets and reports. Leaders, consultants, and coaching organizations need a clear and structured way to measure progress, evaluate coaching effectiveness, and align performance with business objectives.
The Executive Coaching KPI Dashboard in Excel is a powerful and ready-to-use performance monitoring tool designed to simplify KPI tracking for executive coaching programs. Built entirely in Microsoft Excel, this dashboard transforms raw coaching data into meaningful insights using interactive visuals, trend charts, and automated performance comparisons.
With this Excel dashboard template, executives and coaching professionals can monitor key performance indicators in one centralized location. Instead of spending hours preparing manual reports, users can quickly review performance metrics, analyze trends, and identify improvement opportunities.
The dashboard provides a complete overview of coaching KPIs by combining actual performance data, targets, previous year comparisons, and trend analysis. This allows organizations to evaluate progress over time and make informed strategic decisions.
Whether you are a leadership coach, HR manager, consulting firm, or corporate executive, the Executive Coaching KPI Dashboard in Excel provides the insights needed to track coaching impact and improve organizational performance.
🚀 Key Feature of Executive Coaching KPI Dashboard
The Executive Coaching KPI Dashboard in Excel includes powerful features that make performance monitoring simple, accurate, and insightful.
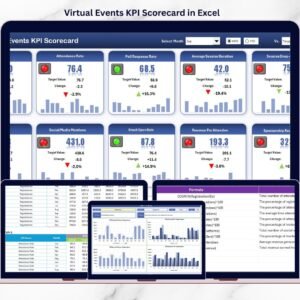
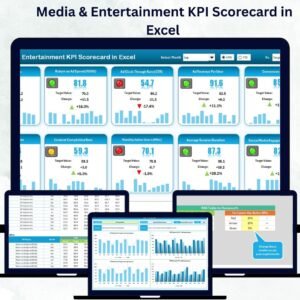
📊 Interactive KPI Dashboard
Monitor all executive coaching KPIs in one dynamic dashboard that updates automatically based on the selected month.
📅 Dynamic Month Selection
Select any month from the dropdown menu to instantly view Month-To-Date (MTD) and Year-To-Date (YTD) performance.
🎯 Actual vs Target Analysis
Compare actual results with predefined targets to quickly identify performance gaps and improvement opportunities.
📈 Previous Year Comparison
Track KPI progress by comparing current performance with previous year data.
📉 KPI Trend Visualization
Analyze KPI patterns using dynamic charts that display MTD and YTD trends.
🎨 Conditional Formatting Indicators
Visual indicators such as up and down arrows highlight performance results instantly.
📑 Detailed KPI Definitions
Each KPI includes clear definitions, formulas, measurement units, and performance types.
⚡ Structured Data Input Sheets
Dedicated sheets for Actual, Target, and Previous Year numbers ensure organized data entry and reliable analysis.
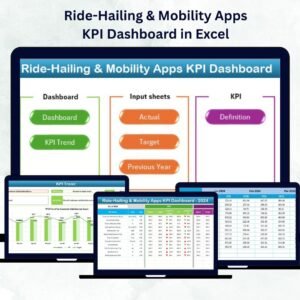
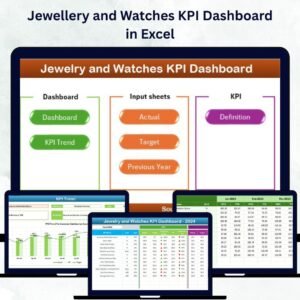
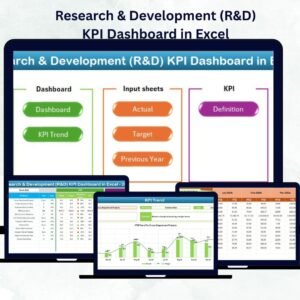
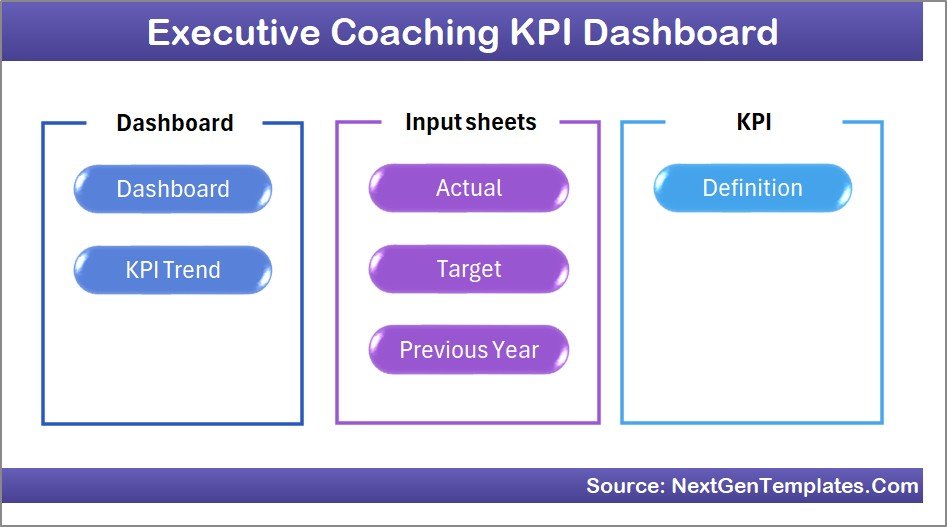
📂 What’s Inside the Executive Coaching KPI Dashboard
The Excel template contains seven well-structured worksheets designed to support comprehensive KPI monitoring.
1️⃣ Home Sheet
The Home sheet acts as the main navigation hub of the dashboard.
It includes six interactive buttons that allow users to quickly move between dashboard sections, making navigation simple and efficient.
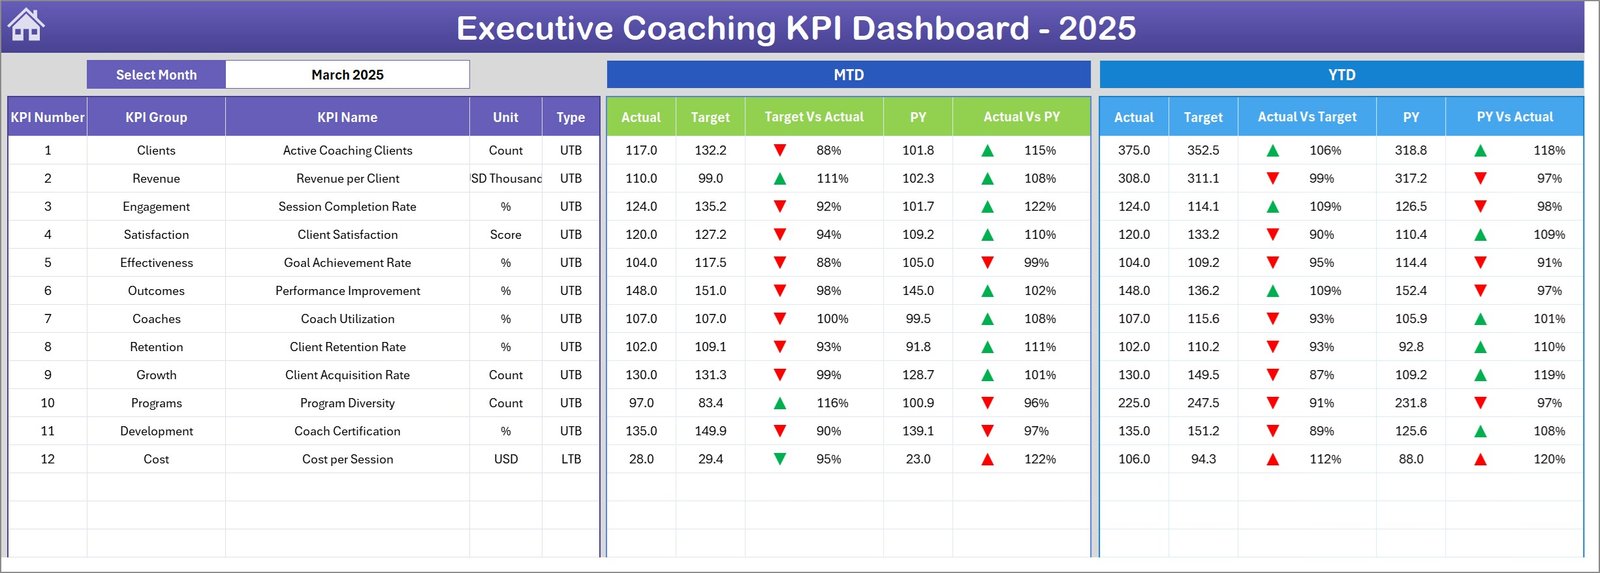
2️⃣ Dashboard Sheet
This is the main performance monitoring page where all KPIs are displayed.
Users can select a month from the dropdown menu in cell D3, which automatically updates the entire dashboard.
This sheet displays:
• Month-To-Date (MTD) Actual, Target, and Previous Year values
• Target vs Actual comparison
• Previous Year vs Actual comparison
• Year-To-Date (YTD) Actual, Target, and Previous Year values
Conditional formatting arrows provide visual performance indicators for quick interpretation.
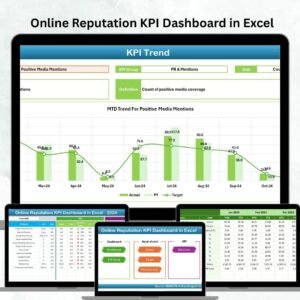
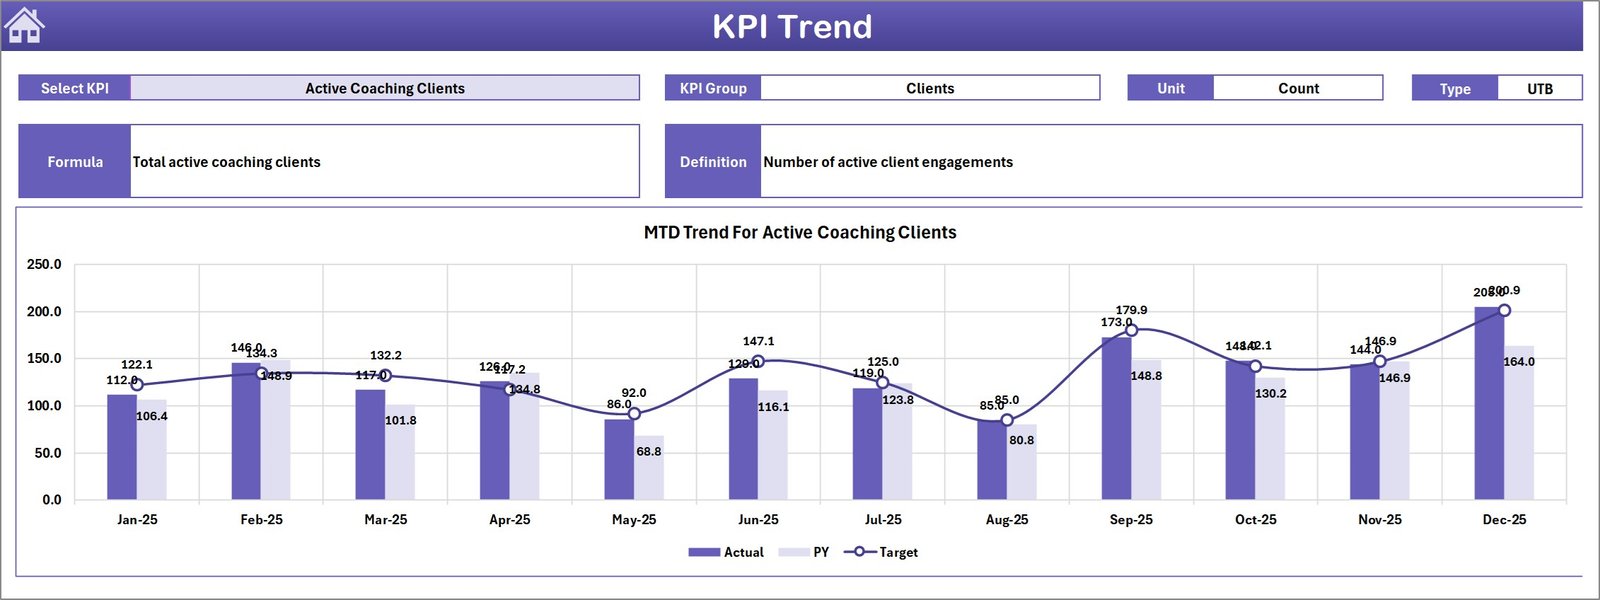
3️⃣ KPI Trend Sheet
The KPI Trend sheet allows users to analyze individual KPIs in detail.
Users select a KPI from a dropdown menu located in cell C3, which updates the sheet to display KPI information such as:
• KPI Group
• Unit of measurement
• Formula
• KPI type (Lower the Better or Upper the Better)
Trend charts display MTD and YTD values for Actual, Target, and Previous Year performance.
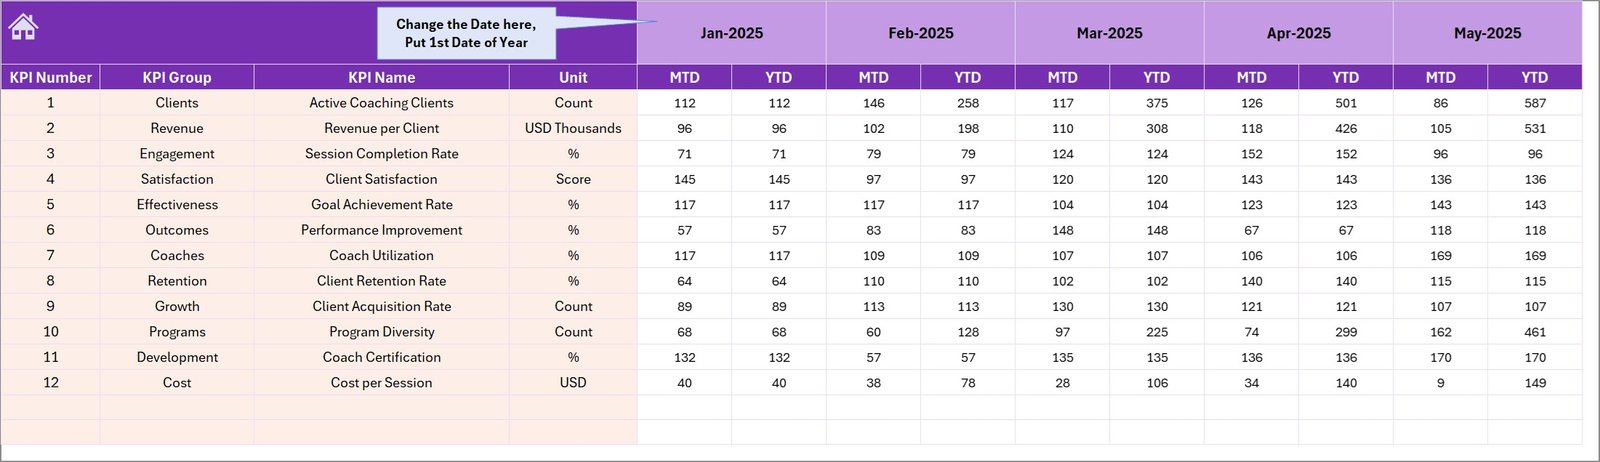
4️⃣ Actual Numbers Input Sheet
This sheet is used to enter the actual performance data for each KPI.
Users can input Month-To-Date and Year-To-Date actual values, ensuring the dashboard always reflects current performance.
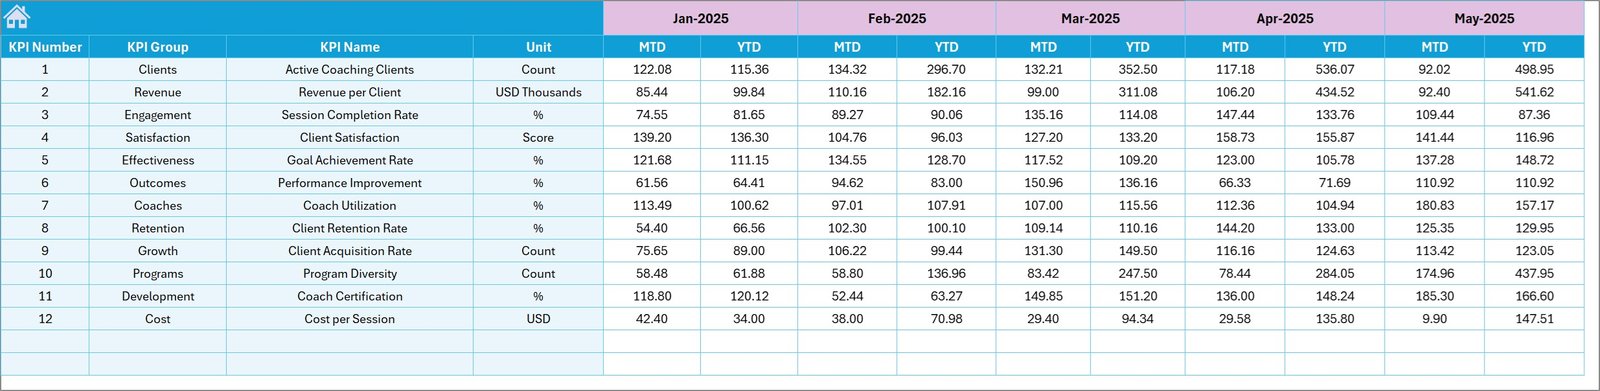
5️⃣ Target Number Input Sheet
The Target Numbers sheet allows users to input KPI targets.
These targets serve as the benchmark against which actual performance is measured.
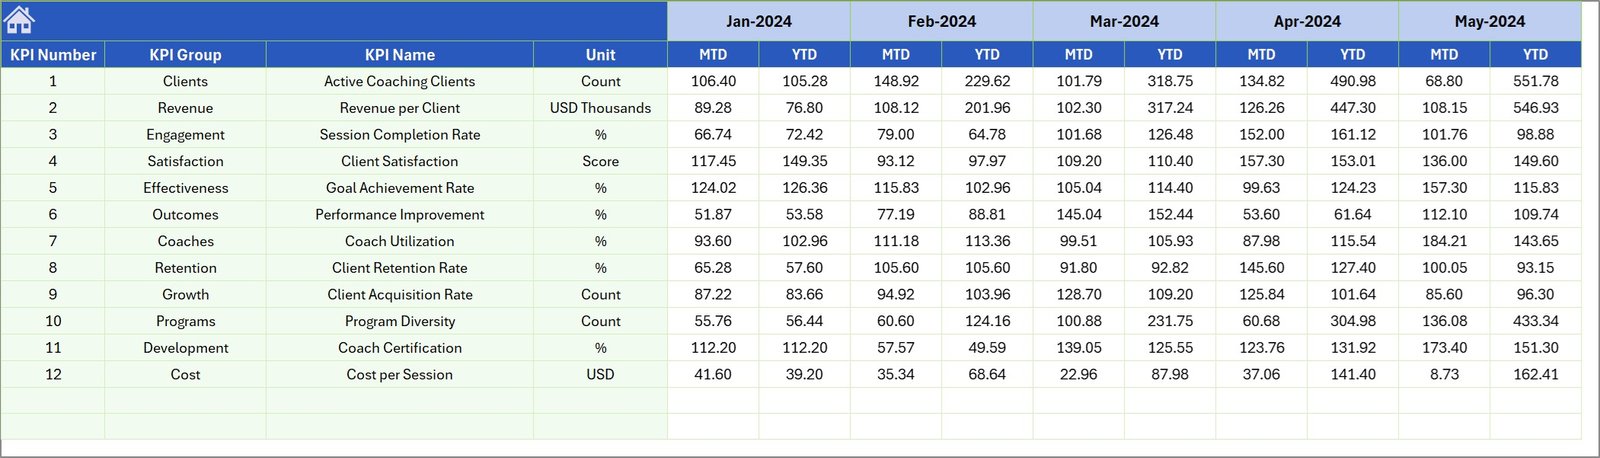
6️⃣ Previous Year Number Input Sheet
This sheet stores previous year performance data.
By maintaining historical data, the dashboard enables year-over-year performance analysis.
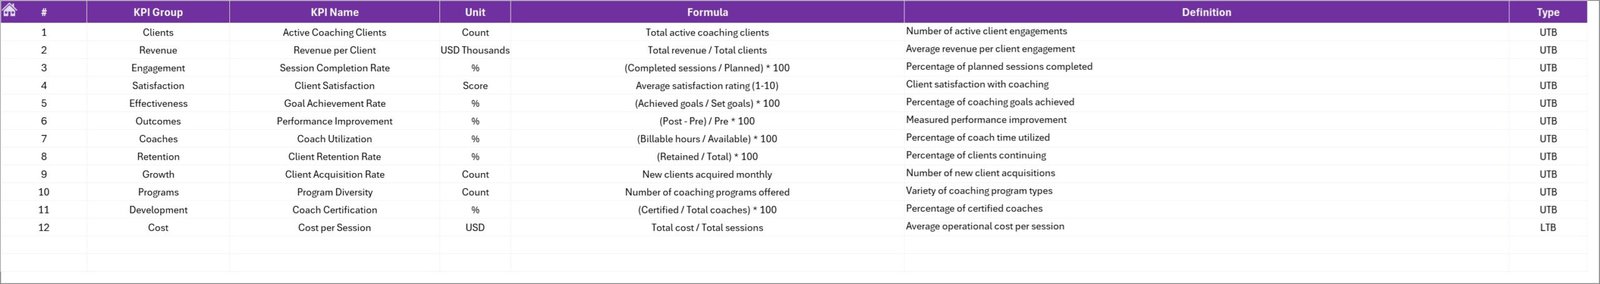
7️⃣ KPI Definition Sheet
This reference sheet contains detailed information about each KPI including:
• KPI Name
• KPI Group
• Unit of measurement
• Calculation formula
• KPI definition
• KPI type (LTB or UTB)
This ensures transparency and consistency when interpreting KPI results.
⚙️ How to Use the Executive Coaching KPI Dashboard
Using the Executive Coaching KPI Dashboard in Excel is straightforward and requires only basic Excel knowledge.
Start by defining your KPIs in the KPI Definition Sheet, including formulas and measurement units.
Next, enter your Actual performance numbers, Targets, and Previous Year data in their respective input sheets.
Once the data is entered, the Dashboard Sheet automatically updates, providing instant performance insights.
Users can select different months from the dropdown menu to analyze monthly performance.
For deeper analysis, the KPI Trend Sheet helps visualize performance trends over time.
This structured approach allows organizations to quickly evaluate coaching results and identify improvement opportunities.
👥 Who Can Benefit from This Executive Coaching KPI Dashboard
This Excel dashboard template is designed for organizations and professionals involved in leadership development and performance improvement.
👨💼 Executive Coaches – Track coaching outcomes and measure leadership development progress.
🏢 Corporate Leadership Teams – Monitor strategic performance indicators related to executive coaching.
📊 HR and Talent Development Teams – Evaluate the effectiveness of coaching programs.
📈 Consulting Firms – Provide KPI tracking tools to coaching clients.
🎓 Leadership Development Programs – Monitor participant performance and improvement metrics.
💼 Business Executives – Gain insights into coaching impact and leadership performance.
With this dashboard, organizations can make data-driven decisions that enhance leadership development and organizational success.
Click here to read the Detailed blog post
Visit our YouTube channel to learn step-by-step video tutorials
https://youtube.com/@PKAnExcelExpert