Managing airport infrastructure is not a simple task. Airports handle thousands of passengers, aircraft movements, baggage operations, and cargo activities every day. Airport authorities must constantly monitor infrastructure utilization, operational efficiency, safety performance, and service quality.
However, many airport management teams still depend on multiple reports and scattered spreadsheets to analyze performance. This makes it difficult to identify operational issues quickly or track performance trends.
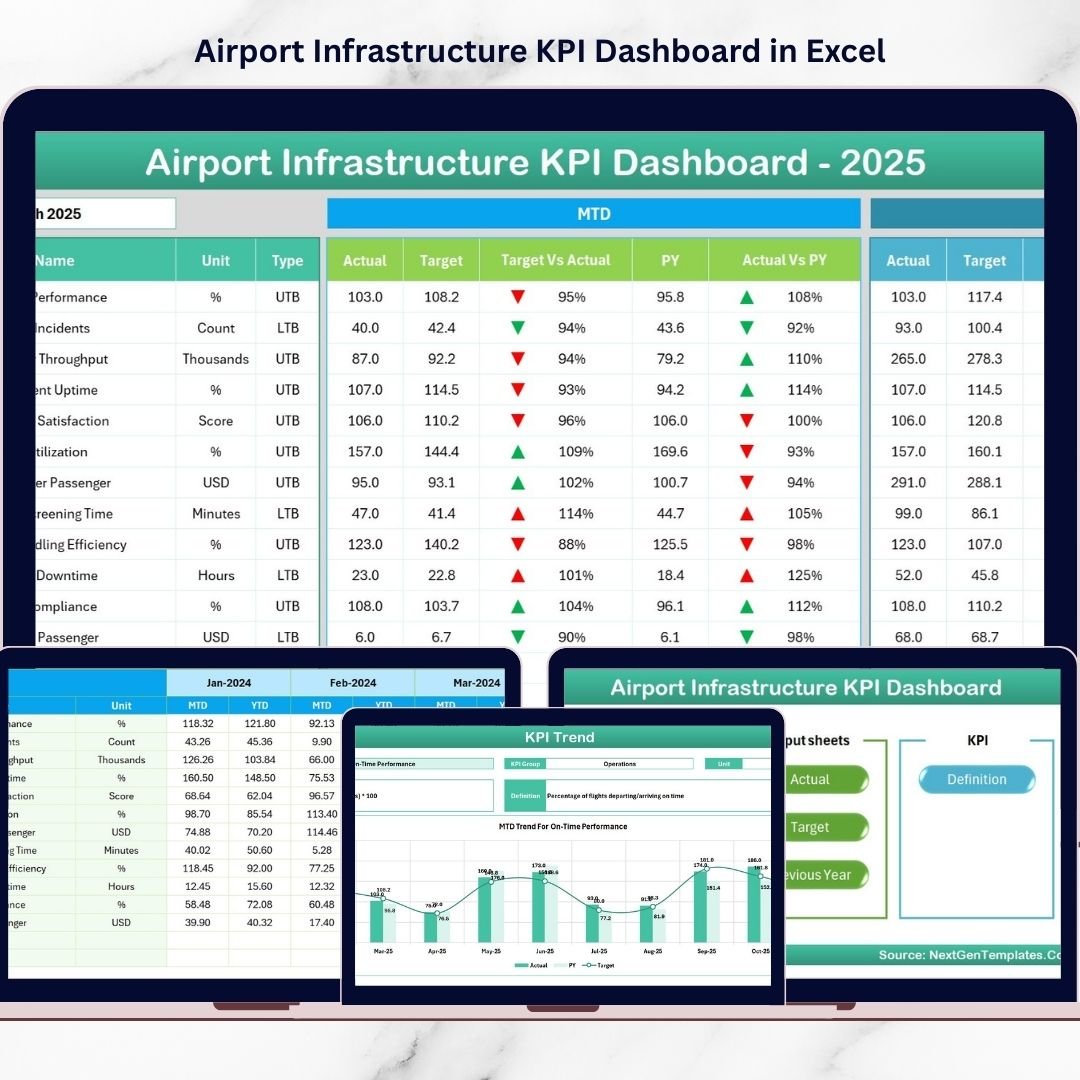
The Airport Infrastructure KPI Dashboard in Excel provides a powerful and easy-to-use solution. This ready-to-use Excel dashboard helps airport authorities monitor infrastructure performance, compare targets with actual results, and analyze operational trends using a single centralized system.
Instead of reviewing multiple reports, managers can instantly track airport KPIs through interactive charts, automated calculations, and performance indicators.
✈️ Key Features of Airport Infrastructure KPI Dashboard in Excel
📊 Interactive KPI Monitoring
Monitor multiple airport infrastructure KPIs in a single centralized dashboard.
📅 Dynamic Month Selection
Select the desired month from a dropdown, and the entire dashboard updates automatically.
📈 MTD and YTD Performance Tracking
Track both Month-to-Date and Year-to-Date performance metrics for each KPI.
🎯 Target vs Actual Comparison
Compare operational targets with actual results to quickly identify performance gaps.
📉 Previous Year Comparison
Evaluate performance trends by comparing current data with previous year metrics.
📊 Conditional Formatting Indicators
Up and down arrows instantly highlight performance improvements or declines.
📑 Multiple Analytical Worksheets
The dashboard contains 7 structured worksheets designed for complete KPI tracking.
⚡ Easy Data Entry System
Users can enter monthly performance data in a dedicated input sheet.
📊 Visual Trend Analysis
Analyze performance trends using automated MTD and YTD charts.
💻 100% Excel-Based Solution
No additional software required. Works seamlessly within Microsoft Excel.
📦 What’s Inside the Airport Infrastructure KPI Dashboard in Excel
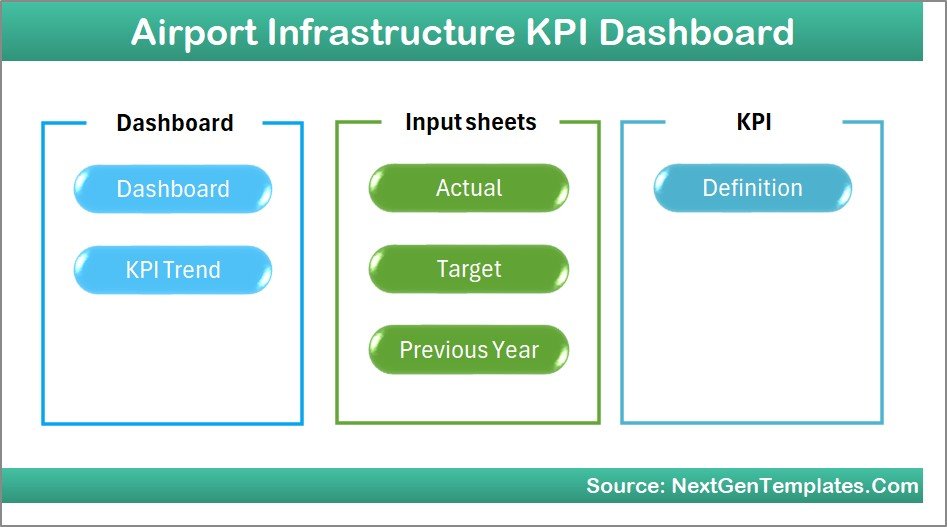
This ready-to-use dashboard includes 7 structured worksheets designed for comprehensive airport infrastructure monitoring.
1️⃣ Home Sheet
Acts as the dashboard navigation center. It contains six navigation buttons that allow users to quickly jump to different sheets.
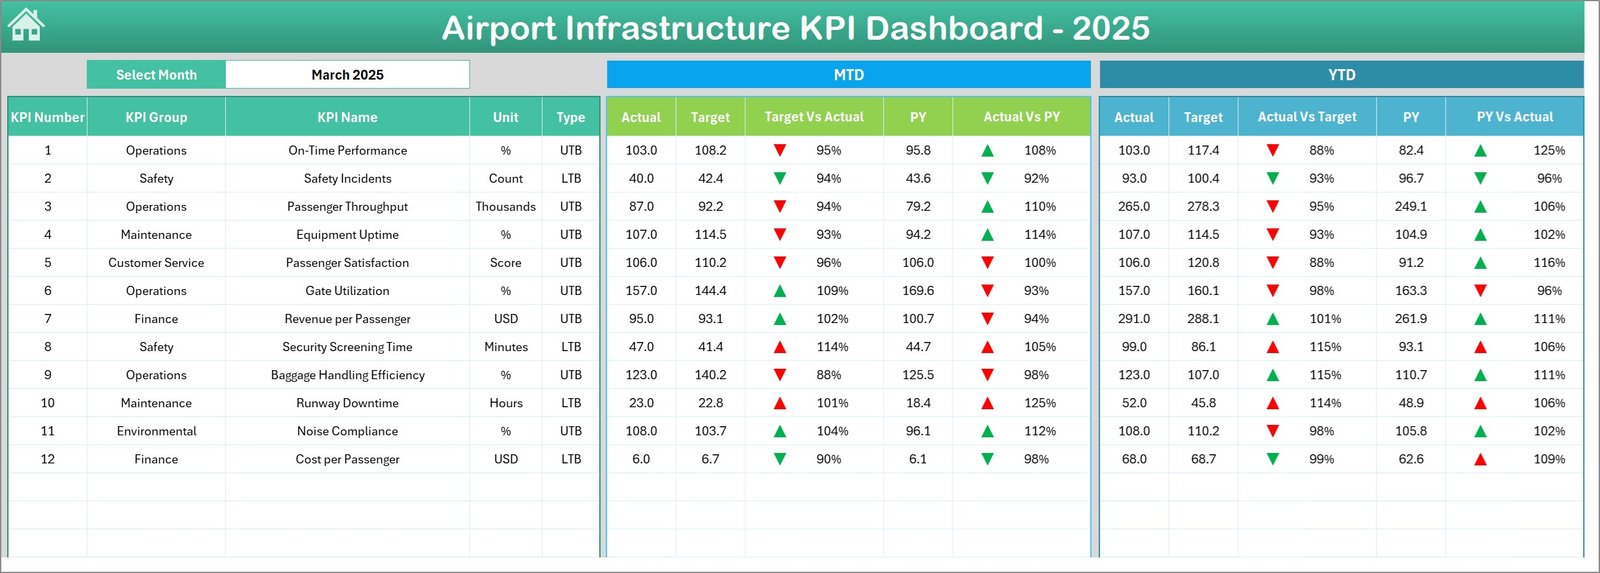
2️⃣ Main Dashboard Sheet
Displays the main performance overview of all airport KPIs.
Key metrics displayed include:
-
MTD Actual, Target, and Previous Year values
-
YTD Actual, Target, and Previous Year values
-
Target vs Actual comparison
-
Previous Year vs Actual comparison
Performance indicators with arrows help users instantly identify whether KPIs are improving or declining.
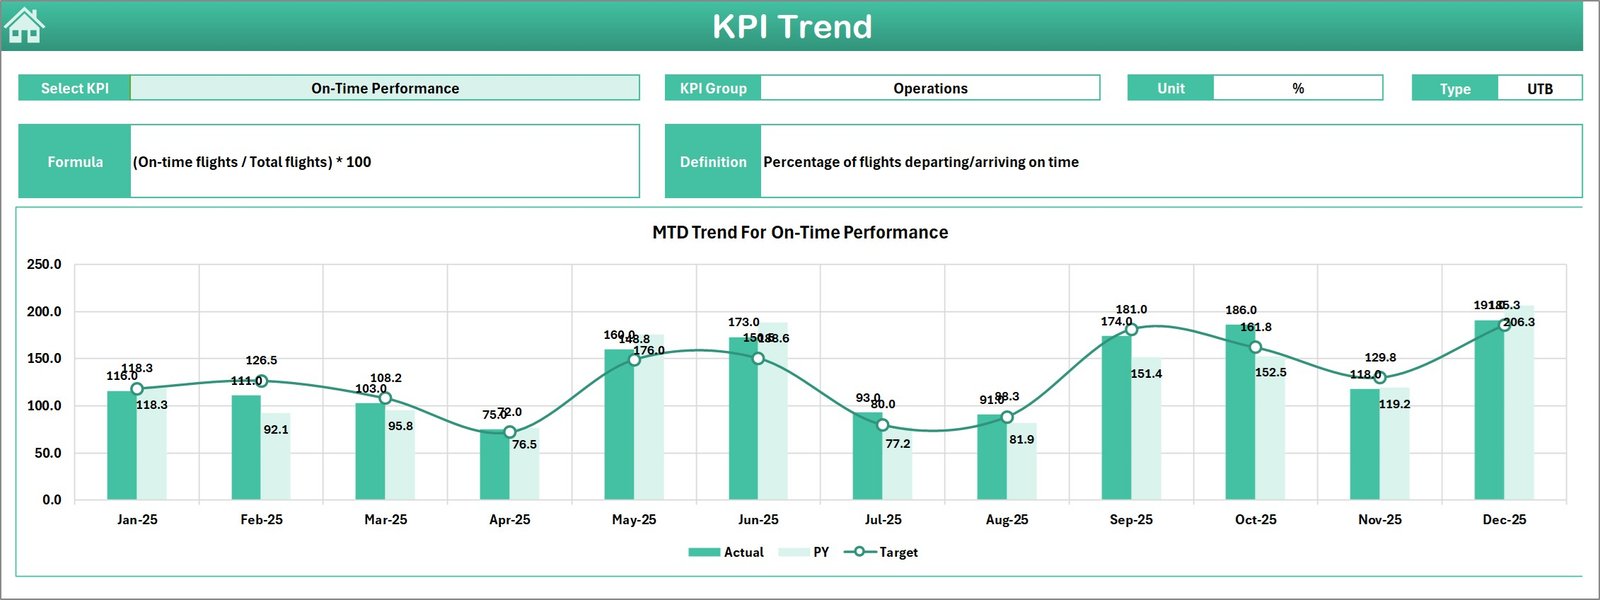
3️⃣ KPI Trend Sheet
This sheet provides detailed KPI trend analysis.
Users can select a KPI from the dropdown in cell C3. The sheet displays:
-
KPI group
-
Unit of measurement
-
KPI type
-
KPI formula
-
KPI definition
Trend charts visualize MTD and YTD performance trends for deeper analysis.
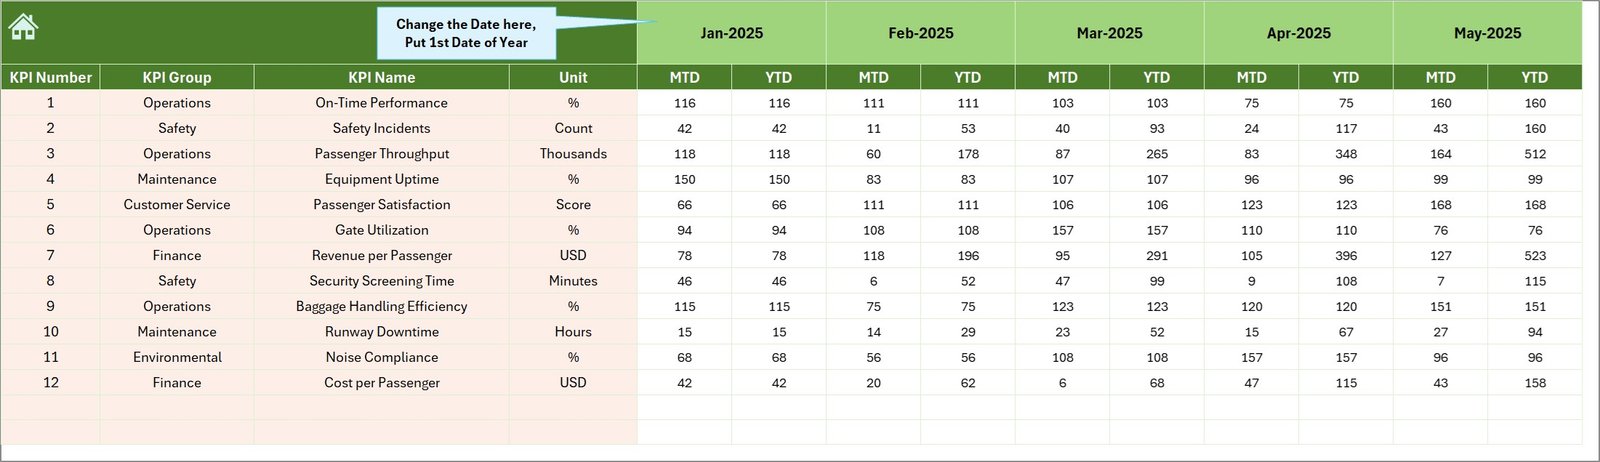
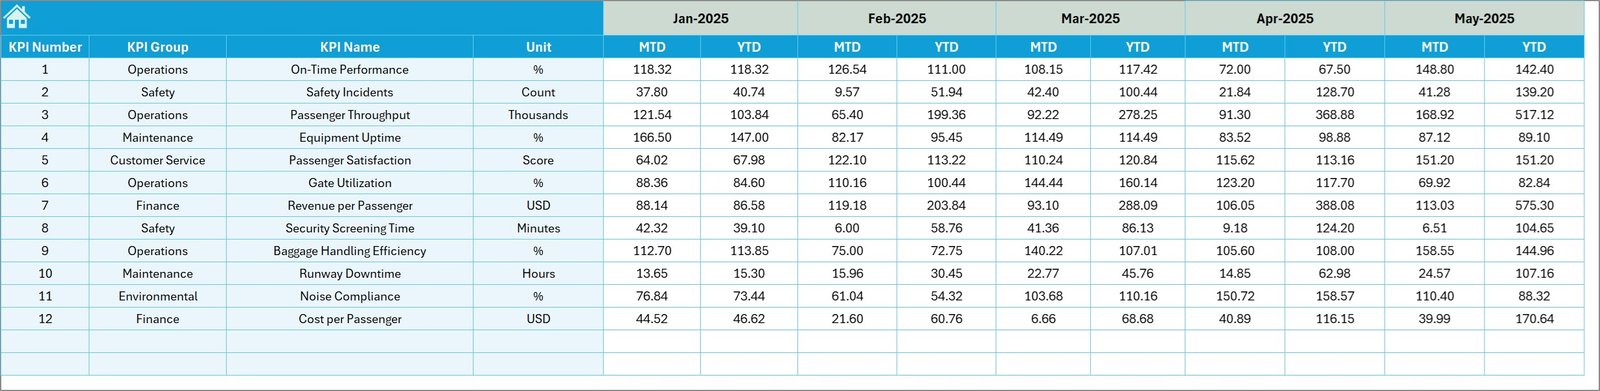
4️⃣ Actual Numbers Input Sheet
This sheet is used for entering operational performance data.
Users input monthly KPI data, which automatically updates the dashboard.
5️⃣ Target Sheet
Stores KPI targets defined by airport management for the year.
The dashboard automatically compares actual performance against these targets.
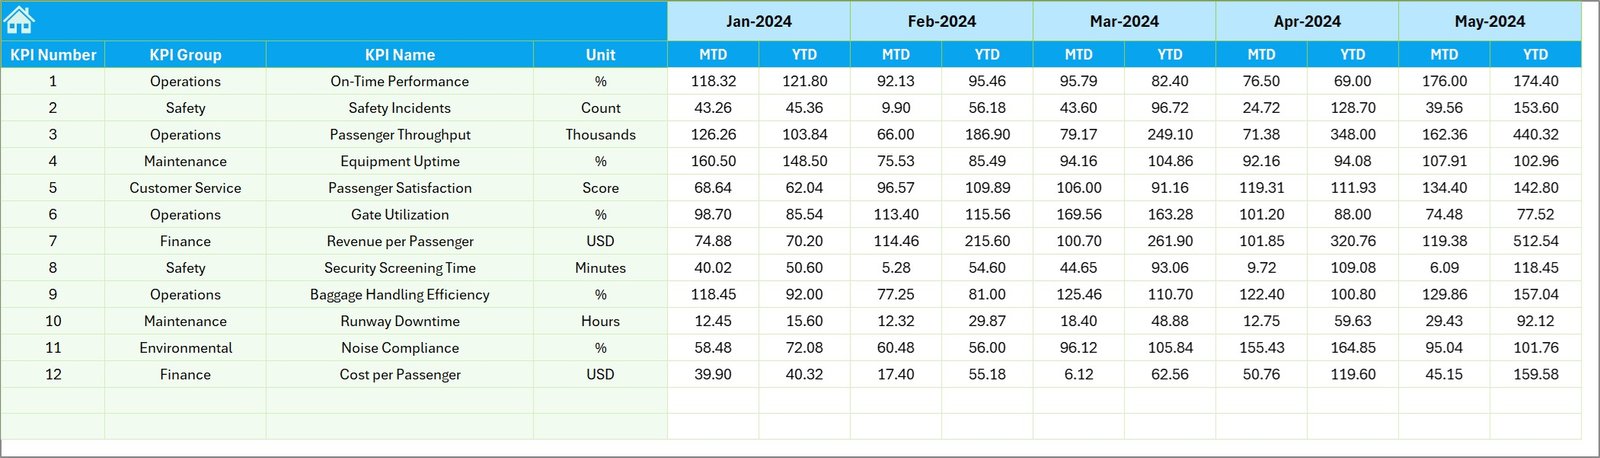
6️⃣ Previous Year Numbers Sheet
Stores historical KPI data from the previous year to support performance benchmarking.
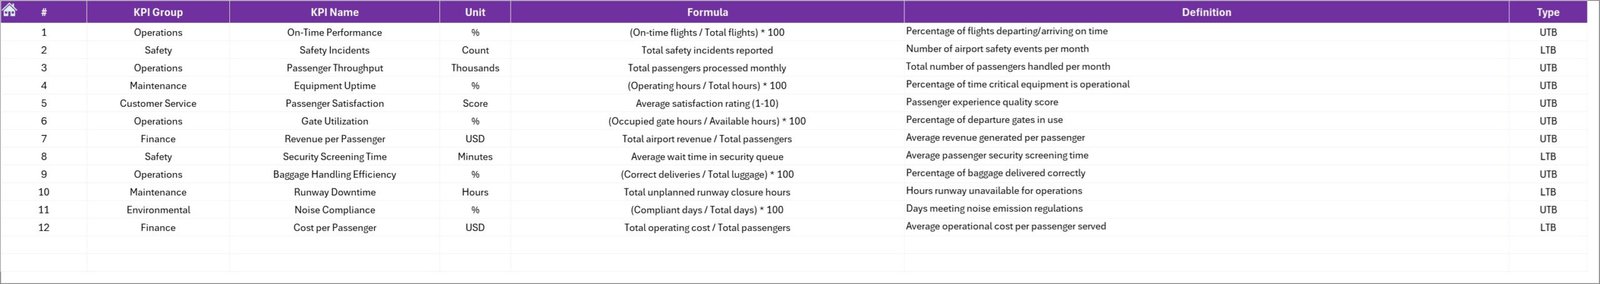
7️⃣ KPI Definition Sheet
This sheet contains master KPI definitions including KPI formulas, units, and groups to maintain data consistency.
⚙️ How to Use the Airport Infrastructure KPI Dashboard in Excel
Using this dashboard is extremely simple and does not require advanced Excel knowledge.
Step 1 – Enter Actual Data
Input monthly operational KPI data in the Actual Numbers Input sheet.
Step 2 – Add KPI Targets
Enter yearly performance targets in the Target sheet.
Step 3 – Enter Previous Year Data
Input historical KPI values in the Previous Year Numbers sheet.
Step 4 – Select the Month
Choose the desired month from the dropdown on the Dashboard sheet.
Step 5 – Analyze Performance
View automated charts, comparisons, and trend analysis to monitor airport performance.
Within seconds, airport managers can evaluate infrastructure utilization, operational efficiency, and service performance.
👨✈️ Who Can Benefit from This Airport Infrastructure KPI Dashboard
This dashboard is designed for professionals responsible for managing airport infrastructure and operations.
✈️ Airport Operations Managers
📊 Infrastructure Planning Teams
🛫 Airport Authority Decision Makers
📉 Aviation Data Analysts
🏗 Airport Maintenance Departments
📑 Government Aviation Regulators
📊 Strategic Planning Teams
💰 Airport Finance Departments
These teams can use the dashboard to monitor airport KPIs, identify performance gaps, and support data-driven decision-making.
By using this dashboard regularly, airport management can improve operational efficiency, enhance passenger experience, and optimize infrastructure utilization.
Click here to read the Detailed blog post
Visit our YouTube channel to learn step-by-step video tutorials
https://Youtube.com/@PKAnExcelExpert


