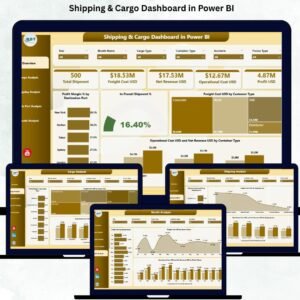
The maritime Ship Chartering Dashboard drives global trade, transporting commodities such as crude oil, grains, coal, fertilizers, and manufactured goods across international waters. However, managing ship chartering operations is highly complex because it involves multiple operational and financial variables including charter contracts, fuel expenses, cargo types, loading ports, discharge ports, and revenue performance.
Many shipping companies still rely on scattered spreadsheets and manual reporting systems to track charter operations. As a result, decision-makers often struggle to monitor contract performance, evaluate fuel costs, analyze revenue trends, and detect operational delays quickly.
That is where the Ship Chartering Dashboard in Power BI becomes an extremely powerful analytics solution.
This ready-to-use Power BI dashboard converts raw chartering data into clear visual insights. Instead of reviewing multiple reports, managers can monitor charter contracts, analyze operational metrics, evaluate fuel expenses, and track revenue performance from a single interactive dashboard.
Because Power BI provides dynamic charts, filters, and KPI indicators, organizations can instantly analyze shipping operations and make smarter data-driven decisions.
If you want real-time visibility into chartering operations and improved operational control, this dashboard provides the perfect solution.
🚢 Key Feature of Ship Chartering Dashboard in Power BI
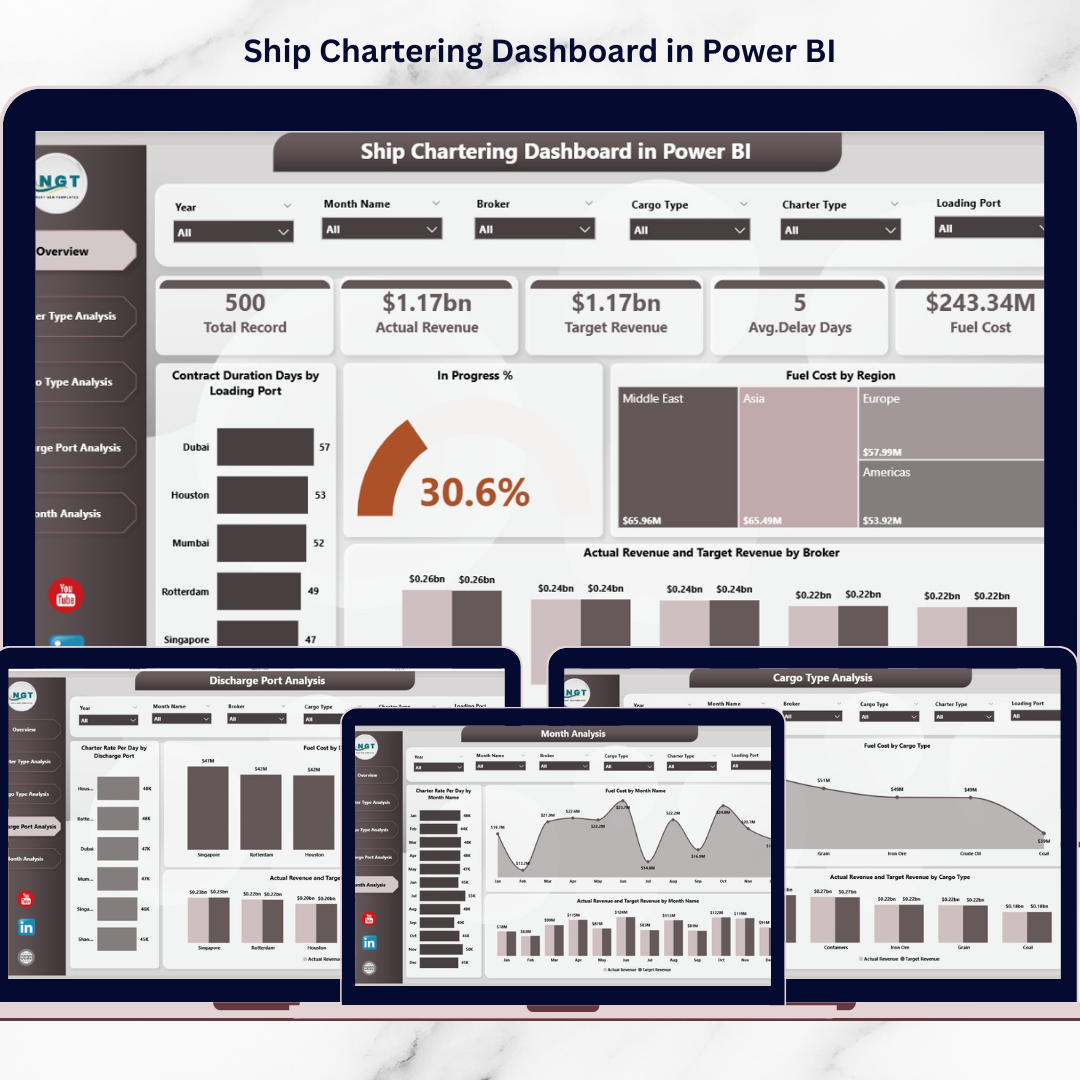
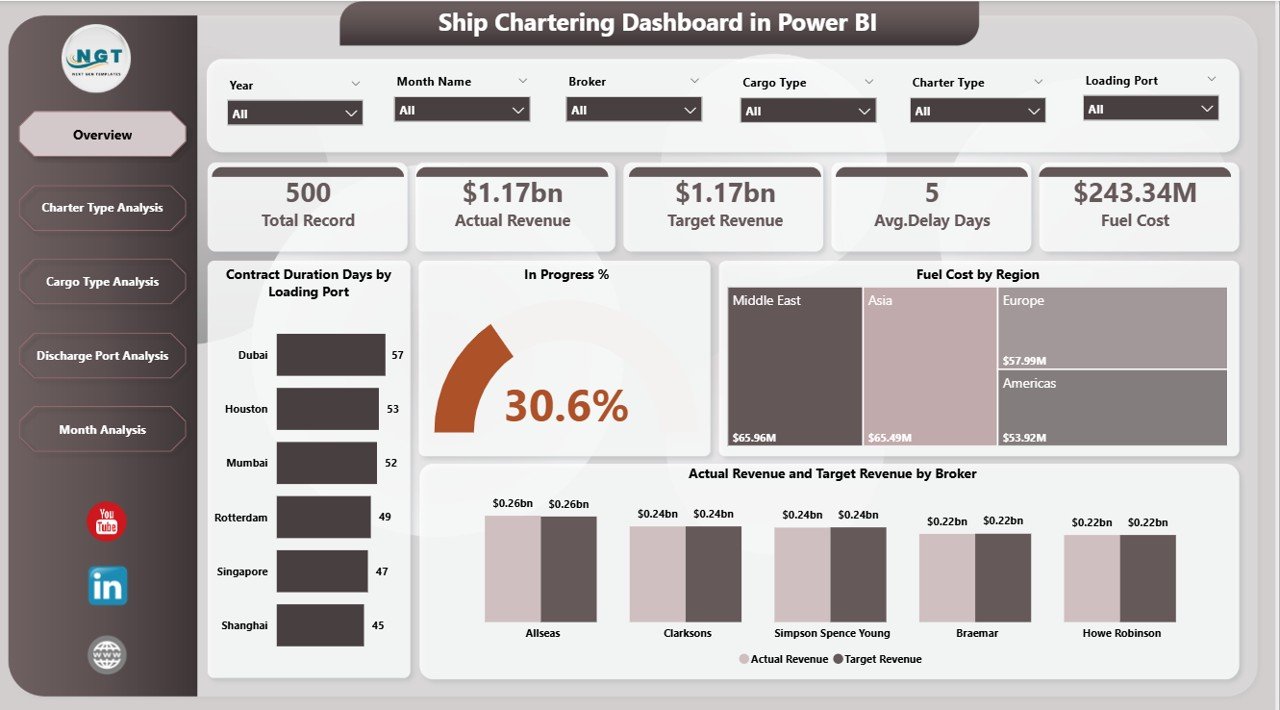
This advanced Power BI dashboard includes five analytical pages, each designed to analyze chartering performance from different operational perspectives.
📊 Overview Dashboard Page – Provides a complete snapshot of charter operations with KPI cards and visual charts.
🎯 Interactive Slicers & Filters – Analyze data dynamically by charter type, cargo type, loading port, discharge port, broker, and month.
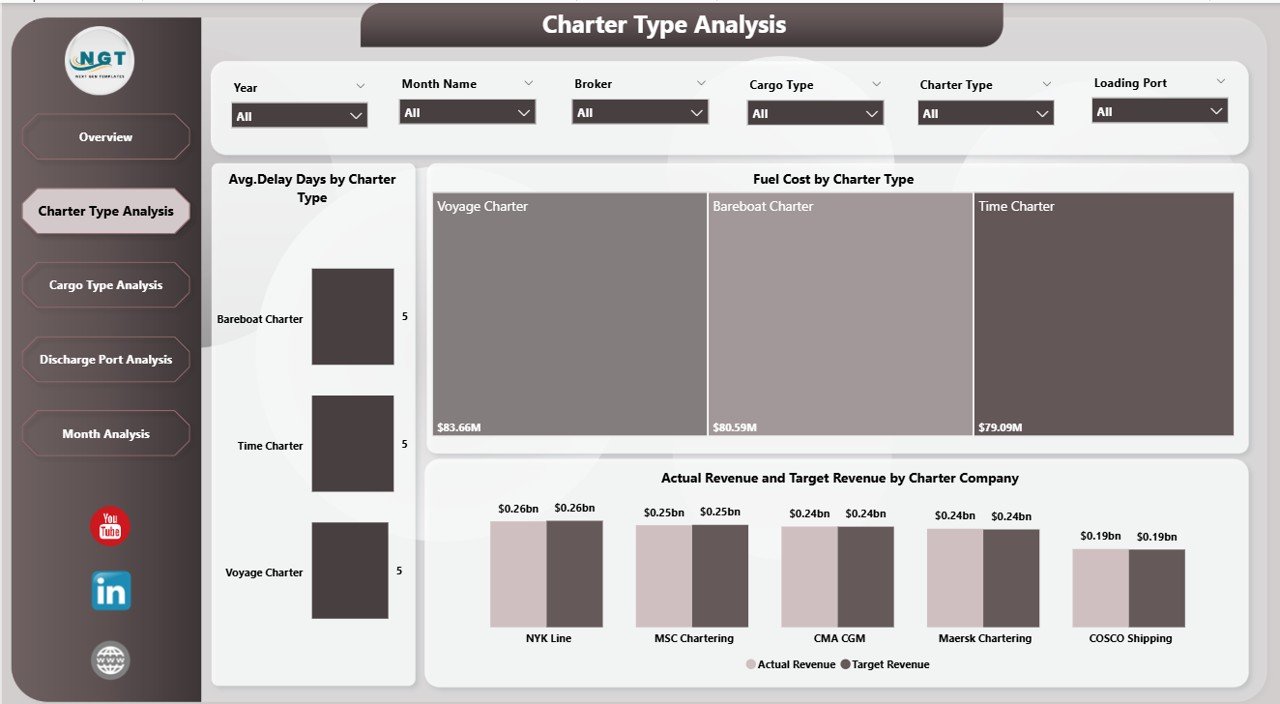
⛽ Fuel Cost Monitoring – Track fuel consumption across regions, cargo types, and charter contracts.
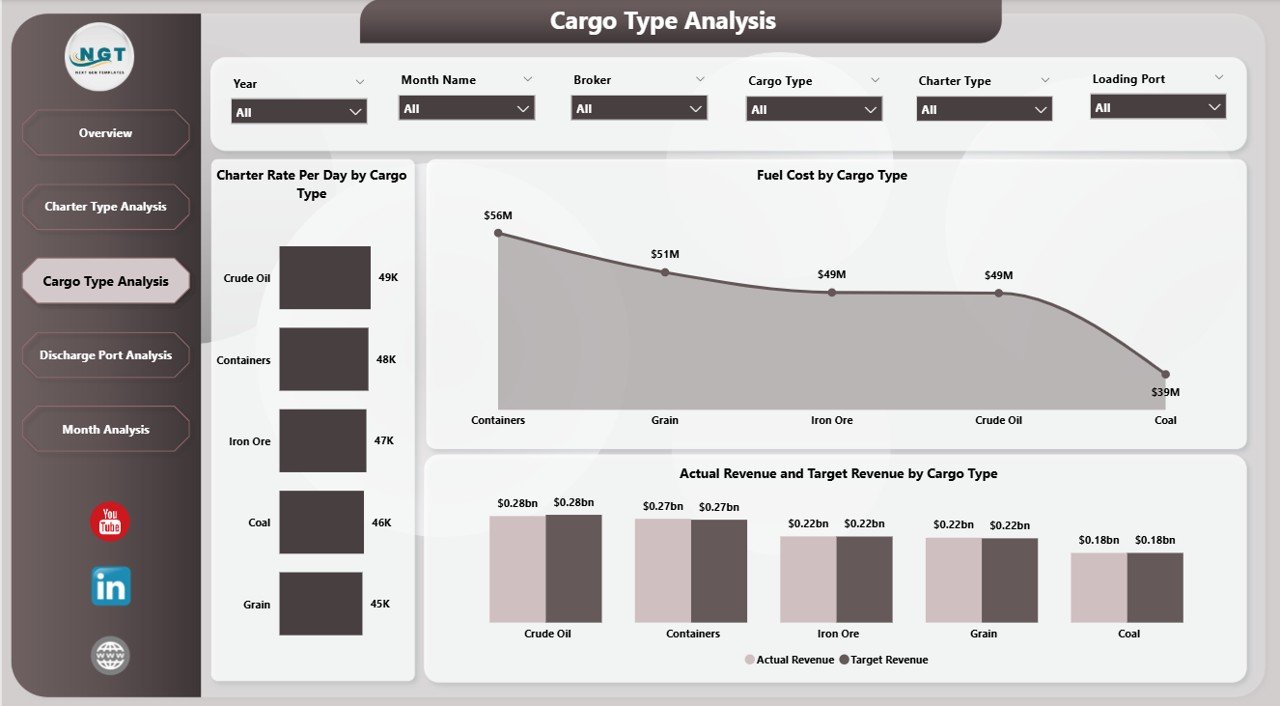
📈 Charter Rate Analysis – Monitor charter rate per day across different ports and cargo operations.
📦 Cargo Performance Insights – Evaluate operational efficiency across cargo categories.
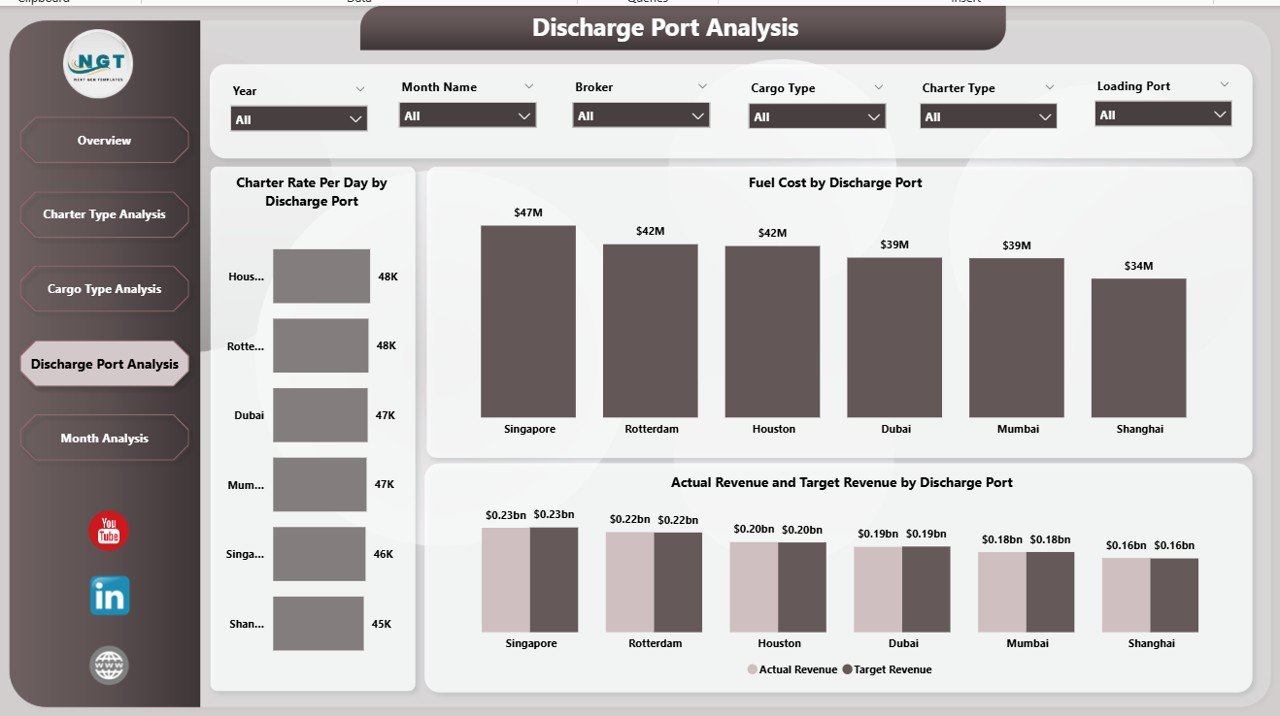
⚓ Port Performance Monitoring – Analyze charter performance across loading and discharge ports.
📊 Revenue Performance Tracking – Compare actual revenue with target revenue.
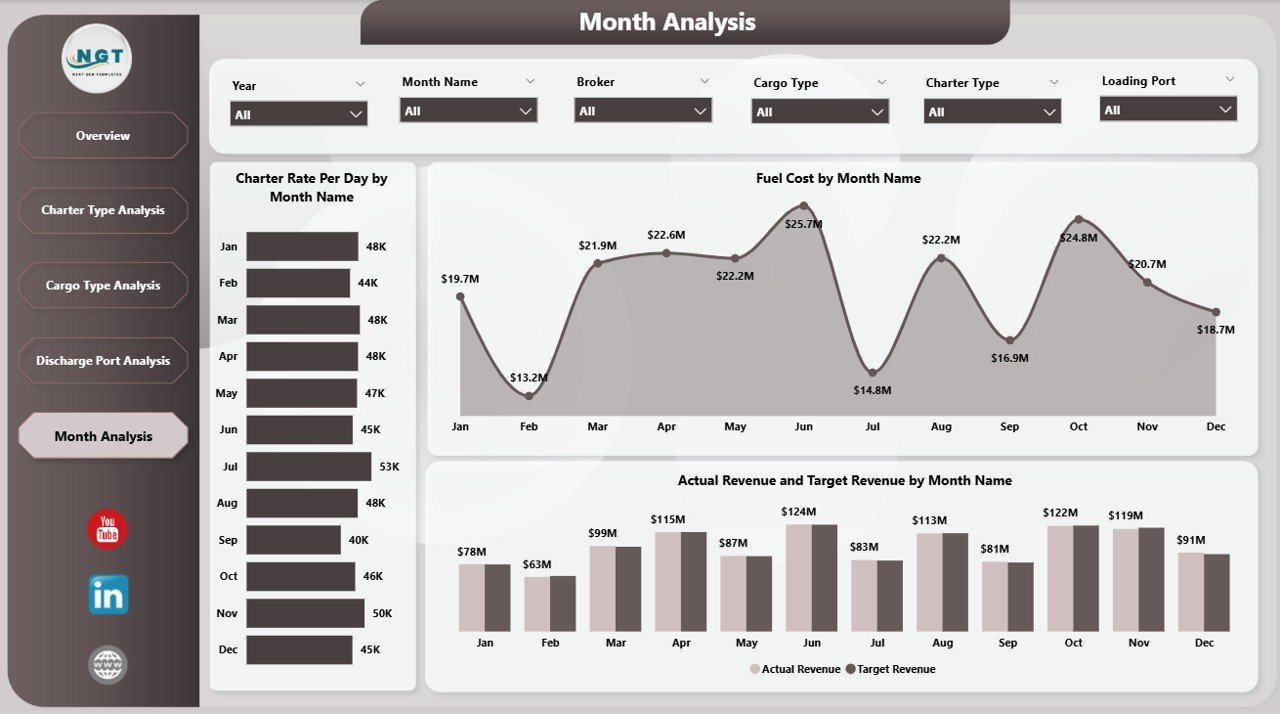
📅 Monthly Trend Analysis – Monitor seasonal patterns in charter operations and revenue performance.
Because Power BI dashboards update dynamically, users can filter data instantly and analyze chartering performance in real time.
📦 What’s Inside the Ship Chartering Dashboard in Power BI
The dashboard uses a structured data model that integrates operational, financial, and logistics metrics.
Inside the dashboard, you get:
✅ Overview Page – Central operational performance monitoring
✅ Charter Type Analysis Page – Charter contract performance insights
✅ Cargo Type Analysis Page – Cargo category performance analysis
✅ Discharge Port Analysis Page – Port efficiency and revenue monitoring
✅ Month Analysis Page – Time-based operational trends
✅ Interactive KPI Cards – Key operational and financial metrics
✅ Dynamic Filters & Slicers – Instant data exploration
The dashboard typically uses structured datasets containing fields such as:
Charter ID
Vessel Name
Charter Type
Cargo Type
Loading Port
Discharge Port
Broker Name
Fuel Cost
Charter Rate Per Day
Contract Duration
Delay Days
Revenue
Month
Power BI can connect this data from multiple sources including:
Excel files
Shipping management systems
Financial databases
ERP systems
Cloud data platforms
Because of this flexibility, the dashboard can scale as business operations grow.
⚙️ How to Use the Ship Chartering Dashboard in Power BI
Using this dashboard is simple and efficient.
1️⃣ Import chartering data into Power BI from Excel or other operational systems.
2️⃣ Ensure data relationships are correctly defined in the data model.
3️⃣ Refresh the dashboard to update visuals.
4️⃣ Use slicers to filter data by charter type, cargo type, port, broker, or month.
5️⃣ Analyze operational trends, fuel costs, and revenue performance.
Within seconds, decision-makers gain a comprehensive overview of charter operations.
Basic Power BI knowledge is enough to use this dashboard effectively.
👥 Who Can Benefit from This Ship Chartering Dashboard in Power BI
This dashboard is designed for professionals working in maritime logistics and shipping operations.
It is particularly useful for:
🚢 Shipping Companies
⚓ Vessel Operators
📦 Maritime Logistics Firms
📊 Charter Brokers
📈 Shipping Analysts
🚚 Global Trade Operations Teams
Because the dashboard simplifies complex operational data, both technical teams and executives can easily analyze shipping performance.
💡 Why This Dashboard Improves Chartering Operations
✔ Centralized monitoring of charter operations
✔ Real-time operational insights
✔ Faster identification of delays and inefficiencies
✔ Improved fuel cost tracking
✔ Better cargo and port performance analysis
✔ Accurate revenue performance monitoring
✔ Data-driven chartering strategy optimization
✔ Scalable and customizable analytics system
Instead of relying on manual reporting, shipping companies gain instant operational insights that support smarter maritime decisions.
This dashboard transforms chartering data into actionable intelligence for the global shipping industry.
### Click here to read the Detailed blog post
Visit our YouTube channel to learn step-by-step video tutorials
Youtube.com/@PKAnExcelExpert