Bridge construction projects involve complex coordination, strict timelines, large budgets, and multiple stakeholders. However, many construction companies still rely on manual spreadsheets and scattered reports to monitor project performance. As a result, project managers often struggle to track KPIs, analyze performance trends, and identify potential risks on time.
That is exactly where the Bridge Construction KPI Dashboard in Power BI becomes a powerful business intelligence solution.
This ready-to-use Power BI dashboard helps construction companies, infrastructure firms, and project managers monitor key performance indicators in a centralized and interactive environment. Instead of reviewing multiple project reports manually, all bridge construction metrics can be analyzed through a single visual dashboard.
Using Power BI’s advanced data visualization capabilities, this dashboard transforms raw construction data into meaningful insights. Managers can track project progress, analyze productivity levels, compare targets with actual results, and evaluate historical performance instantly.
Whether you are managing government infrastructure projects, large construction operations, or engineering teams, this Power BI dashboard simplifies KPI tracking and improves project decision-making.
By combining Excel data sources with Power BI visual analytics, organizations can monitor bridge construction performance in real time and ensure projects stay on track.
🚀 Key Feature of Bridge Construction KPI Dashboard in Power BI
📊 Interactive Construction KPI Dashboard
Monitor all bridge construction KPIs through one centralized Power BI interface with powerful visual analytics.
📅 Dynamic Month and KPI Filters
Use slicers to filter performance data by month or KPI group for deeper insights.
📈 MTD and YTD Performance Monitoring
Track Month-to-Date (MTD) and Year-to-Date (YTD) KPI performance to evaluate project progress accurately.
🎯 Target vs Actual Performance Analysis
Quickly compare actual results with targets to identify performance gaps.
📉 Previous Year Comparison
Analyze current project performance against previous year results to evaluate long-term improvements.
📊 Advanced Data Visualization
The dashboard includes KPI cards, tables, combo charts, and visual indicators for easy analysis.
🔍 Drill-Through KPI Details
Users can drill into detailed KPI information including formula, definition, and measurement unit.
⚡ Real-Time Data Refresh
Once Excel data is updated, Power BI refreshes the dashboard automatically.
📦 What’s Inside the Bridge Construction KPI Dashboard in Power BI
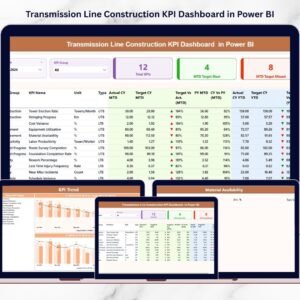
This Power BI dashboard includes three powerful analytical pages designed for complete KPI monitoring.
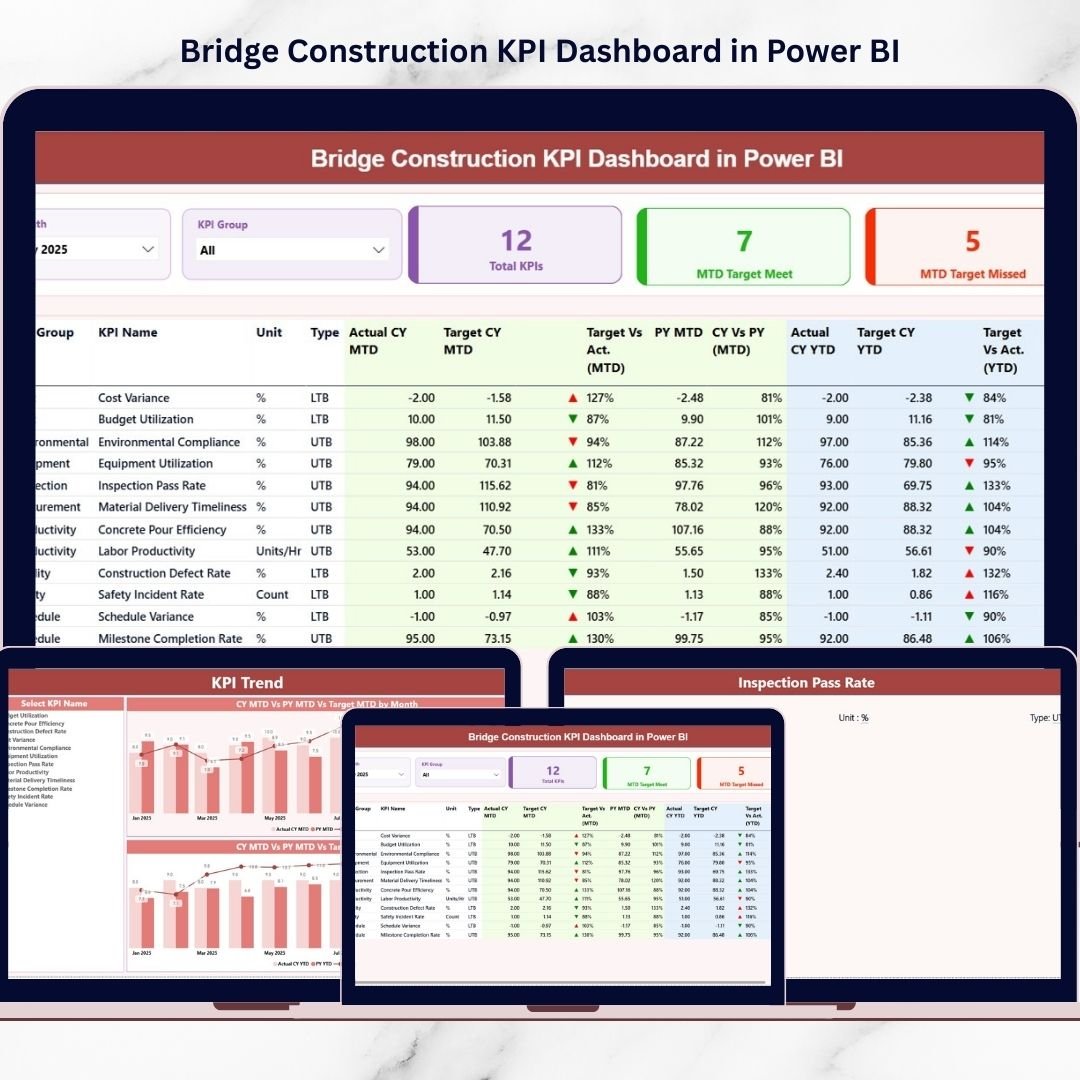
📍 Summary Page – KPI Performance Overview
This page acts as the main performance monitoring interface.
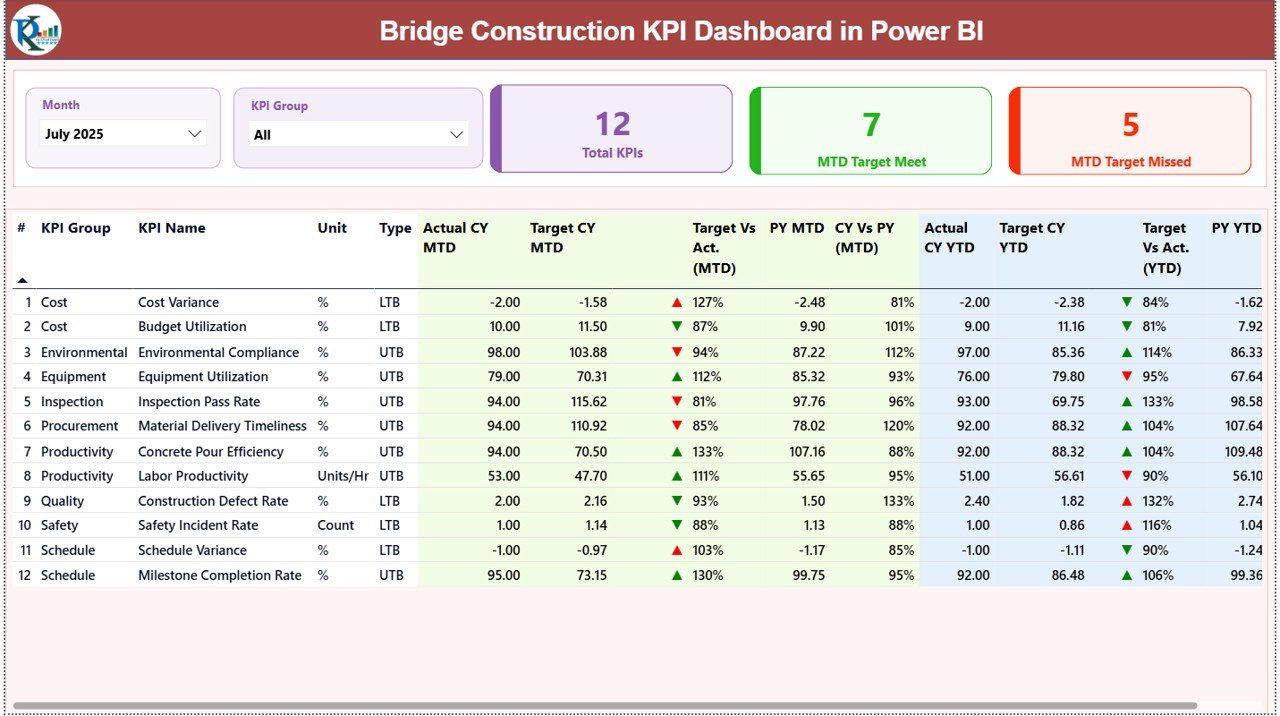
It includes:
• Month and KPI group slicers
• KPI performance summary cards
• Target vs Actual comparison metrics
• Previous year comparison indicators
• Detailed KPI performance table
Managers can instantly evaluate which KPIs meet targets and which require attention.
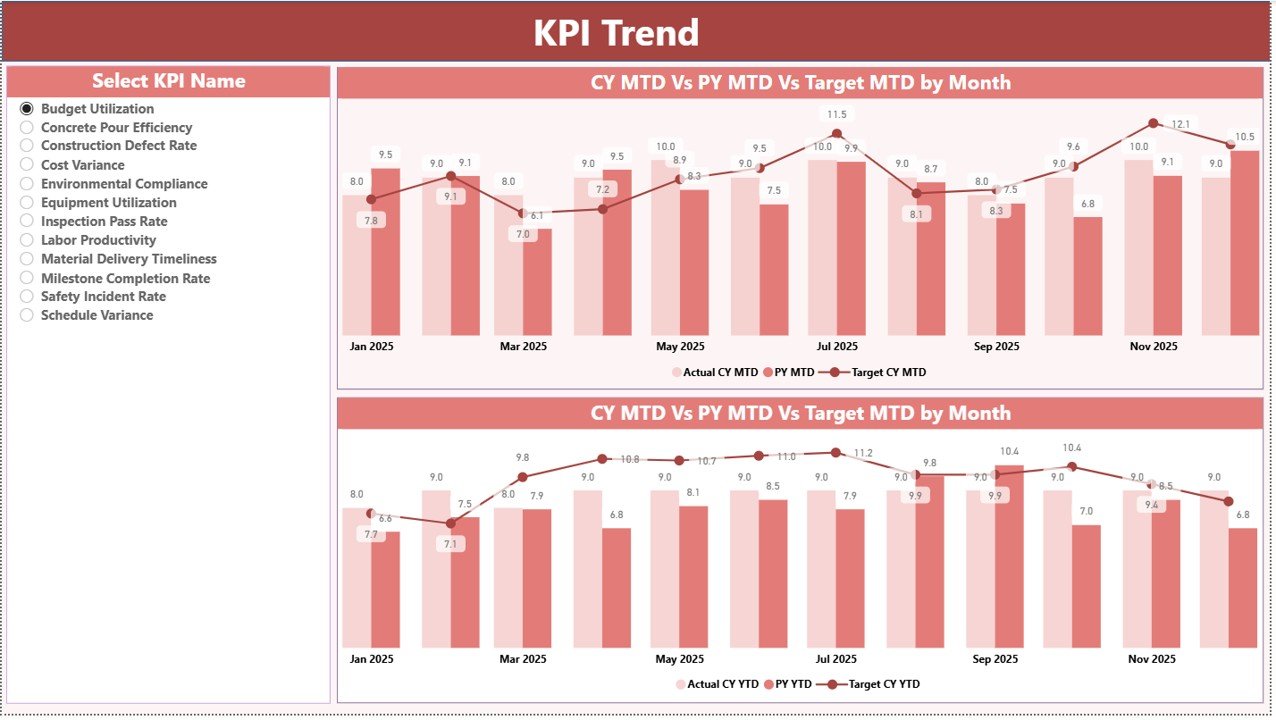
📍 KPI Trend Page – Performance Trend Analysis
This page helps project managers analyze KPI performance over time.
Features include:
• MTD trend combo chart
• YTD trend combo chart
• KPI selection slicer
Users can select a specific KPI and analyze how performance changes throughout the year.
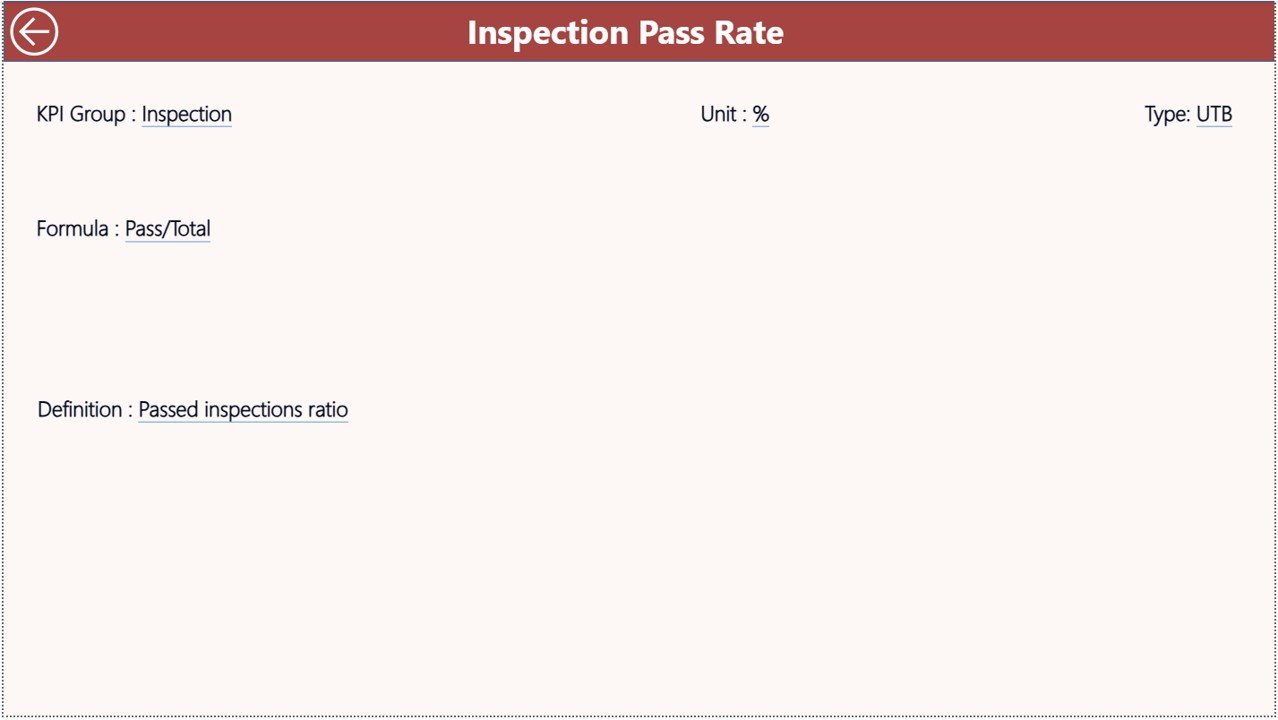
📍 KPI Definition Page – Detailed KPI Information
This page acts as a drill-through page that displays detailed KPI information such as:
• KPI Formula
• KPI Definition
• KPI Group
• KPI Unit
• KPI Type (LTB or UTB)
This helps users understand KPI calculations and performance indicators clearly.
🛠 How to Use the Bridge Construction KPI Dashboard in Power BI
Using this Power BI dashboard is simple and efficient.
Step 1 – Enter KPI Definitions
Add KPI details such as name, group, formula, and type in the KPI Definition Sheet in Excel.
Step 2 – Enter Target Values
Input KPI targets in the Input Target Sheet to define performance expectations.
Step 3 – Enter Actual KPI Data
Add monthly actual KPI values in the Input Actual Sheet.
Step 4 – Refresh Power BI Dashboard
Refresh the Power BI dashboard to update all charts and performance metrics automatically.
Step 5 – Analyze Dashboard Insights
Use filters, charts, and KPI indicators to analyze project performance and trends.
Within seconds, managers gain a complete view of bridge construction performance.
👷 Who Can Benefit from This Bridge Construction KPI Dashboard in Power BI
This dashboard is designed for professionals managing infrastructure and construction projects.
🏗 Construction Companies – Monitor bridge construction project performance and operational efficiency.
👷 Project Managers – Track KPIs, monitor progress, and identify project risks early.
📊 Infrastructure Development Firms – Analyze performance across multiple construction projects.
🏢 Government Infrastructure Departments – Track public infrastructure development efficiently.
📈 Construction Analysts and Consultants – Evaluate project performance trends and improve planning.
📑 Engineering and Project Teams – Access clear visual reports for better project monitoring.
Click hare to read the Detailed blog post
Visit our YouTube channel to learn step-by-step video tutorials
https://www.youtube.com/@PKAnExcelExpert