Insurance companies operate in a competitive, highly regulated, and performance-driven environment. Every month, leadership teams must evaluate claims efficiency, underwriting profitability, policy growth, expense ratios, and service quality. However, many insurance businesses still rely on scattered spreadsheets, disconnected reports, and manual calculations.
The result? Delayed insights, unclear performance visibility, and missed improvement opportunities.
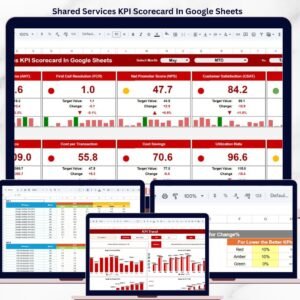
The Insurance KPI Scorecard in Google Sheets is designed to eliminate that problem.
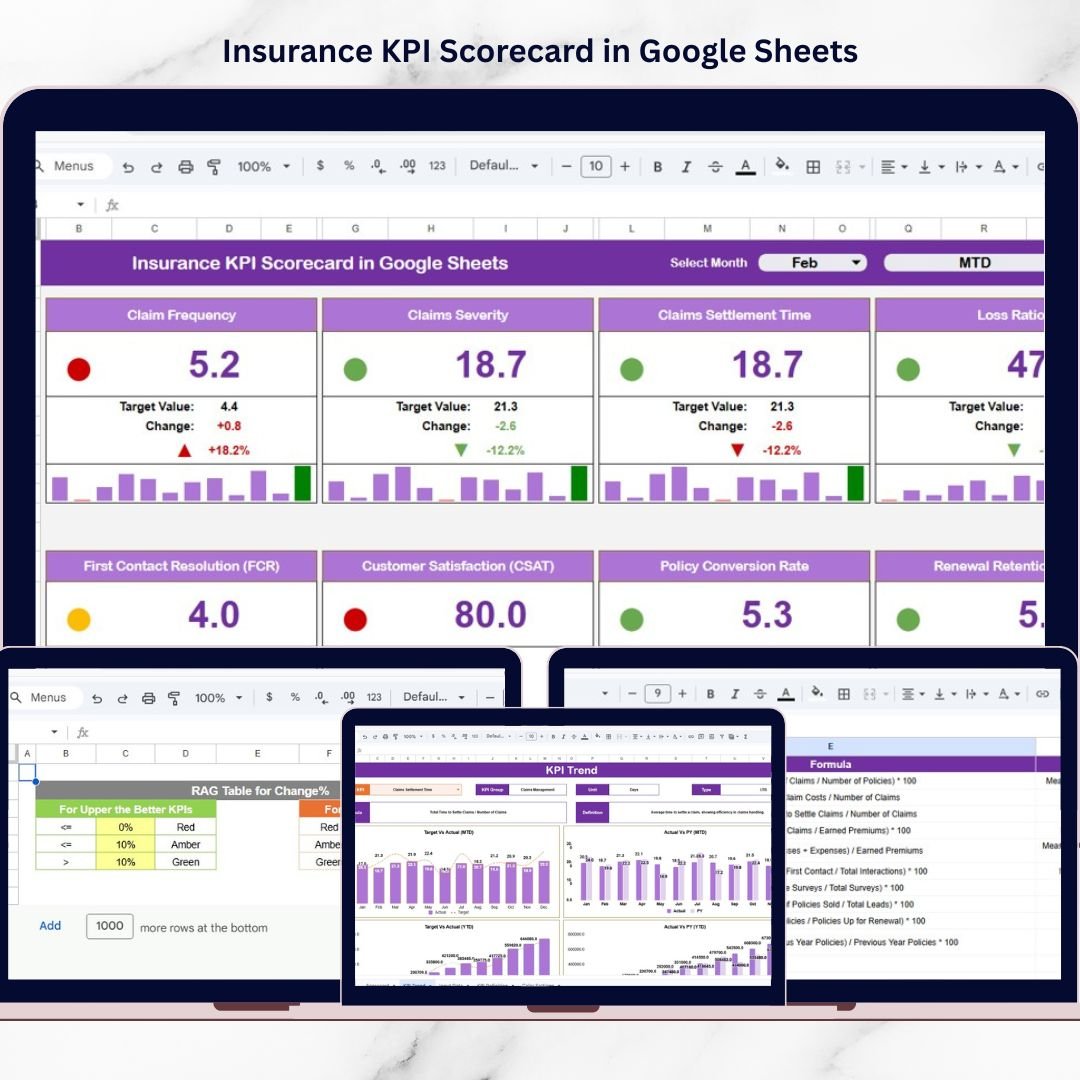
This ready-to-use, interactive performance management template transforms complex insurance data into a structured and visually powerful scorecard. Instead of reviewing multiple reports, managers can monitor 10 critical insurance KPIs in one centralized dashboard.
With dynamic month selection, automated MTD (Month-to-Date) and YTD (Year-to-Date) views, traffic light indicators, and percentage change arrows, this scorecard simplifies decision-making and improves accountability.
Because it is built in Google Sheets, your team collaborates in real time — without version conflicts, expensive BI tools, or complicated setup.
If you want clarity, control, and profitability in your insurance operations, this scorecard is built for you.
🚀 Key Feature of Insurance KPI Scorecard in Google Sheets
✅ Dynamic Month Dropdown – Select any month and instantly update performance results.
✅ MTD & YTD Toggle View – Switch between monthly and yearly analysis with one click.
✅ 10 Critical Insurance KPIs – Structured for financial, operational, and service monitoring.
✅ Traffic Light Indicators – Instantly identify overperformance or risk areas.
✅ Percentage Change Arrows – Visual comparison with previous period.
✅ Automated Target vs Actual Comparison – Immediate performance gap visibility.
✅ KPI Trend Analysis Sheet – Monitor KPI movement over time.
✅ Cloud-Based Collaboration – Real-time team access from anywhere.
✅ Customizable Colour Settings – Align scorecard with your branding.
This is more than a spreadsheet — it is your insurance performance control system.
📦 What’s Inside the Insurance KPI Scorecard in Google Sheets
This template includes multiple structured worksheets for a smooth workflow:
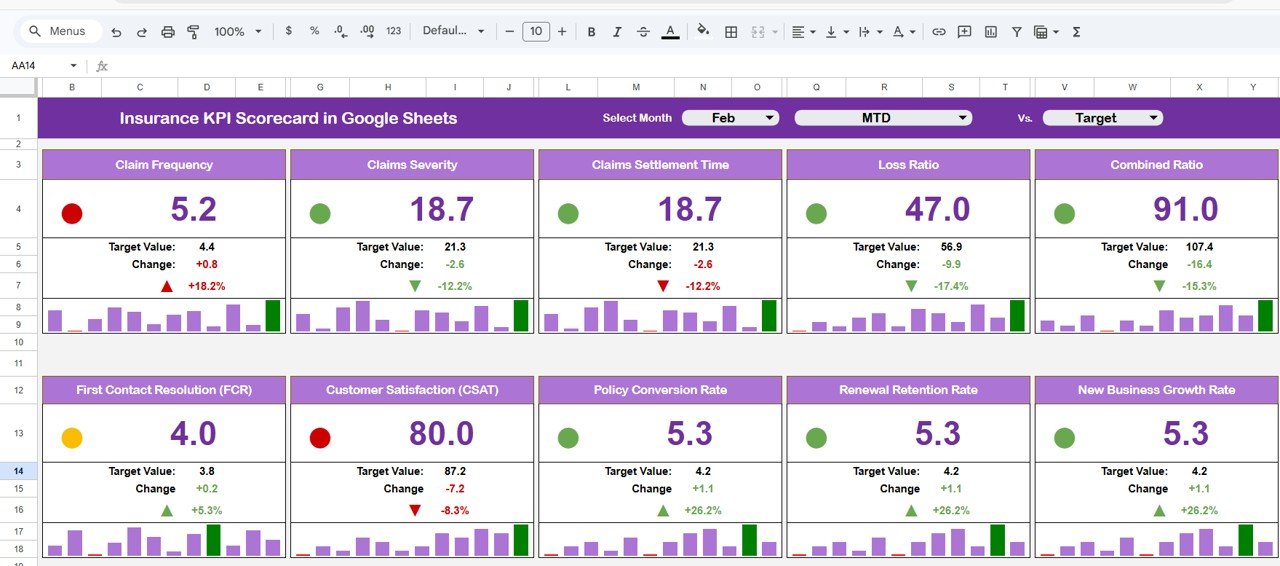
1️⃣ Main Scorecard Sheet (Central Dashboard)
-
Month dropdown at the top
-
MTD / YTD performance selection
-
10 KPI summary view
-
Actual vs Target comparison
-
Previous period comparison
-
Traffic lights & performance arrows
Everything appears on one screen for faster executive decisions.
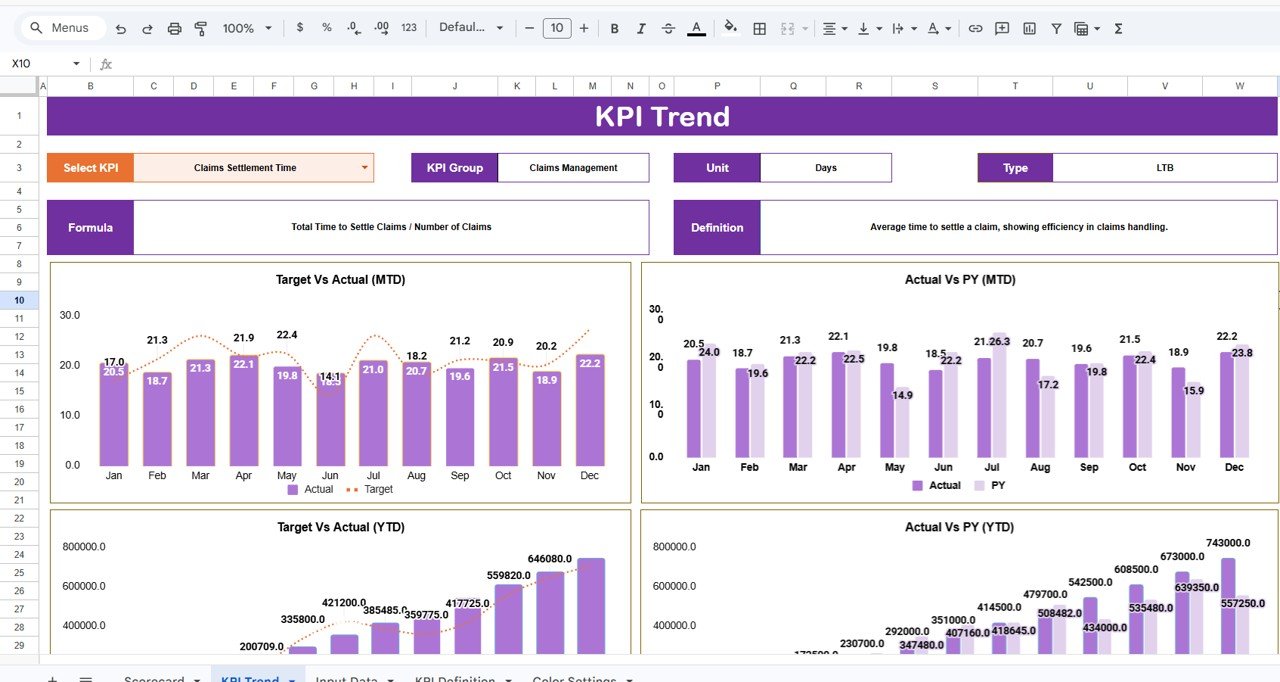
2️⃣ KPI Trend Sheet
-
KPI dropdown selector (Cell C3)
-
KPI Group, Unit, and Type (UTB / LTB)
-
Formula and KPI definition display
-
Monthly trend visualization
-
YTD performance tracking
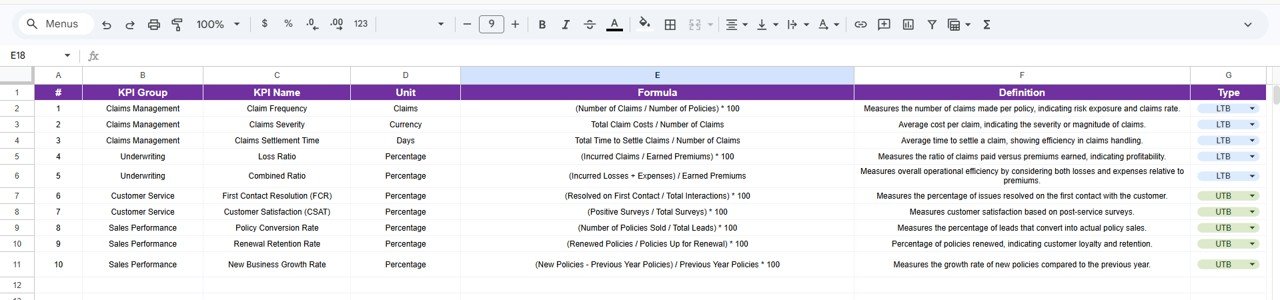
3️⃣ KPI Definition Sheet
-
KPI Name
-
KPI Group
-
Unit
-
Formula
-
KPI Definition
-
KPI Type (Upper the Better / Lower the Better)
Ensures clarity, standardization, and transparency.
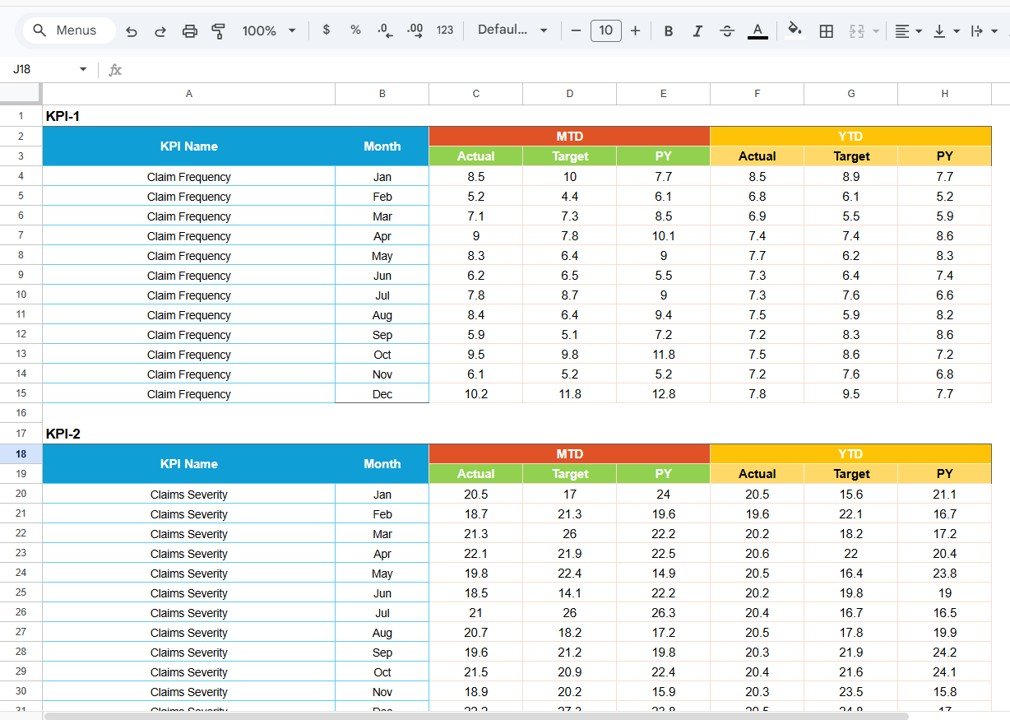
4️⃣ Data Input Sheet
-
Enter monthly actual values
-
Enter targets
-
Maintain previous period numbers
-
Automated dashboard updates
Simple workflow: Input → Calculate → Visualize → Analyze.
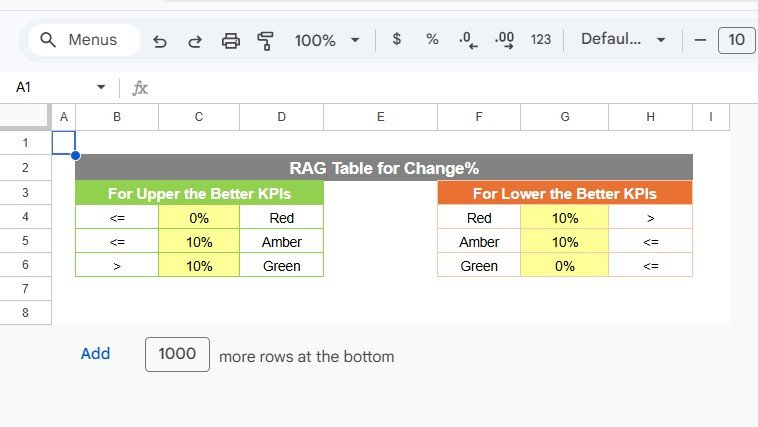
5️⃣ Colour Settings Sheet
-
Customize traffic light colors
-
Adjust arrow colors
-
Modify performance thresholds
Maintain professional presentation and brand alignment.
⚙️ How to Use the Insurance KPI Scorecard in Google Sheets
Using this scorecard is simple:
-
Enter monthly actual and target values in the Data Input Sheet.
-
Update previous period numbers for comparison.
-
Select the desired month from the dropdown.
-
Toggle between MTD and YTD view.
-
Review traffic lights and percentage indicators.
-
Use the Trend Sheet for deeper KPI movement analysis.
Within minutes, leadership gains complete performance visibility.
👥 Who Can Benefit from This Insurance KPI Scorecard in Google Sheets
This scorecard is ideal for:
-
Insurance companies
-
Insurance agencies
-
Underwriting teams
-
Claims departments
-
Sales managers
-
Finance teams
-
Compliance officers
-
Insurance consultants
Whether you run a small agency or a large insurance firm, this scorecard helps you track performance professionally.
By centralizing operational, financial, and service KPIs, this scorecard eliminates confusion and improves decision-making speed. Managers identify profitability risks early, monitor claim processing efficiency, and optimize underwriting control.
Instead of reactive management, you move toward proactive, data-driven growth.
If you want structured KPI monitoring with automated comparisons and visual performance indicators, this Insurance KPI Scorecard delivers exactly what your organization needs.