Hydropower projects are the backbone of clean energy—yet managing them is anything but simple. You’re juggling strict timelines, complex operations, safety requirements, environmental compliance, and tight financial control… all at the same time. And when KPI tracking is scattered across different spreadsheets and manual reports, performance issues stay hidden until they become expensive problems.
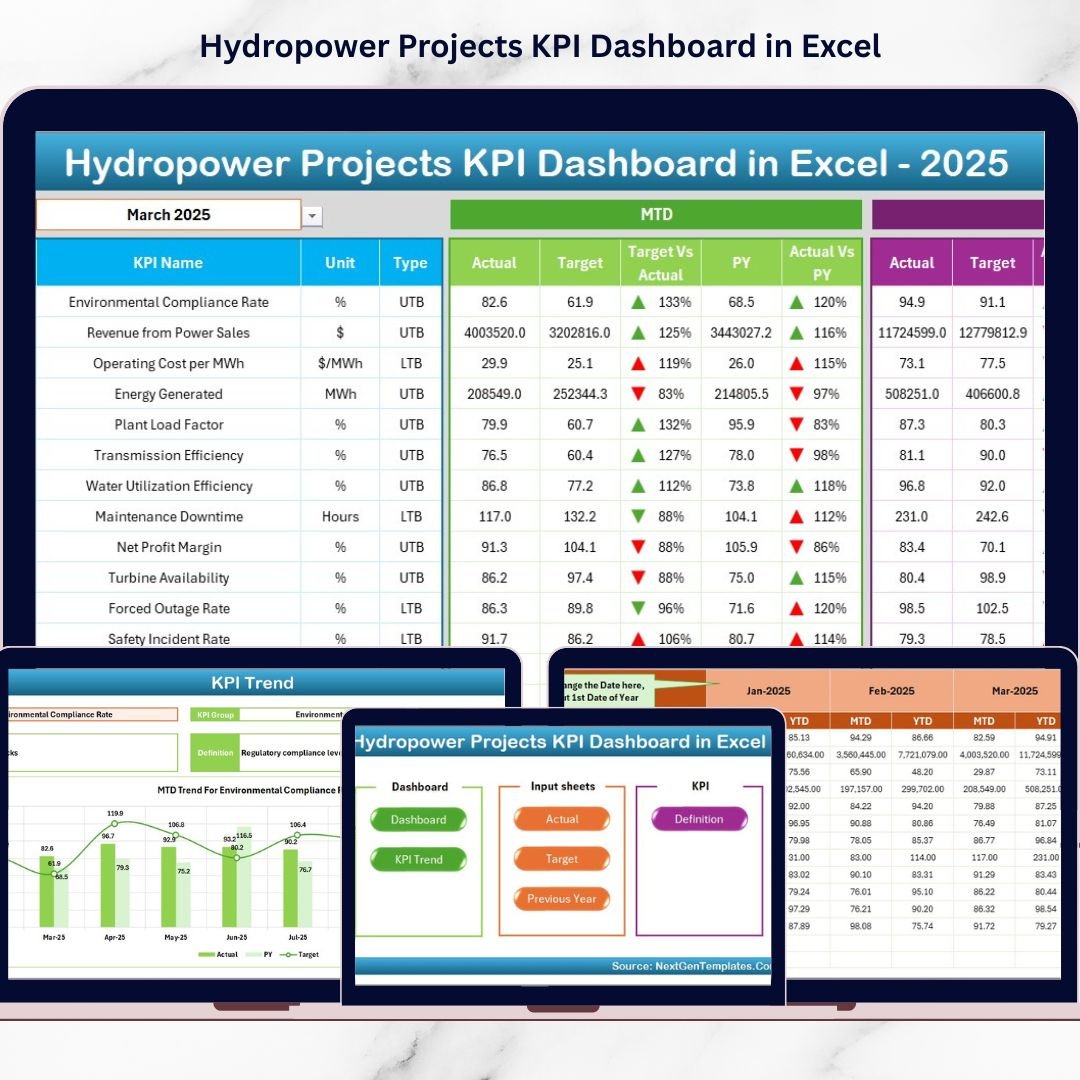
That’s why we built the Hydropower Projects KPI Dashboard in Excel 💧⚡📊
It’s a ready-to-use performance management system designed to centralize your hydropower KPIs in one interactive Excel dashboard—so you can track operational efficiency, project execution, costs, and compliance with clarity and speed.
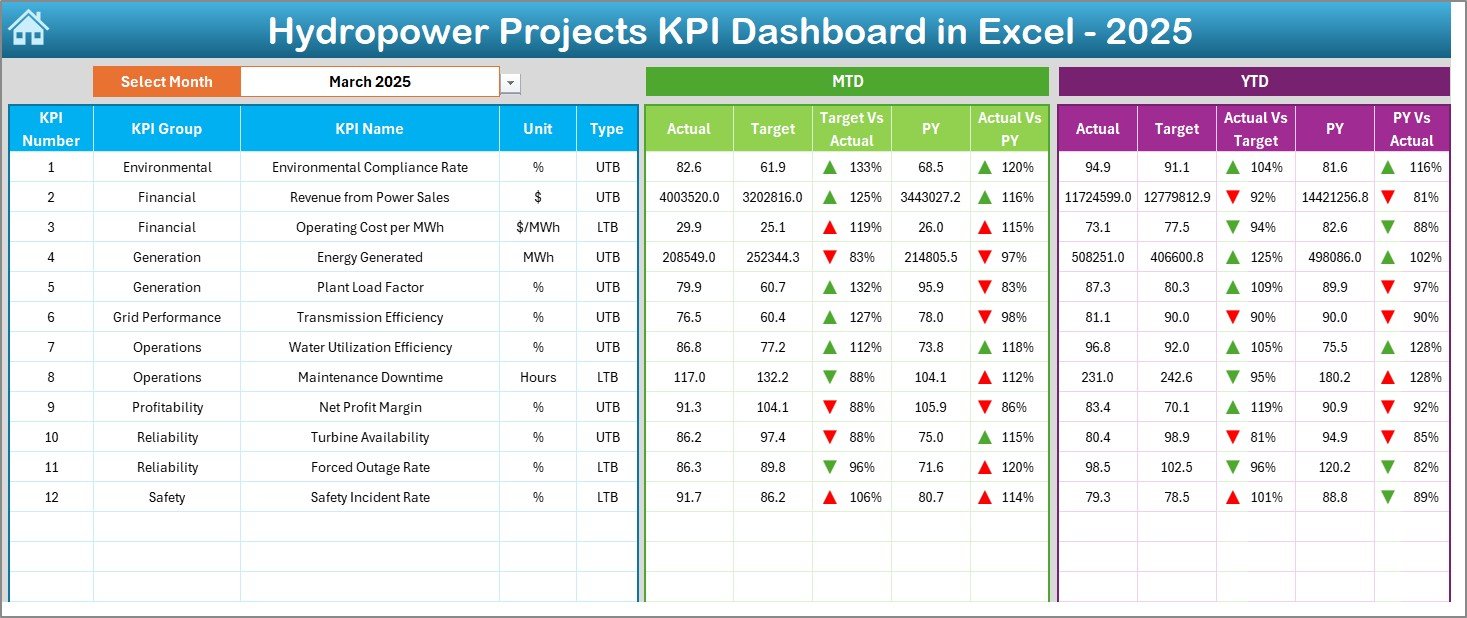
This dashboard makes performance monitoring easy by showing Actual vs Target and Actual vs Previous Year (PY) comparisons for both MTD (Month-to-Date) and YTD (Year-to-Date). Plus, it uses up/down indicators to instantly highlight where performance is improving—and where urgent action is needed.
If you want faster reporting, stronger control, and more confident project decisions, this template is built for you.
Key Feature of Hydropower Projects KPI Dashboard in Excel
🚀 Ready-to-use Excel KPI dashboard for hydropower operations and projects
📅 Month selector (Dashboard cell D3) to update the entire dashboard instantly
📊 MTD + YTD tracking for every KPI on a single screen
🎯 Actual vs Target comparison to monitor goal achievement clearly
🕒 Actual vs Previous Year (PY) comparison for year-over-year benchmarking
🟢🔴 Conditional formatting arrows for quick performance signals
📈 KPI Trend sheet with MTD & YTD trend charts (Actual/Target/PY)
🧾 Structured input sheets for Actual, Target, and Previous Year values
📚 KPI Definition sheet to standardize KPI meaning, unit, and formula across teams
🏠 Home sheet navigation with buttons for a smooth, professional workflow
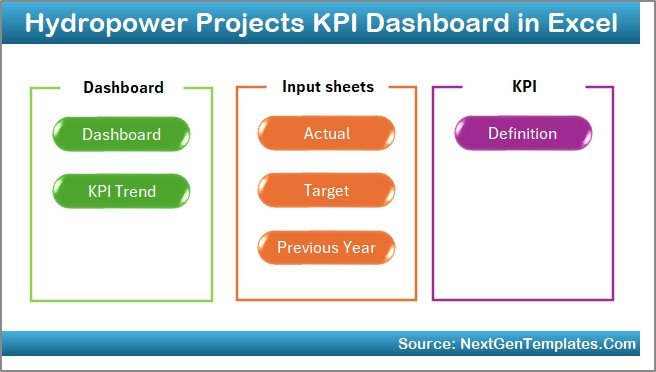
What’s Inside the Hydropower Projects KPI Dashboard in Excel
This template contains 7 structured worksheets, each built for a specific purpose:
🏠 1) Home Sheet (Navigation Hub)
An index-style sheet with six navigation buttons to jump instantly to the dashboard, trend analysis, inputs, and KPI definitions.
📌 2) Dashboard Sheet (Main Performance View)
Your central KPI command center showing:
-
MTD Actual, Target, PY
-
Target vs Actual (with arrows)
-
PY vs Actual (with arrows)
-
YTD Actual, Target, PY
-
YTD comparisons + visual indicators
Select the month from D3, and the entire dashboard updates automatically.
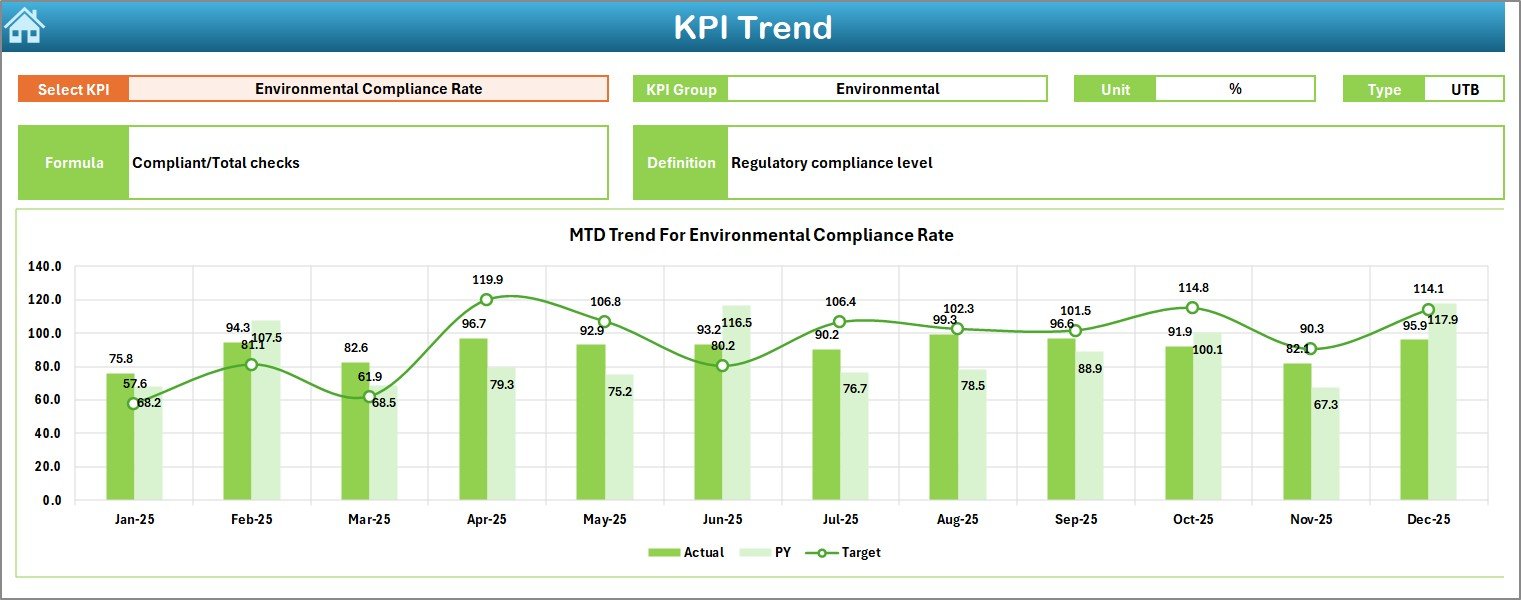
📉 3) KPI Trend Sheet (Deep-Dive Analysis)
Pick a KPI from dropdown C3 and instantly view:
-
KPI Group, Unit, Type (LTB/UTB), Formula, Definition
-
MTD trend chart (Actual/Target/PY)
-
YTD trend chart (Actual/Target/PY)
Perfect for identifying performance direction over time—not just one-month snapshots.
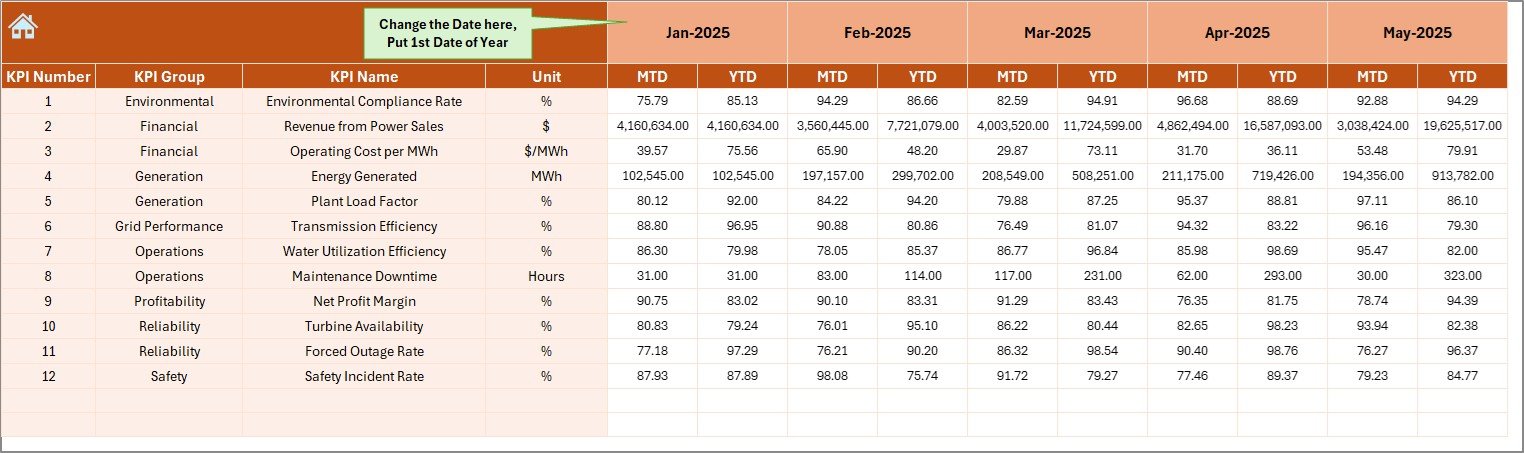
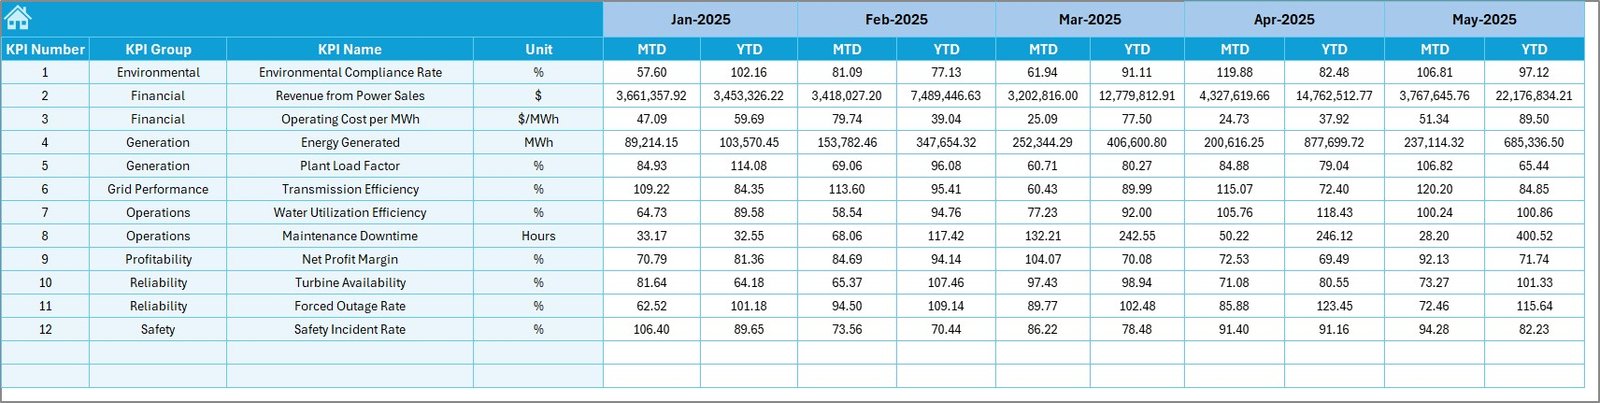
🧮 4) Actual Numbers Input Sheet
Enter monthly MTD and YTD actual values for each KPI. You can also set the first month of the year in E1, and the monthly structure adjusts accordingly.
🎯 5) Target Sheet
Store MTD and YTD targets for every KPI to measure planned vs achieved performance.
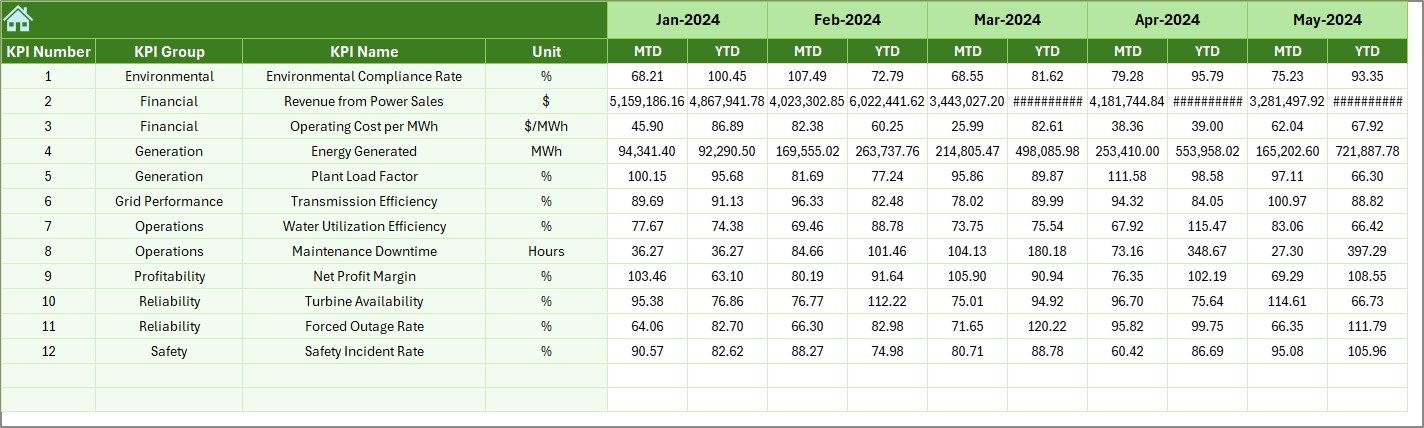
🕒 6) Previous Year Numbers Sheet
Input historical values to unlock YoY insights and compare improvements or declines.
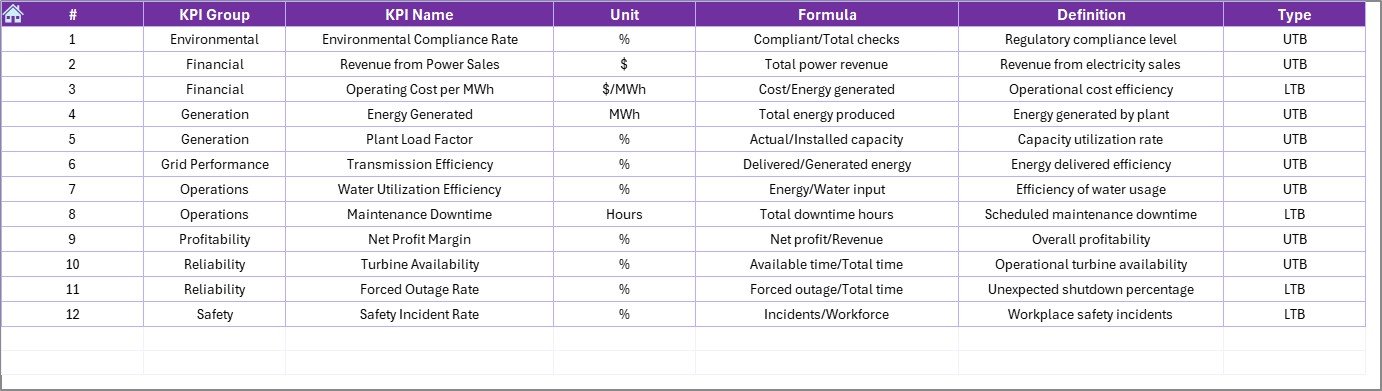
📚 7) KPI Definition Sheet
The “single source of truth” for KPI documentation:
-
KPI Name, Group, Unit, Formula, Definition, Type
This eliminates confusion and improves reporting consistency across departments.
How to Use the Hydropower Projects KPI Dashboard in Excel
Follow this monthly workflow to keep reporting smooth and consistent:
1️⃣ Define KPIs in the KPI Definition sheet
2️⃣ Enter Targets in the Target sheet
3️⃣ Add Previous Year values in the Previous Year sheet
4️⃣ Update Actual values in the Actual Numbers Input sheet
5️⃣ Select the Month (D3) on the Dashboard and review arrows + comparisons
6️⃣ Analyze Trends by choosing a KPI on the Trend sheet (C3)
This process keeps everyone aligned—and saves hours of manual reporting.
Who Can Benefit from This Hydropower Projects KPI Dashboard in Excel
This dashboard is ideal for:
💼 Hydropower Project Managers
⚙️ Plant Operators & Maintenance Teams
📊 MIS & Performance Reporting Teams
💰 Finance & Budget Control Teams
🌱 Environmental & Compliance Teams
🛡️ Safety & Risk Management Teams
🏢 Energy Companies and Renewable Energy Developers
🏛️ Government & Monitoring Agencies
Whether you’re managing construction progress, operational efficiency, or sustainability compliance, this template gives you one clear KPI view.
Click hare to read the Detailed blog post
Visit our YouTube channel to learn step-by-step video tutorials
Youtube.com/@PKAnExcelExpert


