Nanotechnology is rapidly transforming industries such as electronics, healthcare, aerospace, coatings, and energy storage. As nanomaterial production and research expand, organizations must continuously monitor performance to maintain quality standards, operational efficiency, safety compliance, and innovation outcomes. However, many research laboratories and manufacturing companies still rely on disconnected spreadsheets and manual reporting processes, making performance tracking slow and inconsistent.
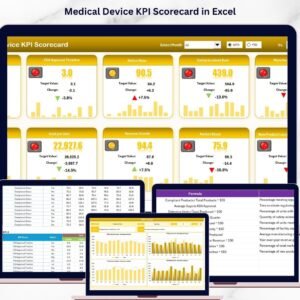
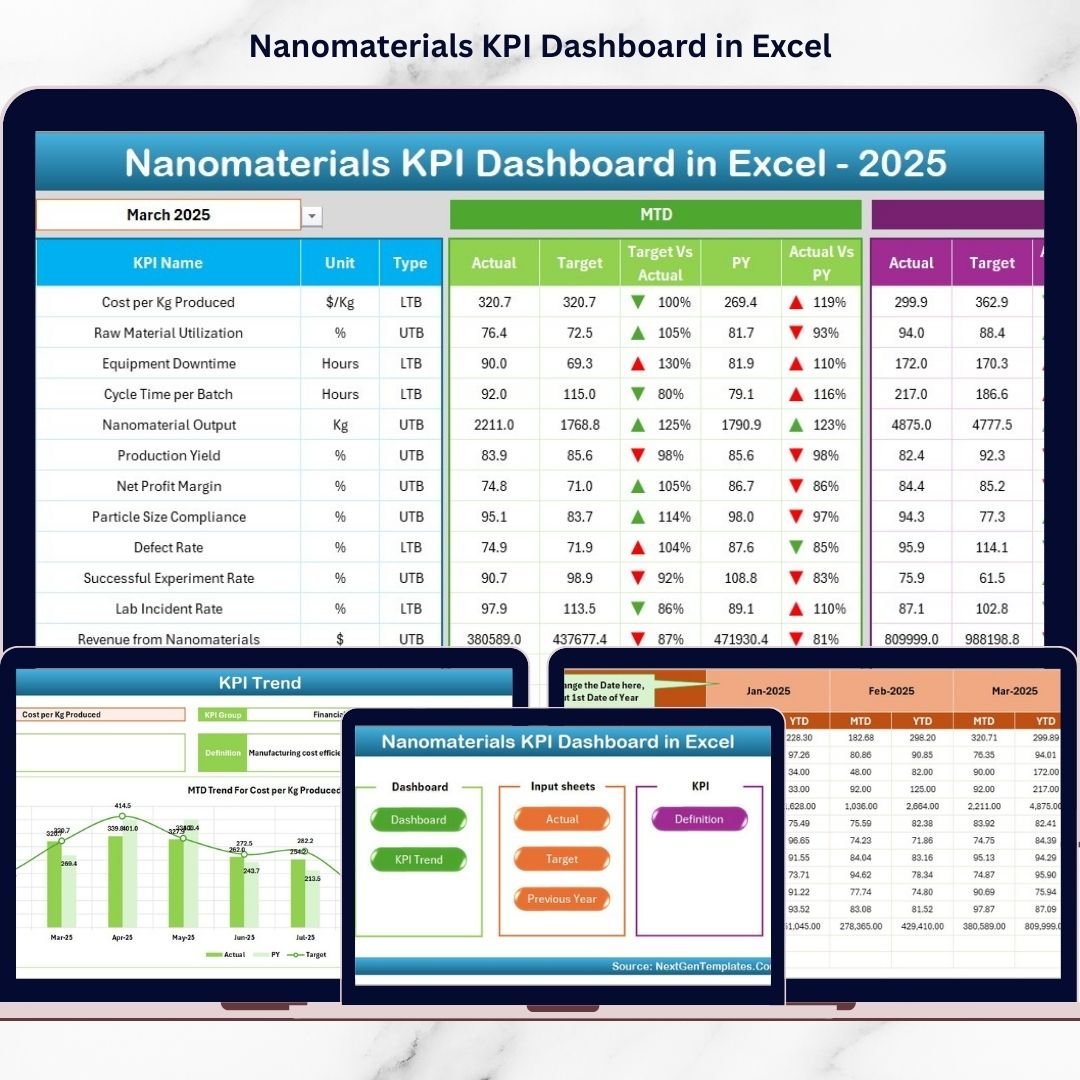
The Nanomaterials KPI Dashboard in Excel is a ready-to-use, professionally designed performance monitoring solution that converts complex operational and research data into clear visual insights. Instead of reviewing multiple reports, users can analyze all key performance indicators (KPIs) from one centralized dashboard powered entirely by Excel.
This dashboard combines automation, visualization, and structured KPI tracking to help organizations evaluate production efficiency, monitor quality metrics, analyze research performance, and compare historical trends. With dynamic dropdown selections, automated calculations, and conditional formatting indicators, decision-makers can instantly identify performance gaps and improvement opportunities.
Whether you manage nanomaterial manufacturing, advanced materials research, or quality assurance operations, this dashboard enables data-driven decision-making without requiring expensive analytics software.
🚀 Key Feature of Nanomaterials KPI Dashboard in Excel
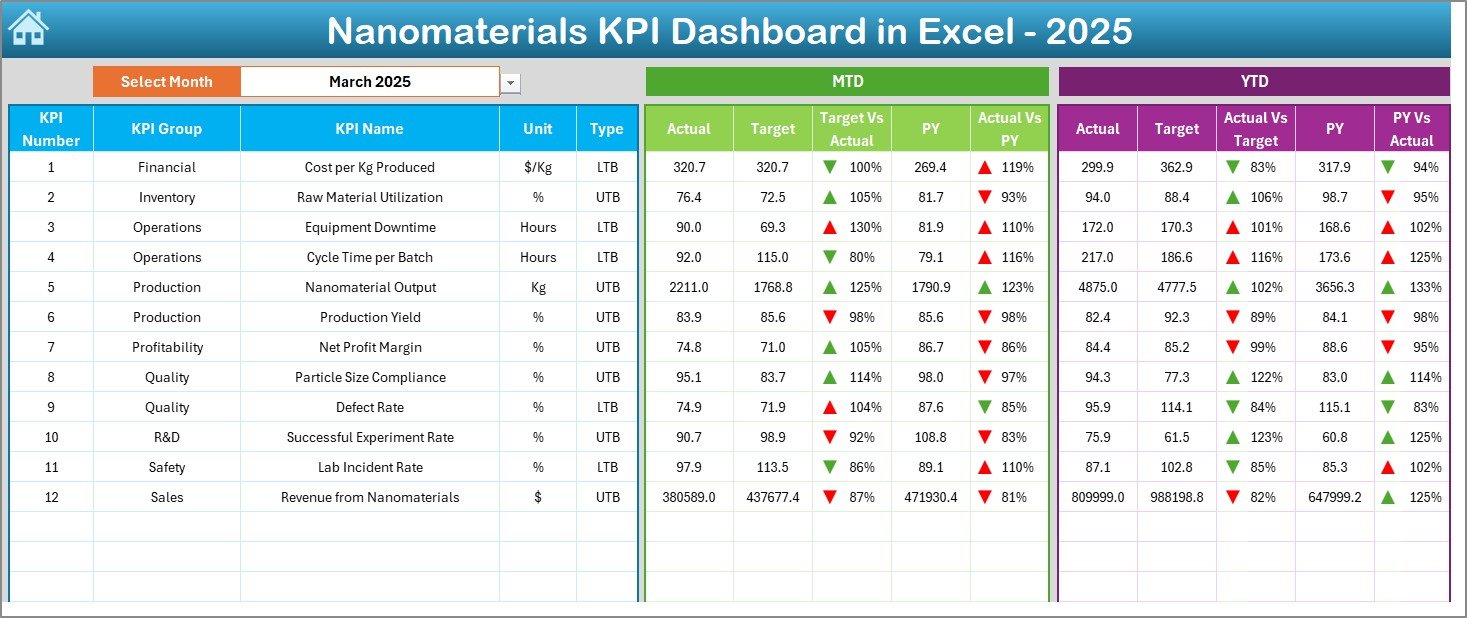
📊 Centralized KPI Monitoring
Track production, quality, research, safety, and financial KPIs in one unified dashboard.
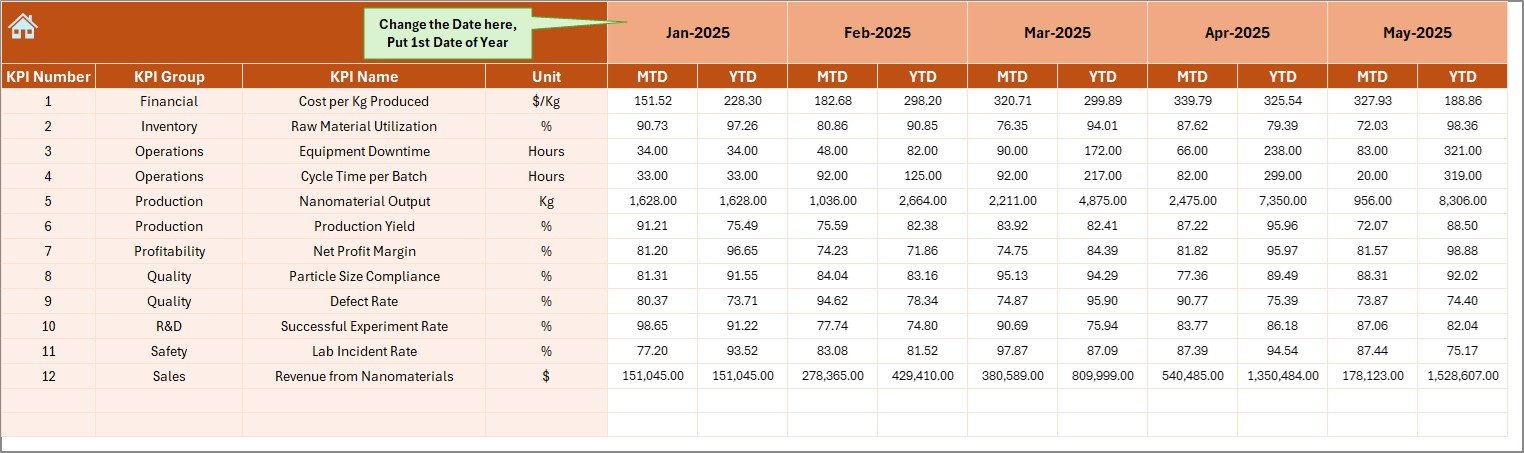
📅 Dynamic Month Selection
Choose reporting periods using dropdown filters and instantly update dashboard insights.
📈 MTD & YTD Performance Analysis
Monitor short-term and long-term performance simultaneously.
🔁 Actual vs Target Comparison
Quickly identify performance gaps using automated calculations.
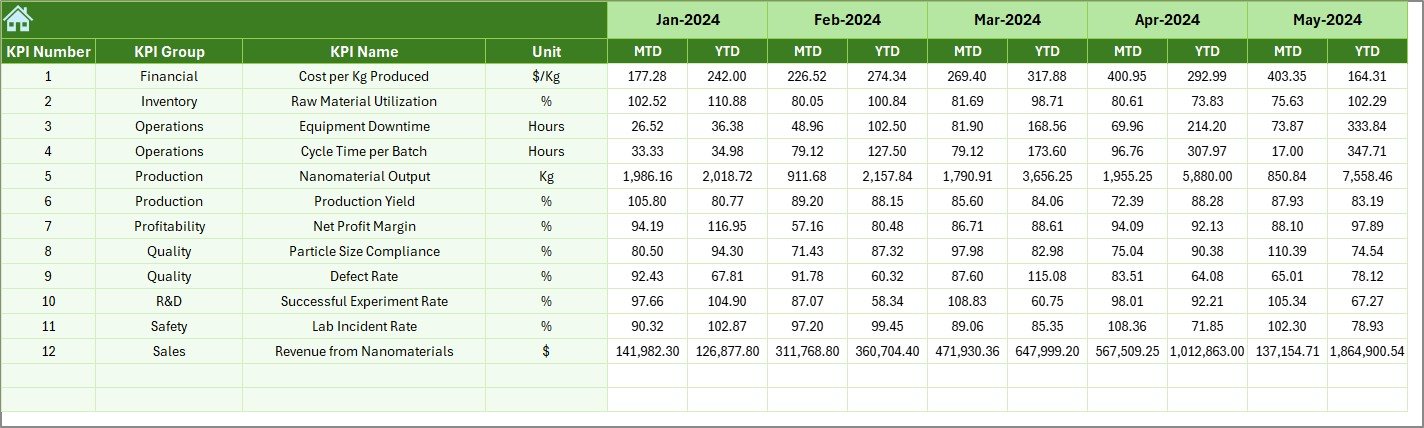
📉 Previous Year Benchmarking
Compare current performance with historical data for better trend evaluation.
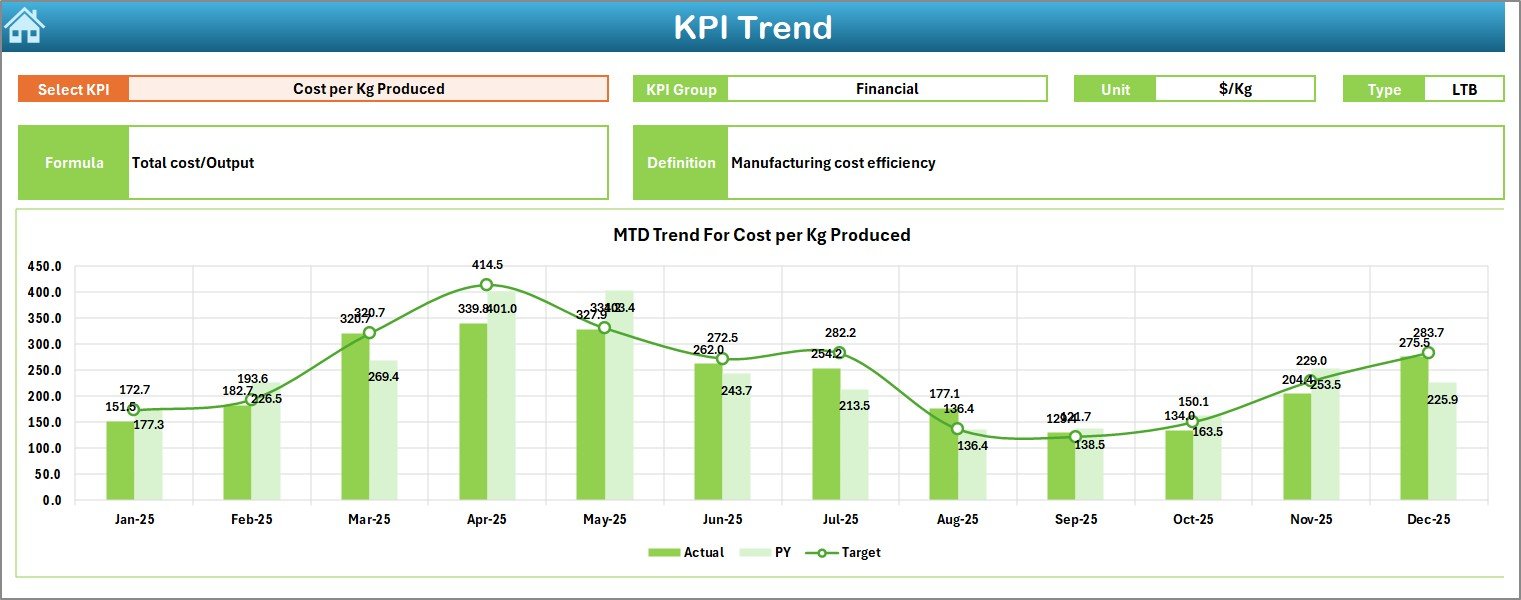
📊 KPI Trend Visualization
Analyze performance patterns through MTD and YTD trend charts.
🚦 Conditional Formatting Indicators
Up/down arrows and visual signals highlight KPI performance instantly.
⚡ Fully Automated Excel Calculations
Enter data once and let the dashboard update automatically.
📦 What’s Inside the Nanomaterials KPI Dashboard in Excel
This ready-to-use template includes a complete KPI management framework:
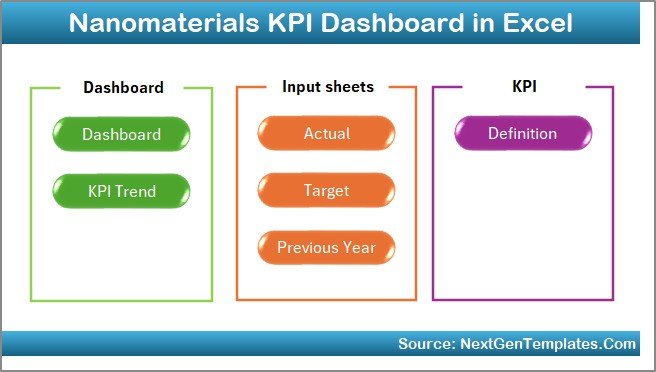
✅ 7 Structured Worksheets
-
Home Sheet (Navigation Center)
-
Dashboard Sheet (Main KPI Overview)
-
KPI Trend Sheet
-
Actual Numbers Input Sheet
-
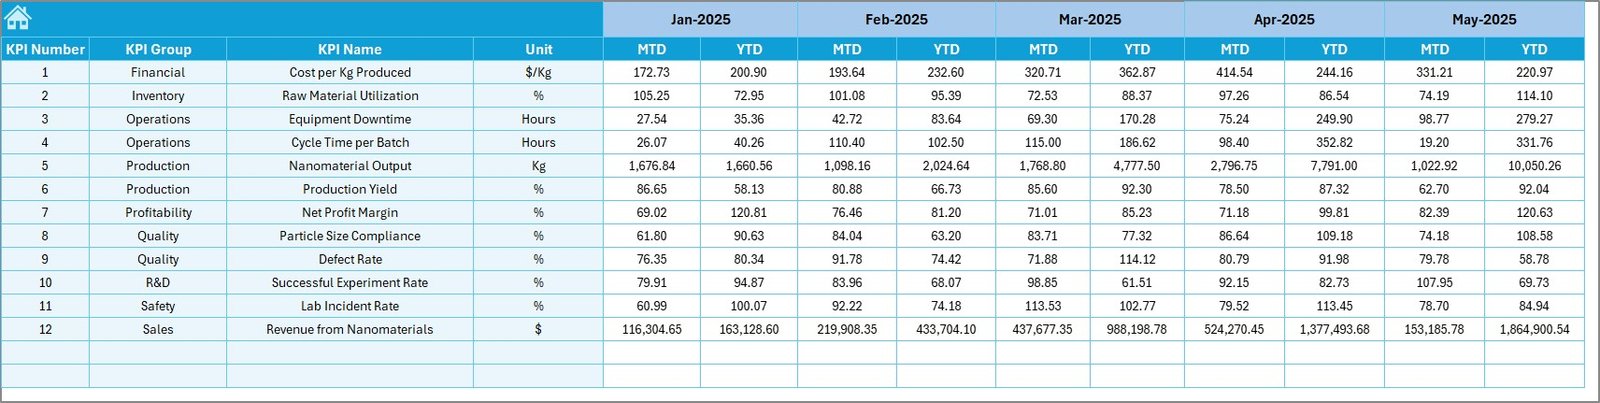
Target Sheet
-
Previous Year Numbers Sheet
-
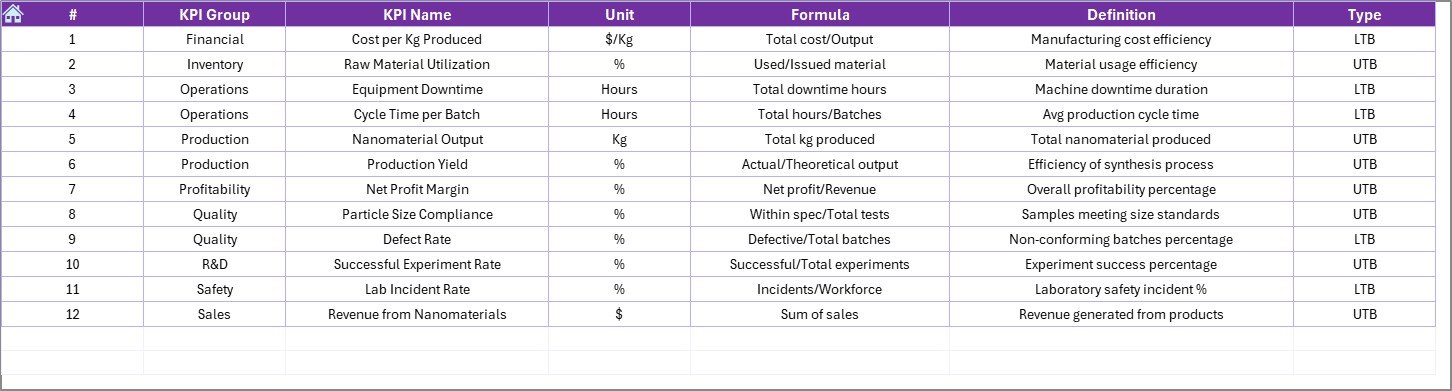
KPI Definition Sheet
✅ Automated KPI Calculations
✅ MTD & YTD Performance Metrics
✅ Interactive Trend Charts
✅ Target vs Actual Indicators
✅ Professional Nanotechnology KPI Layout
Simply input your data and begin monitoring performance immediately.
🛠️ How to Use the Nanomaterials KPI Dashboard in Excel
The dashboard is designed for simplicity and quick implementation:
1️⃣ Define KPIs in the KPI Definition Sheet.
2️⃣ Enter targets in the Target Sheet.
3️⃣ Add historical data for benchmarking.
4️⃣ Input monthly performance numbers.
5️⃣ Select the reporting month from the dashboard dropdown.
6️⃣ Review KPI comparisons and trend charts instantly.
No advanced Excel skills are required — automation handles calculations and visualization.
👥 Who Can Benefit from This Nanomaterials KPI Dashboard in Excel
This dashboard is ideal for professionals working in advanced materials and research environments:
🔬 Nanotechnology Manufacturing Companies
🏭 Advanced Materials Production Teams
🧪 Research Laboratories & R&D Departments
⚙ Semiconductor & Electronics Manufacturers
🔋 Energy Storage Organizations
✅ Quality Assurance Teams
📊 Operations & Performance Managers
Because the dashboard is customizable, organizations can adapt KPIs to their specific processes easily.
By implementing this dashboard, organizations centralize reporting, improve collaboration between research and production teams, and gain faster operational insights. Instead of spending time compiling reports, teams focus on innovation, efficiency, and performance improvement.
### Click here to read the Detailed blog post
Visit our YouTube channel to learn step-by-step video tutorials:
👉 https://youtube.com/@PKAnExcelExpert