Skill development initiatives play a vital role in improving employability, strengthening industries, and driving economic growth. Governments, NGOs, training institutions, and workforce development organizations continuously run training missions to prepare individuals for real-world careers. However, managing multiple programs, tracking candidates, monitoring placements, and evaluating training effectiveness becomes challenging when data is spread across multiple spreadsheets.
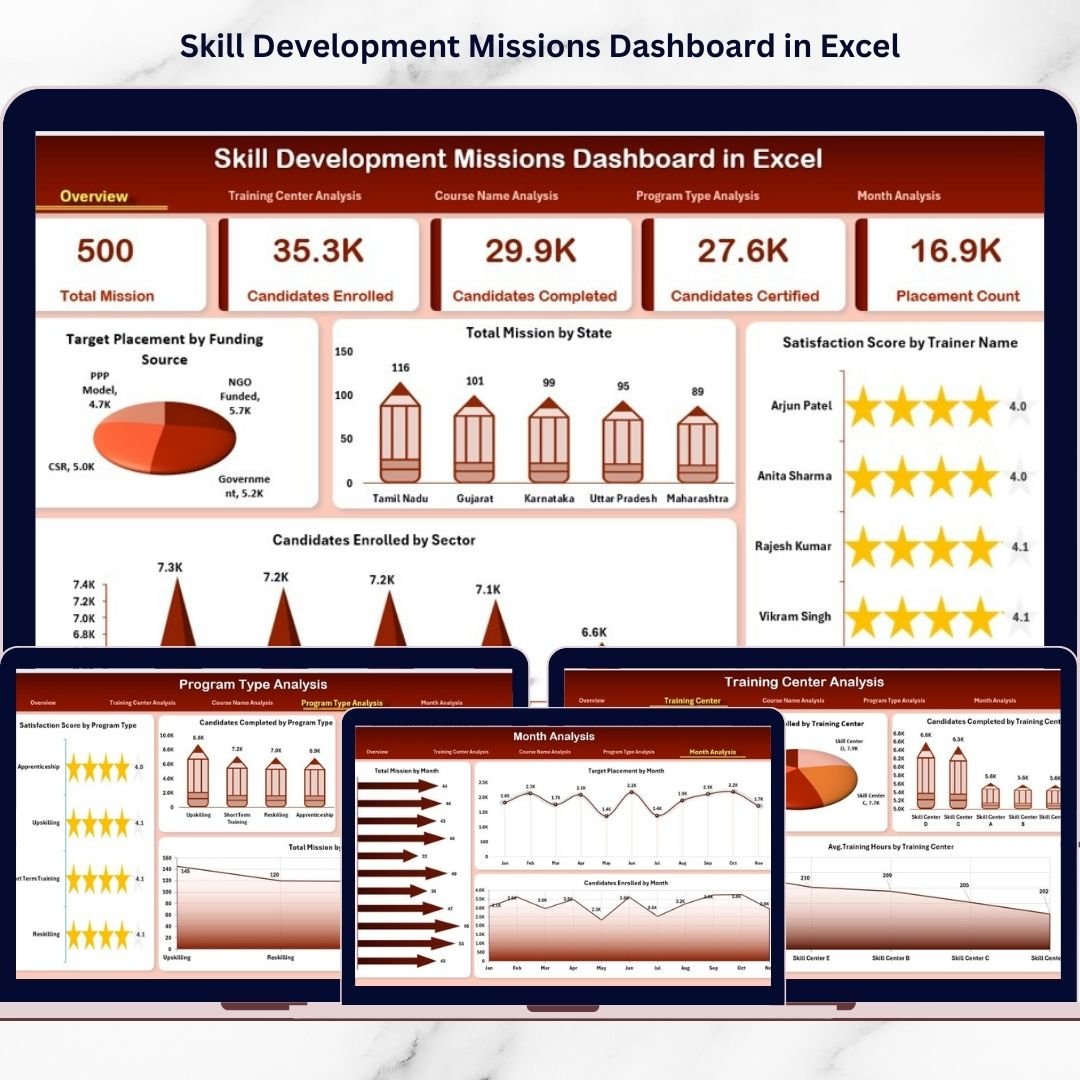
The Skill Development Missions Dashboard in Excel is a ready-to-use, professionally designed analytics solution that transforms complex training data into clear and actionable insights. Instead of manually compiling reports, administrators can monitor mission performance through interactive charts, KPIs, and automated analysis — all within one centralized Excel dashboard.
Built using powerful Excel features like Pivot Tables, slicers, and dynamic charts, this dashboard enables organizations to track enrollment trends, placement achievements, training center performance, course effectiveness, and monthly progress effortlessly. As a result, decision-makers gain real-time visibility into program outcomes and can make faster, data-driven improvements.
Whether you manage government skill missions, NGO training initiatives, or institutional workforce programs, this dashboard helps you move from manual reporting to intelligent performance monitoring.
🚀 Key Feature of Skill Development Missions Dashboard in Excel
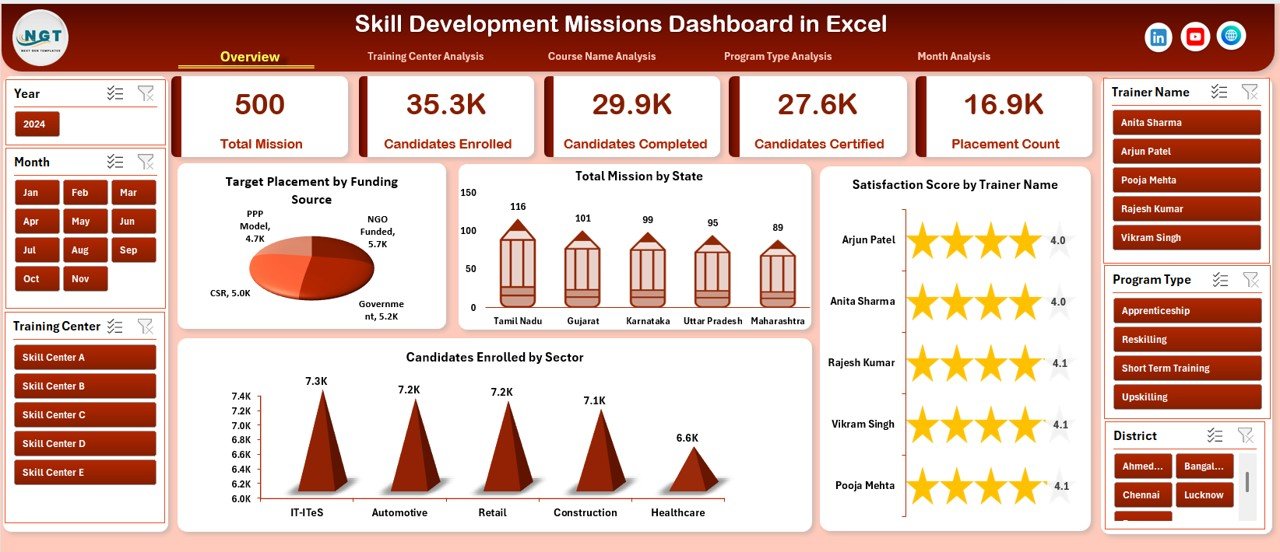
📊 Centralized Mission Monitoring
Track candidates, training centers, placements, and satisfaction metrics from one unified dashboard.
🎯 Interactive KPI Visualization
Understand program performance instantly using dynamic charts and visual indicators.
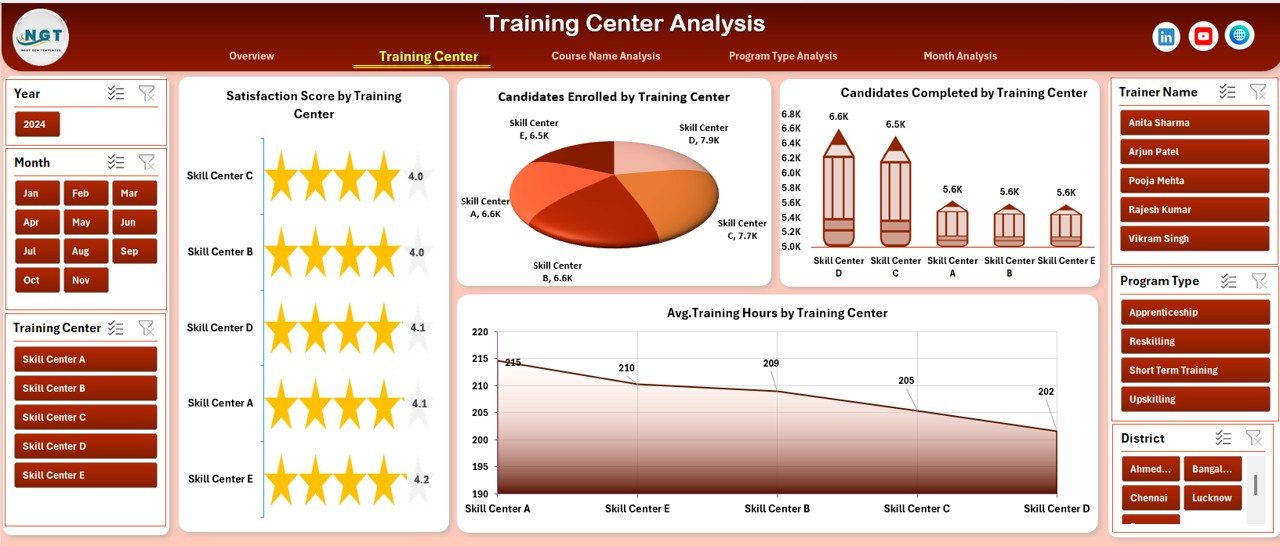
🏫 Training Center Performance Analysis
Compare enrollment, completion rates, and training hours across multiple centers.
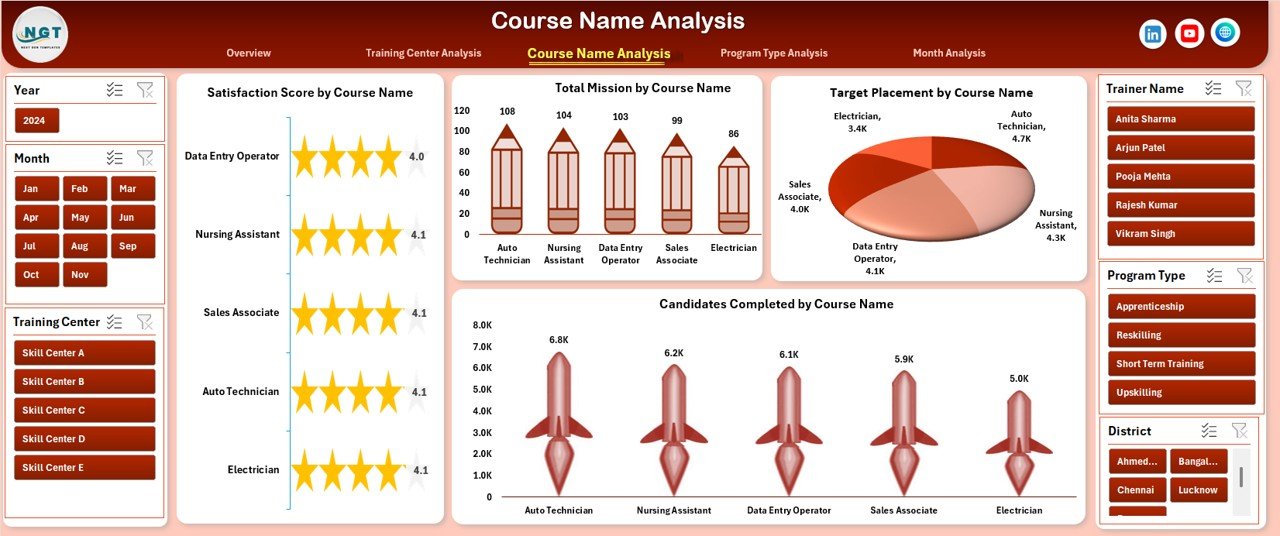
📚 Course-Level Performance Insights
Evaluate course effectiveness based on completion, placements, and satisfaction scores.
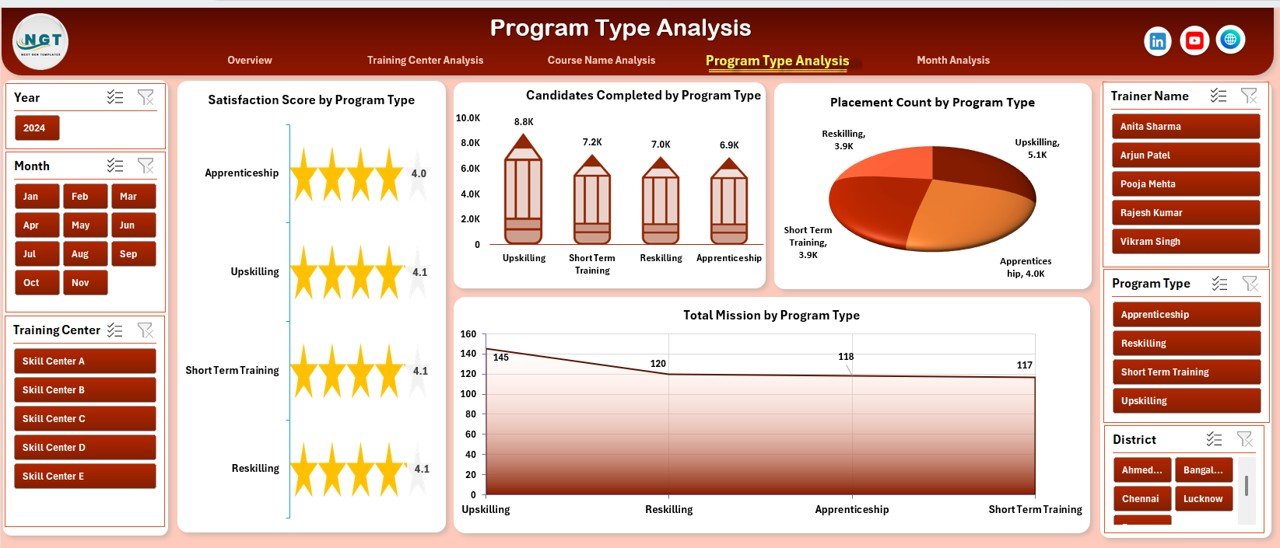
📈 Program Type Comparison
Identify which training programs deliver the best outcomes and placement success.
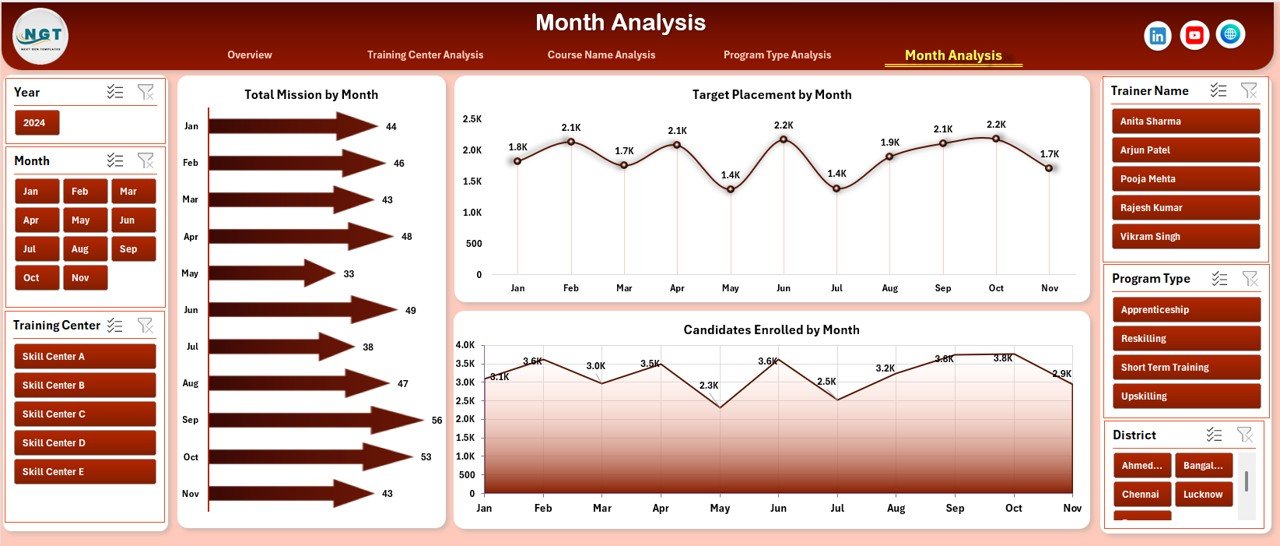
📅 Monthly Progress Tracking
Analyze enrollment and placement trends over time for better planning.
🔎 Dynamic Slicers & Filters
Filter results instantly by trainer, program type, course, or region.
⚡ Automatic Dashboard Updates
Refresh Pivot Tables to update analytics automatically after data entry.
📦 What’s Inside the Skill Development Missions Dashboard in Excel
This ready-to-use dashboard includes a complete analytical ecosystem designed for skill mission management:
✅ Five Interactive Dashboard Pages
-
Overview Dashboard
-
Training Center Analysis
-
Course Name Analysis
-
Program Type Analysis
-
Month Analysis
✅ Structured Backend Sheets
-
Data Sheet for mission records
-
Support Sheet for dropdown lists and validations
✅ Prebuilt Pivot Tables & Charts
✅ Interactive Slicers for Easy Navigation
✅ Automated KPI Calculations
✅ Professional Training Analytics Layout
Simply input your mission data and start generating insights immediately.
🛠️ How to Use the Skill Development Missions Dashboard in Excel
The dashboard is designed for simplicity so teams can start quickly:
1️⃣ Enter training and candidate data into the Data Sheet.
2️⃣ Maintain consistent entries using dropdown selections.
3️⃣ Refresh Pivot Tables after updating records.
4️⃣ Use slicers to filter programs, trainers, or courses.
5️⃣ Navigate analytical pages using the Page Navigator.
6️⃣ Review visual insights and generate reports instantly.
No advanced Excel expertise is required — the dashboard handles calculations automatically.
👥 Who Can Benefit from This Skill Development Missions Dashboard in Excel
This dashboard is ideal for organizations managing training and employment initiatives:
🏛️ Government Skill Development Departments
🎓 Training Institutes & Academies
🌍 NGOs & Development Organizations
💼 Workforce Development Programs
🏢 CSR Training Initiatives
📊 Mission Coordinators & Program Managers
👨💼 Policy Makers & Leadership Teams
From small training projects to nationwide skill missions, this dashboard provides complete performance visibility.
By implementing this dashboard, organizations centralize data, improve accountability, reduce reporting time, and strengthen decision-making. Instead of spending hours preparing reports, teams focus on improving placements, enhancing training quality, and achieving mission goals.
### Click here to read the Detailed blog post
Visit our YouTube channel to learn step-by-step video tutorials:
👉 https://youtube.com/@PKAnExcelExpert


