Alternative medicine clinics are growing rapidly as more people choose holistic healing methods such as Ayurveda, acupuncture, naturopathy, chiropractic care, and wellness therapies. However, managing appointments, practitioners, treatments, patient satisfaction, and revenue using scattered spreadsheets often creates confusion and delays decision-making.
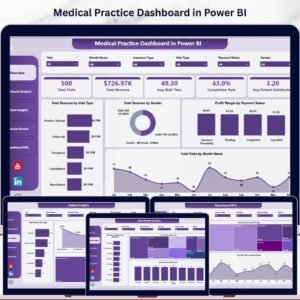
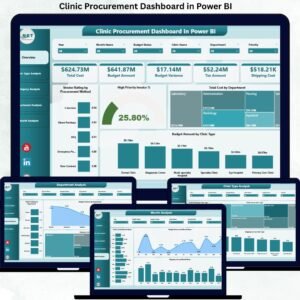
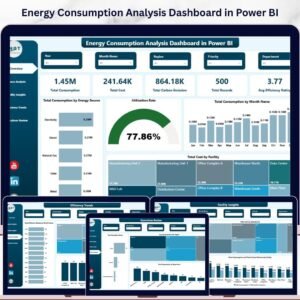
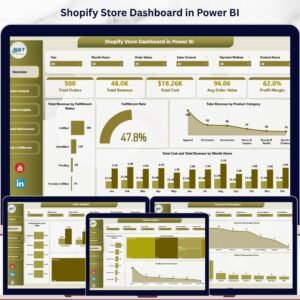
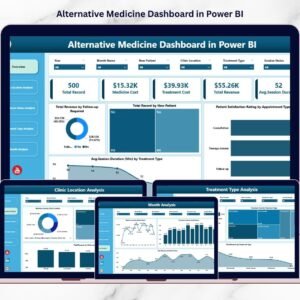
The Alternative Medicine Dashboard in Power BI provides a powerful, ready-to-use analytics solution that converts clinic data into clear visual insights. Instead of reviewing manual reports, clinic owners and managers can monitor performance, analyze trends, and improve patient outcomes through one centralized interactive dashboard.
This dashboard helps you understand what is working, what needs improvement, and where growth opportunities exist — allowing you to manage your clinic using data instead of guesswork.
🔑 Key Feature of Alternative Medicine Dashboard in Power BI
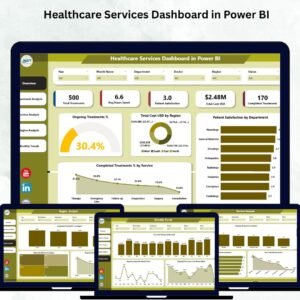
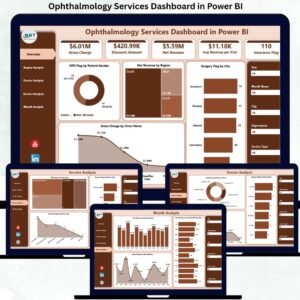
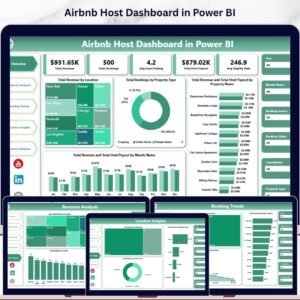
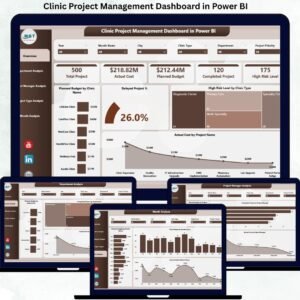
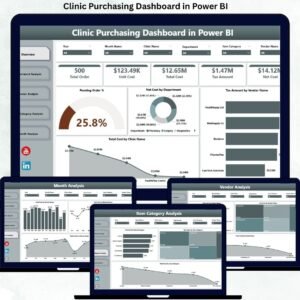
📊 Centralized Clinic Performance Monitoring
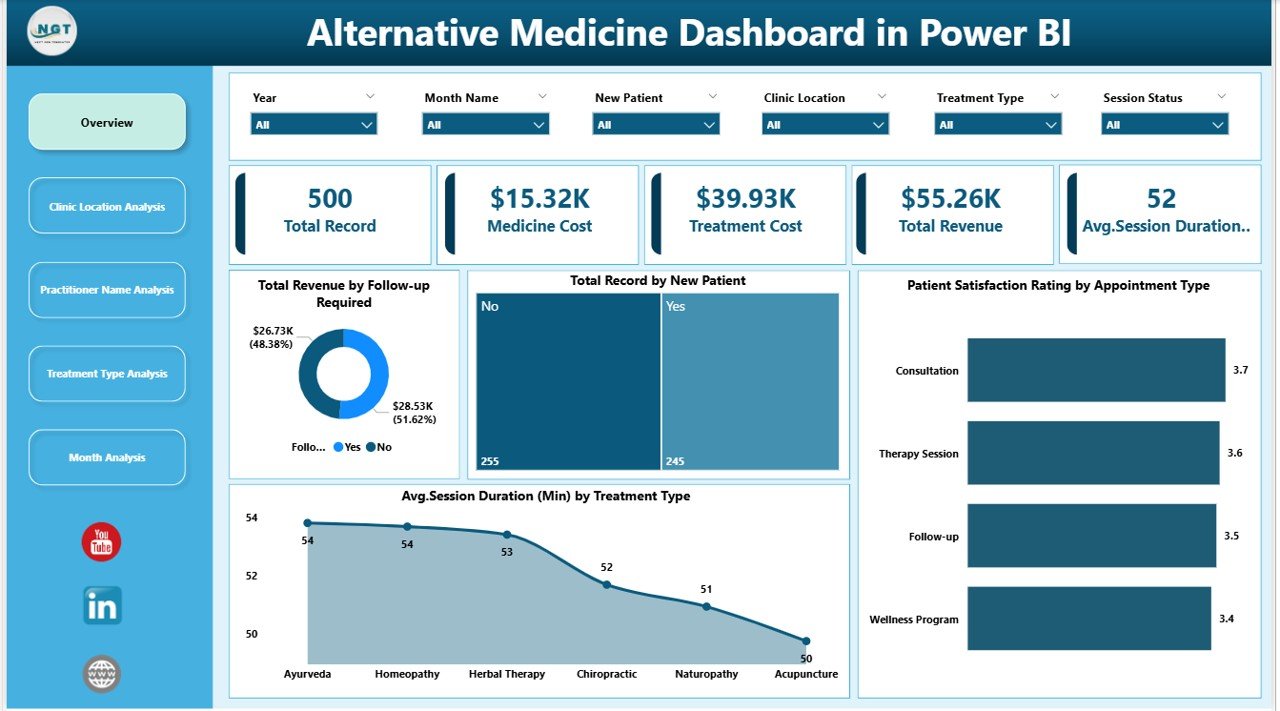
Track revenue, appointments, satisfaction, and treatment performance in one dashboard.
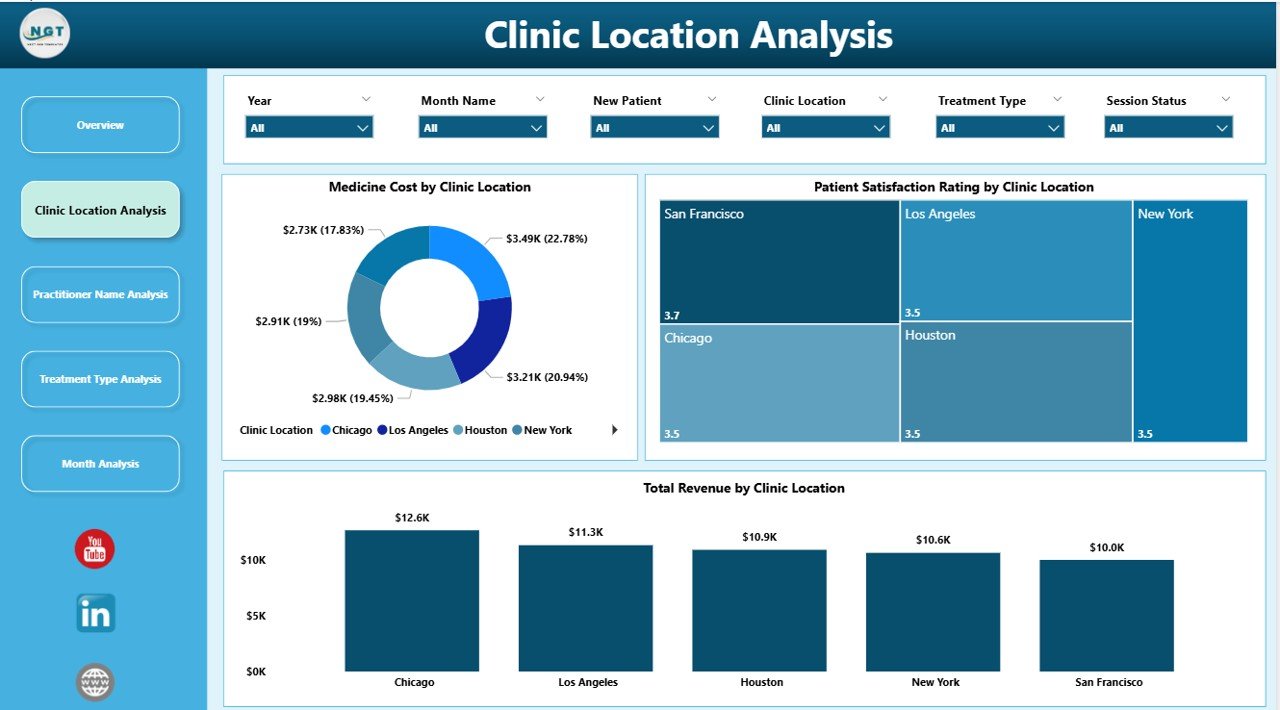
🏥 Multi-Location Clinic Analysis
Compare performance across branches instantly.
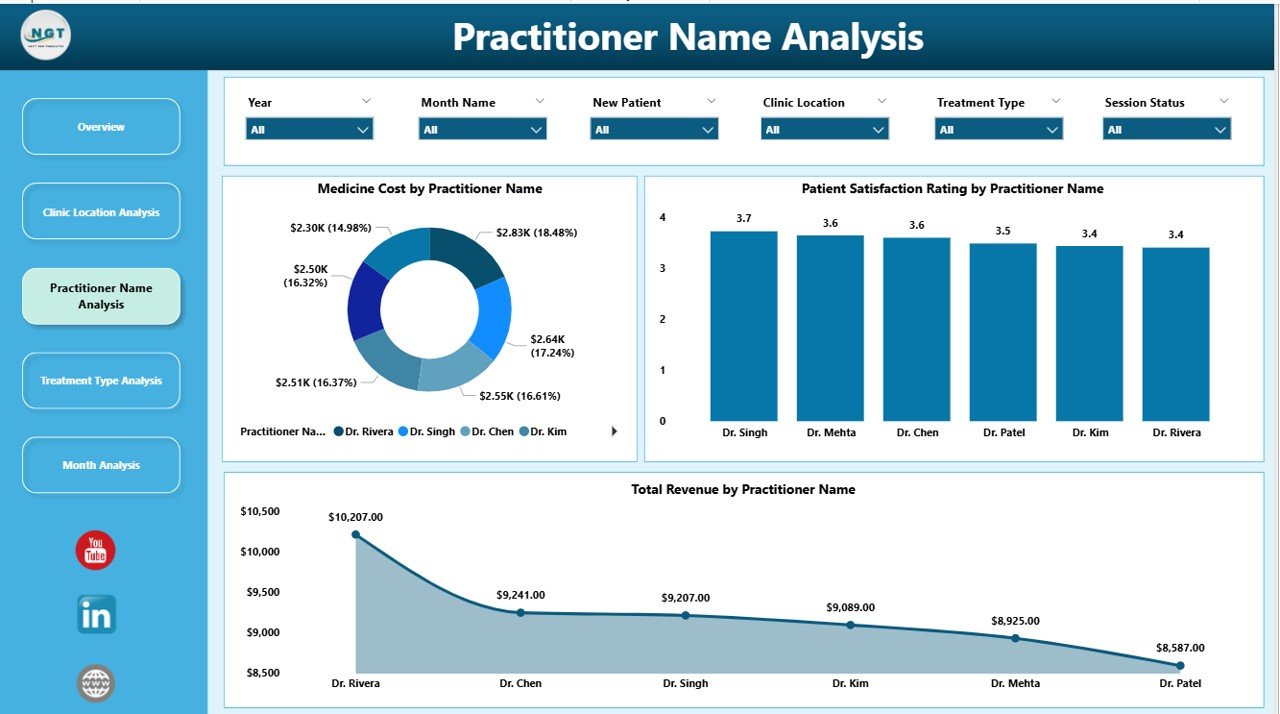
👩⚕️ Practitioner Performance Insights
Evaluate practitioner productivity and patient satisfaction visually.
💊 Treatment Performance Analytics
Identify profitable therapies and high-cost treatments.
⭐ Patient Satisfaction Tracking
Monitor experience levels and improve service quality.
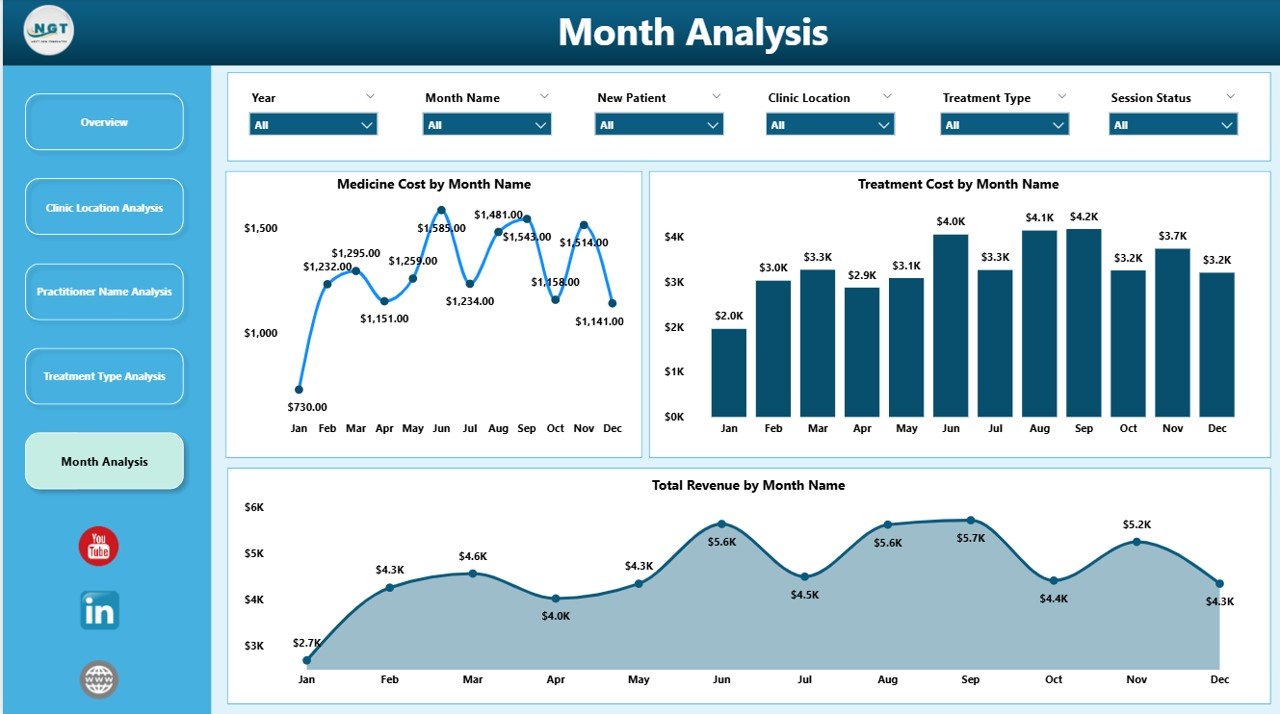
📅 Monthly Trend Analysis
Understand seasonal demand and forecast operations.
🎯 Interactive Slicers & Filters
Analyze data by practitioner, treatment, month, and appointment type instantly.
⚡ Automated Data Visualization
Refresh once and update the entire dashboard automatically.
📈 Data-Driven Decision Making
Improve retention, optimize services, and increase profitability.
📦 What’s Inside the Alternative Medicine Dashboard in Power BI
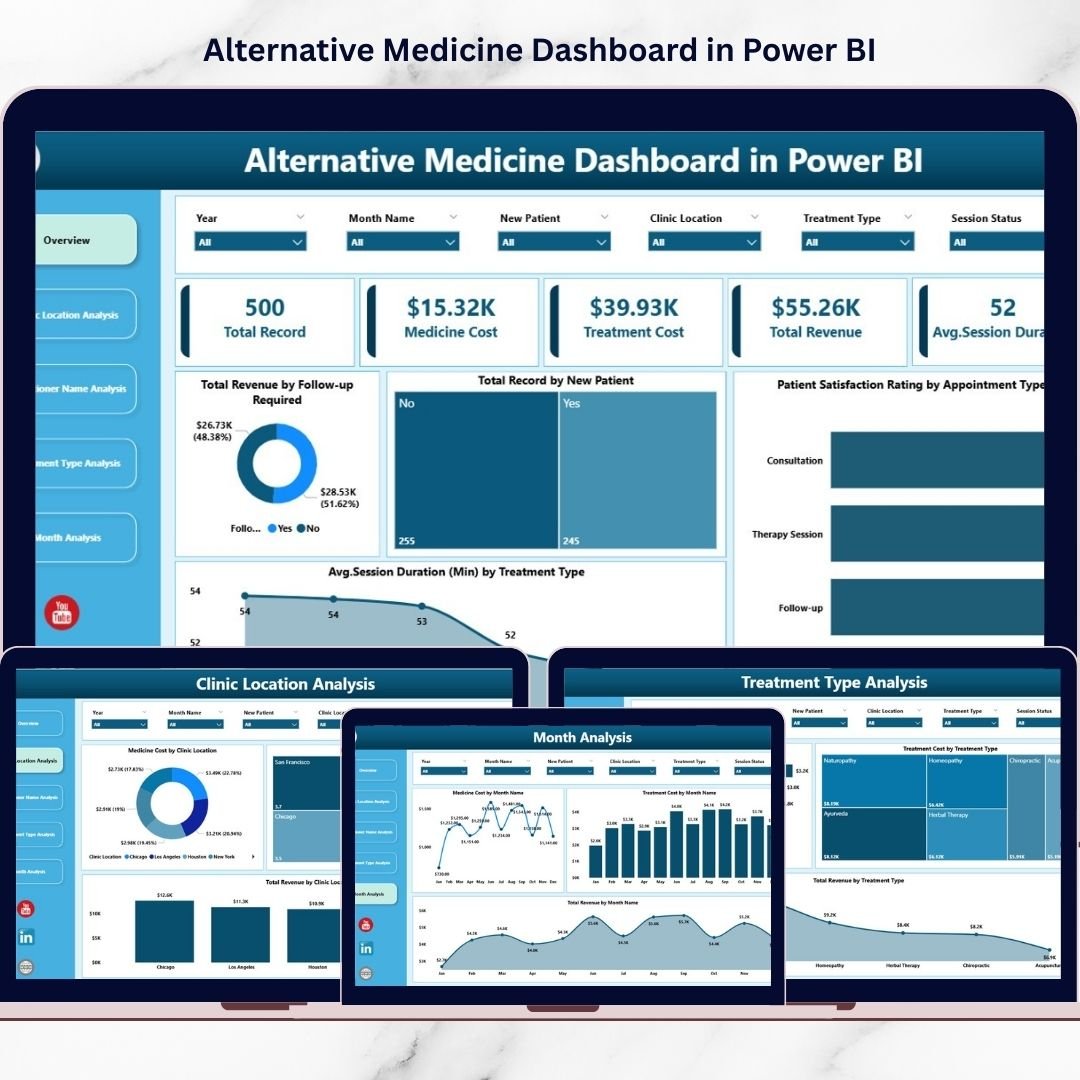
This Power BI solution includes 5 fully interactive analytical pages:
✔️ Overview Page – Complete clinic performance snapshot
✔️ Clinic Location Analysis – Branch comparison insights
✔️ Practitioner Name Analysis – Practitioner performance evaluation
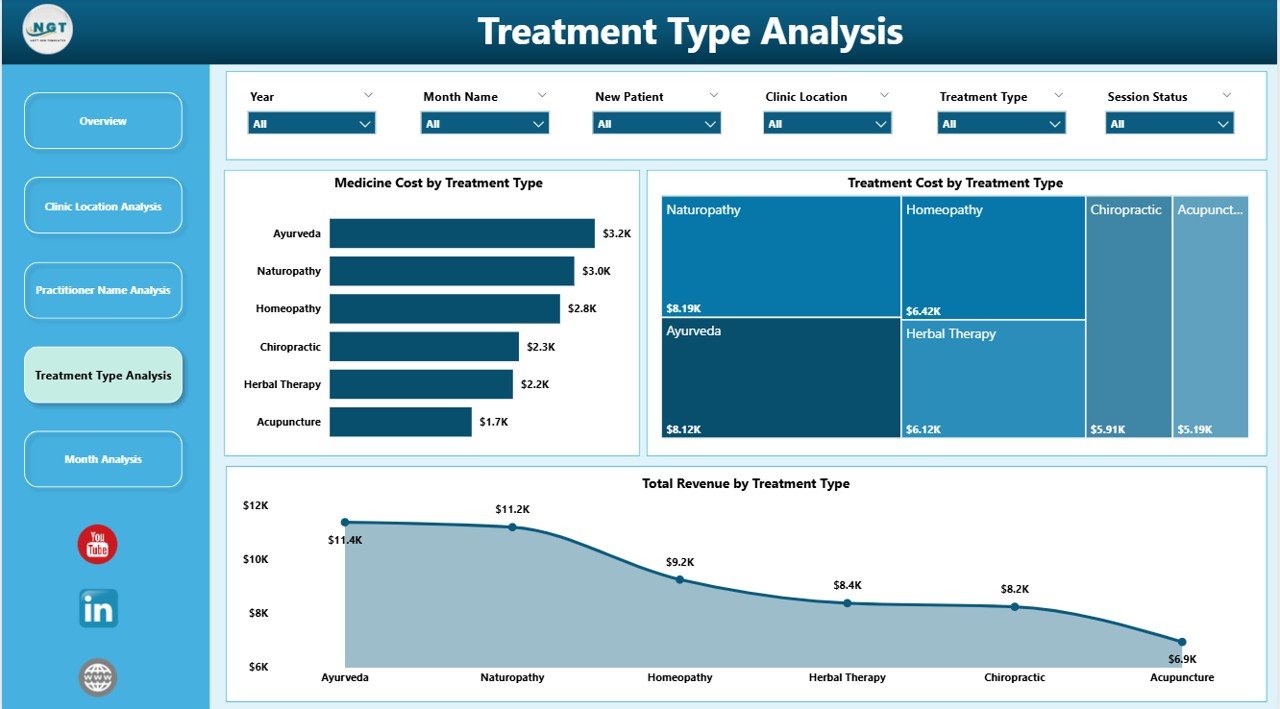
✔️ Treatment Type Analysis – Service profitability and cost tracking
✔️ Month Analysis – Time-based performance trends
Each page contains dynamic visuals and slicers for deep analysis without technical complexity.
🛠️ How to Use the Alternative Medicine Dashboard in Power BI
Getting started is simple:
Step 1: Load clinic data into Power BI
Step 2: Include appointments, treatments, costs, revenue, and satisfaction data
Step 3: Refresh dashboard visuals
Step 4: Apply slicers to filter insights instantly
Step 5: Review KPI cards and charts
Step 6: Take operational actions based on insights
Within minutes, you gain a clear understanding of clinic performance.
🎯 Who Can Benefit from This Alternative Medicine Dashboard
This dashboard is ideal for:
✅ Alternative Medicine Clinics
✅ Ayurveda & Naturopathy Centers
✅ Chiropractic Clinics
✅ Wellness & Holistic Therapy Centers
✅ Clinic Managers & Administrators
✅ Healthcare Consultants
✅ Multi-Location Wellness Businesses
Whether you operate a single clinic or multiple branches, this dashboard helps you manage operations professionally.
Why This Dashboard Improves Clinic Operations
Using this dashboard, clinics can:
✔️ Improve patient retention through follow-up tracking
✔️ Identify top-performing practitioners
✔️ Optimize treatment offerings
✔️ Control treatment and operational costs
✔️ Monitor patient satisfaction trends
✔️ Plan staffing using monthly insights
As a result, clinics deliver better patient experiences while increasing profitability.
### Click hare to read the Detailed blog post
📺 Visit our YouTube channel to learn step-by-step video tutorials
👉 Youtube.com/@PKAnExcelExpert