Managing multiple facility leases should not feel chaotic. Yet many organizations still rely on disconnected spreadsheets that hide critical insights. As a result, lease costs rise silently, escalation clauses go unnoticed, and facility utilization becomes unclear.
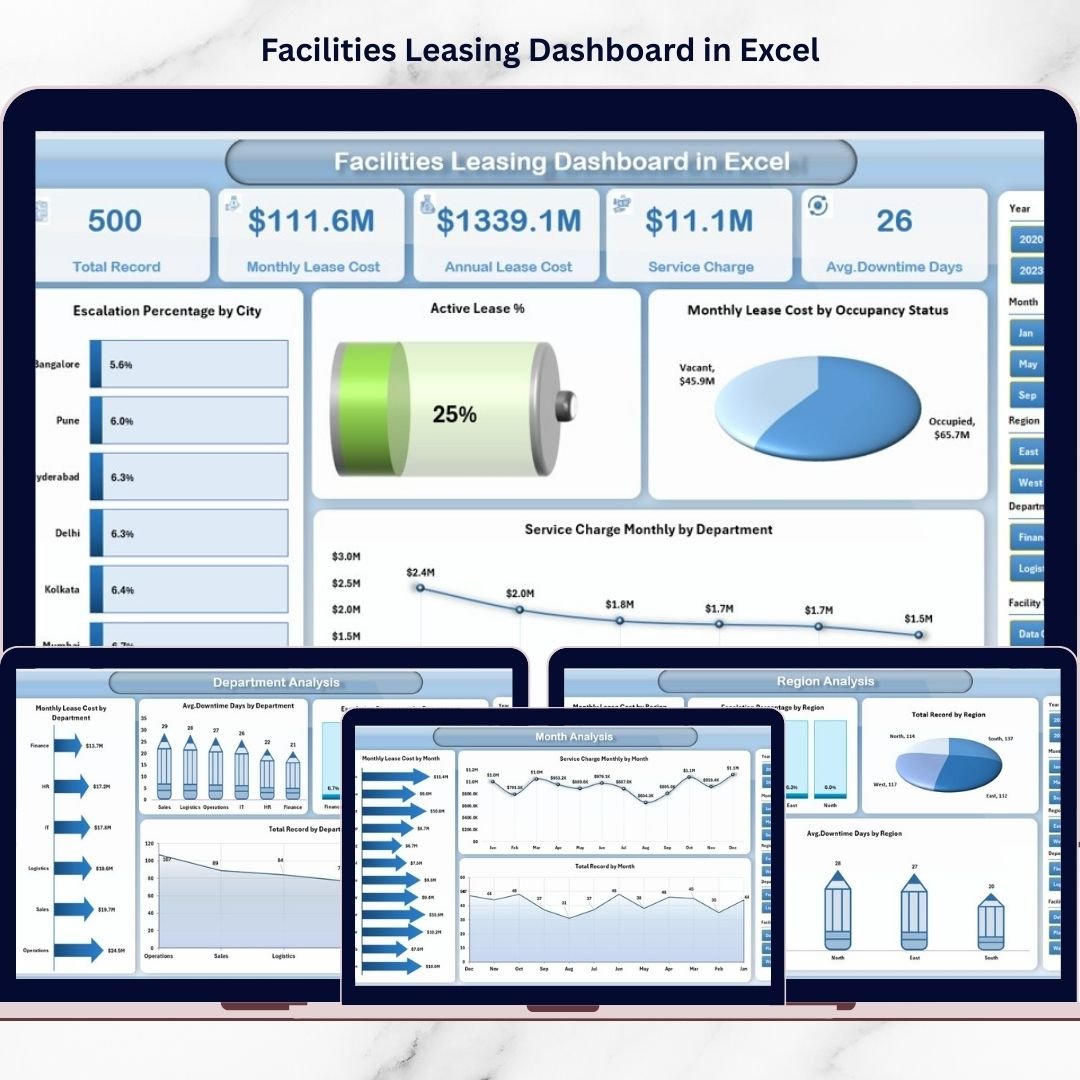
That’s exactly why we created the Facilities Leasing Dashboard in Excel — a powerful, ready-to-use solution that transforms scattered lease data into clear, actionable intelligence.
With this professional dashboard, you can instantly monitor lease expenses, service charges, downtime, and escalation trends — all in one centralized Excel environment. Therefore, your team gains better visibility, faster analysis, and stronger financial control.
🔑 Key Feature of Facilities Leasing Dashboard in Excel
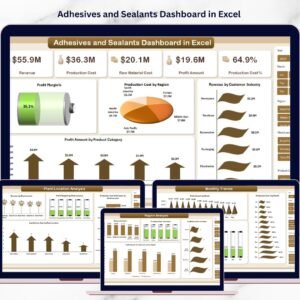
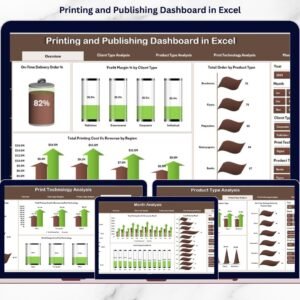
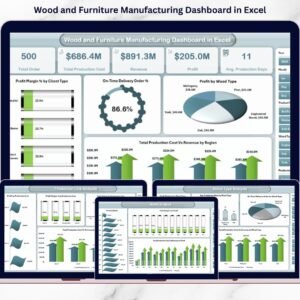
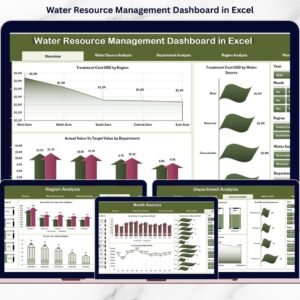
✨ Executive Overview Page
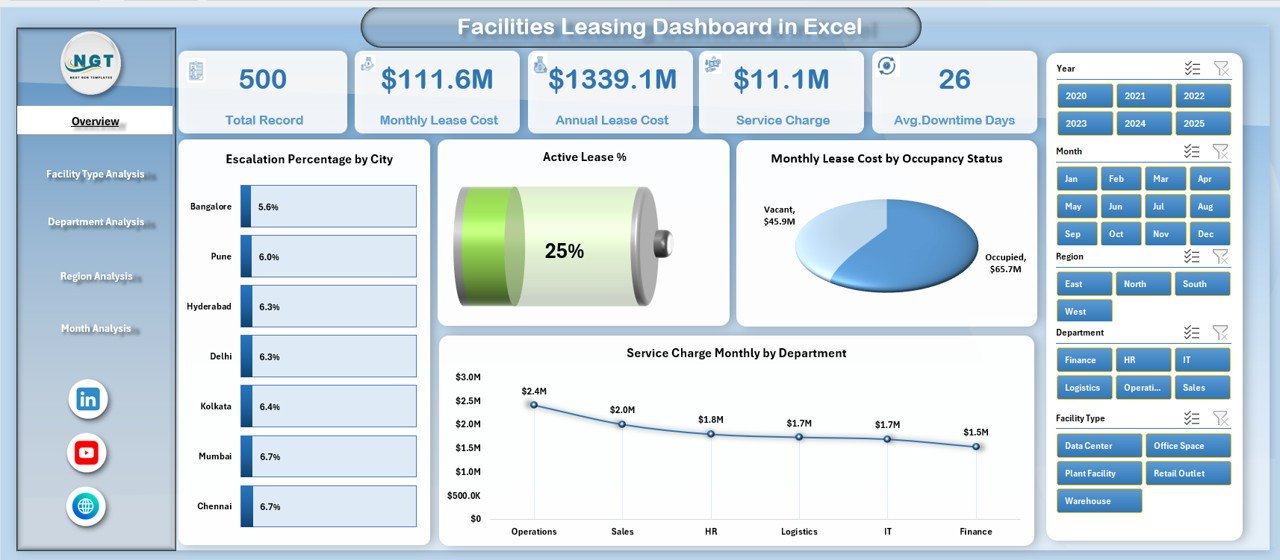
Get a complete snapshot of leasing performance with KPI cards and dynamic visuals for faster decision-making.
📊 Interactive Slicers
Filter by month, region, department, and more to perform focused analysis within seconds.
🧭 Smart Page Navigator
Quickly switch between analytical pages using the left-side navigation panel.
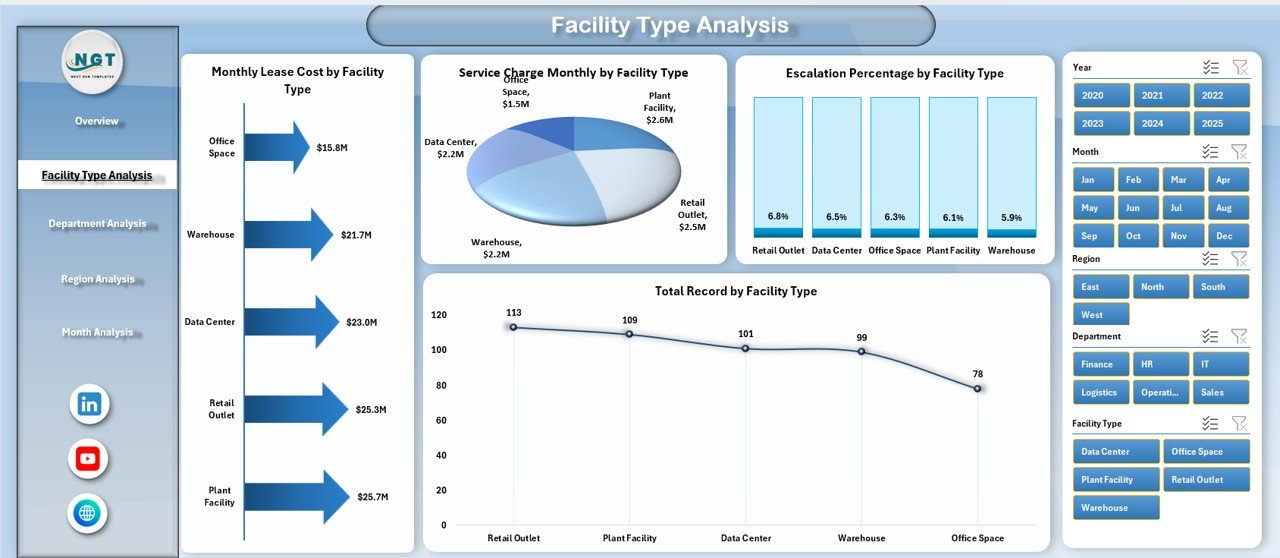
🏢 Facility Type Intelligence
Identify which facility categories are driving the highest costs and escalation trends.
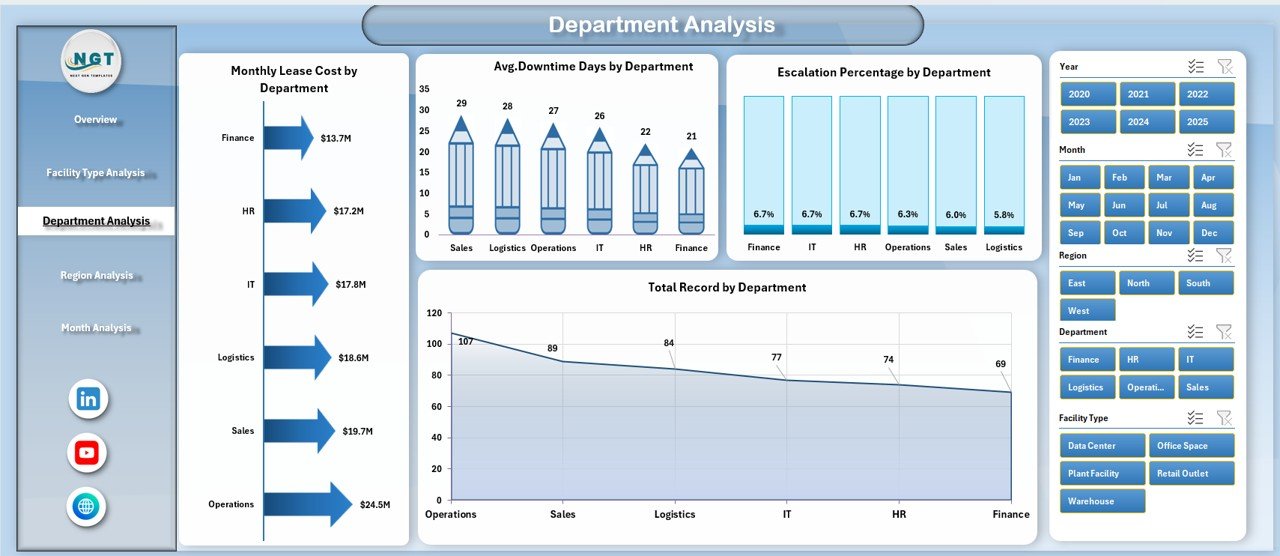
👥 Department-Wise Cost Tracking
Monitor how each department utilizes leased facilities and detect high-cost users.
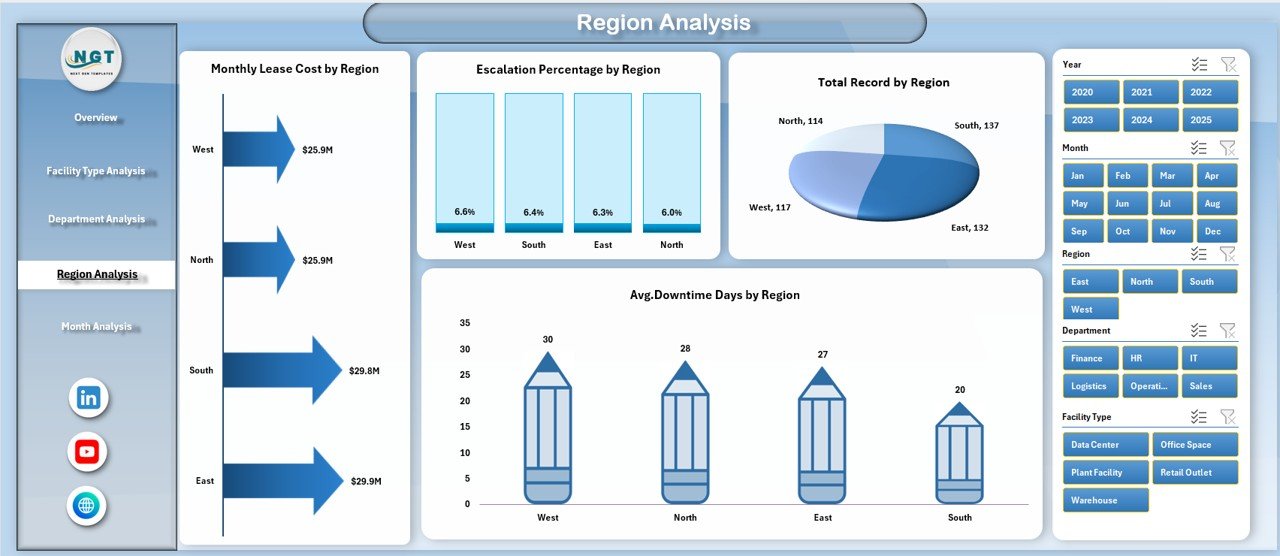
🌍 Regional Performance Visibility
Compare locations to uncover high-risk or high-expense regions instantly.
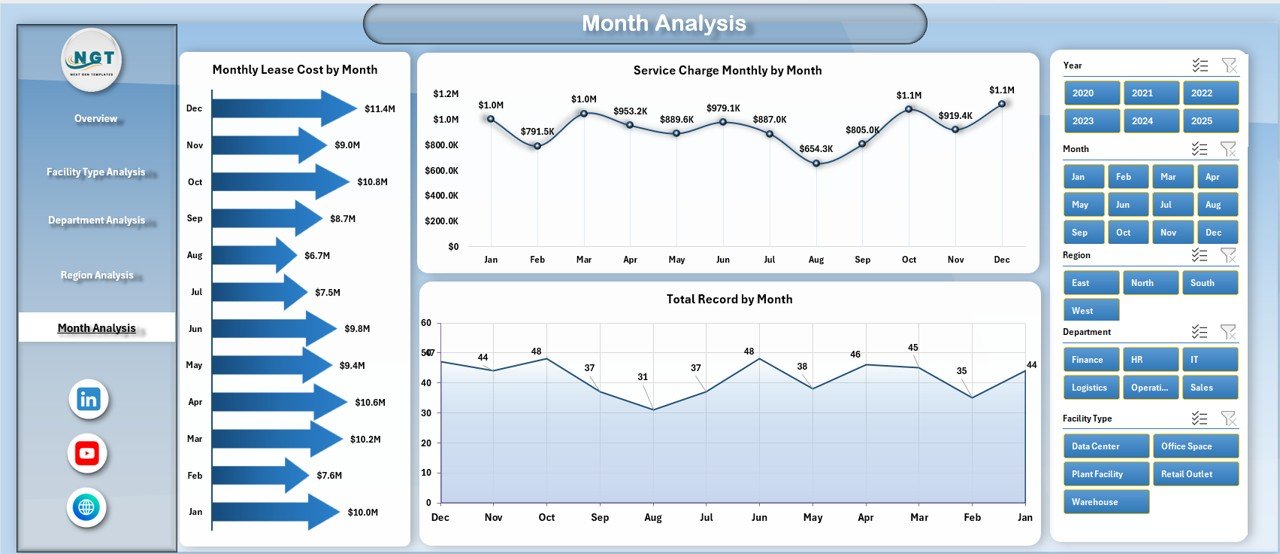
📅 Monthly Trend Analysis
Track lease cost movement and service charge patterns across time.
⚡ Fully Excel-Based Solution
No complex tools required — works smoothly in Microsoft Excel.
📦 What’s Inside the Facilities Leasing Dashboard in Excel
When you download this product, you get a complete, professionally structured Excel system.
✔️ Interactive Dashboard (5 Analytical Pages)
✔️ Clean and Structured Data Sheet
✔️ Support Sheet for Calculations
✔️ Pivot-Ready Data Model
✔️ Dynamic Slicers and KPI Cards
✔️ Ready-to-Use Charts and Visuals
✔️ Easy Monthly Update Structure
Everything is pre-built so you can start analyzing immediately.
🛠️ How to Use the Facilities Leasing Dashboard in Excel
Using this dashboard is simple and beginner-friendly.
Step 1: Download and open the Excel file
Step 2: Update the Data Sheet with your lease information
Step 3: Refresh pivot tables
Step 4: Use slicers to filter insights
Step 5: Review KPI cards and charts for decisions
Within minutes, you will have a complete facility leasing control center ready for action.
🎯 Who Can Benefit from This Facilities Leasing Dashboard in Excel
This dashboard is ideal for organizations managing leased properties across departments or regions.
✅ Facility Managers
✅ Corporate Real Estate Teams
✅ Finance Managers
✅ Operations Heads
✅ Admin Departments
✅ Infrastructure Teams
✅ Multi-location Businesses
If your organization wants tighter control over lease costs and facility performance, this tool is a must-have.
Why This Dashboard Is a Game-Changer
Unlike manual tracking methods, this dashboard gives you:
✔️ Instant cost visibility
✔️ Escalation monitoring
✔️ Downtime tracking
✔️ Department accountability
✔️ Regional comparison
✔️ Faster executive reporting
As a result, your team moves from reactive firefighting to proactive facility optimization.
### Click hare to read the Detailed blog post
📺 Visit our YouTube channel to learn step-by-step video tutorials
👉 Youtube.com/@PKAnExcelExpert