Are your DevOps metrics scattered across spreadsheets? Are you struggling to measure deployment speed, uptime, and failure rates clearly? 🚀
In today’s high-pressure tech environment, DevOps teams cannot afford guesswork. Every deployment, every release, and every system update impacts revenue and customer trust. That’s why you need a centralized, structured, and automated performance tracking system.
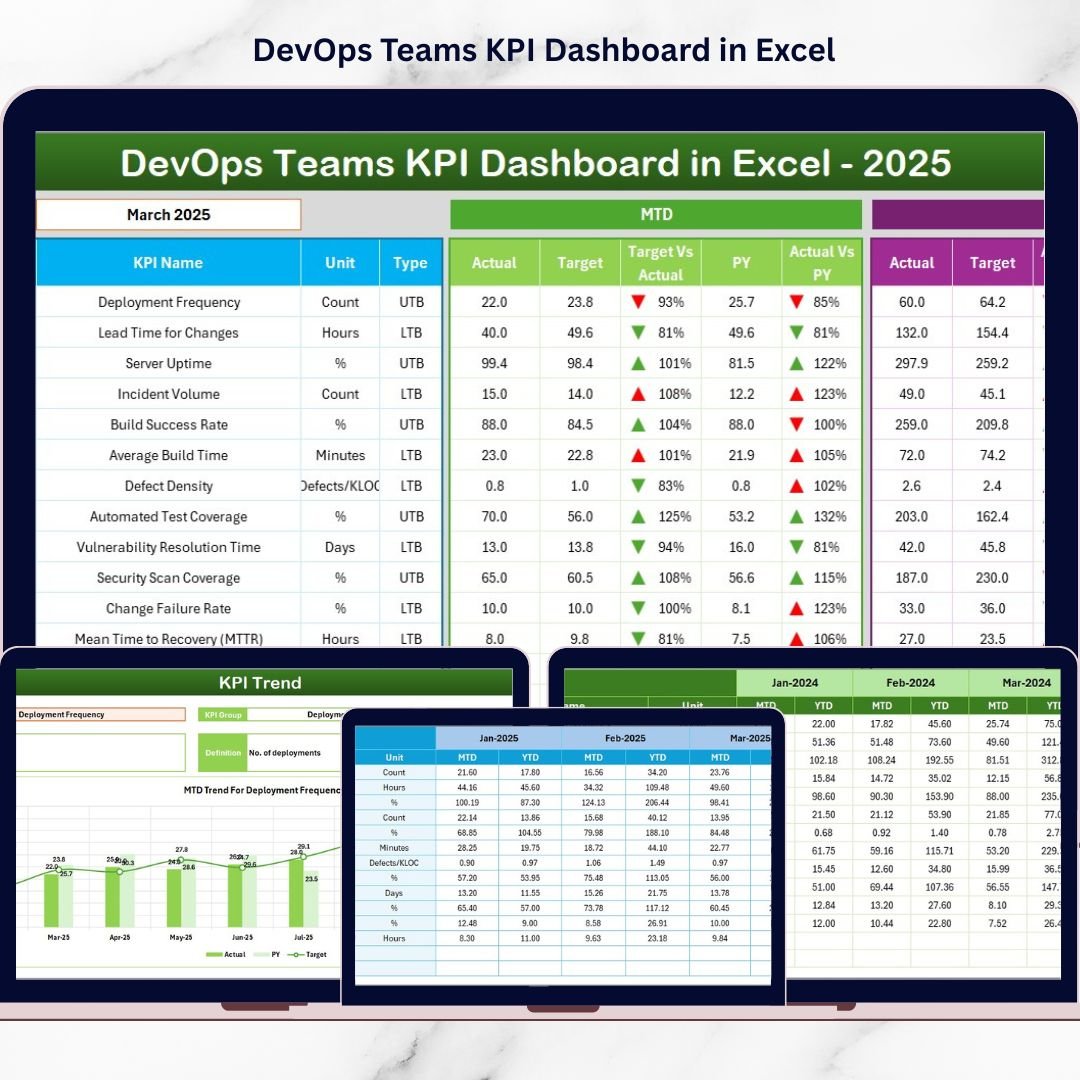
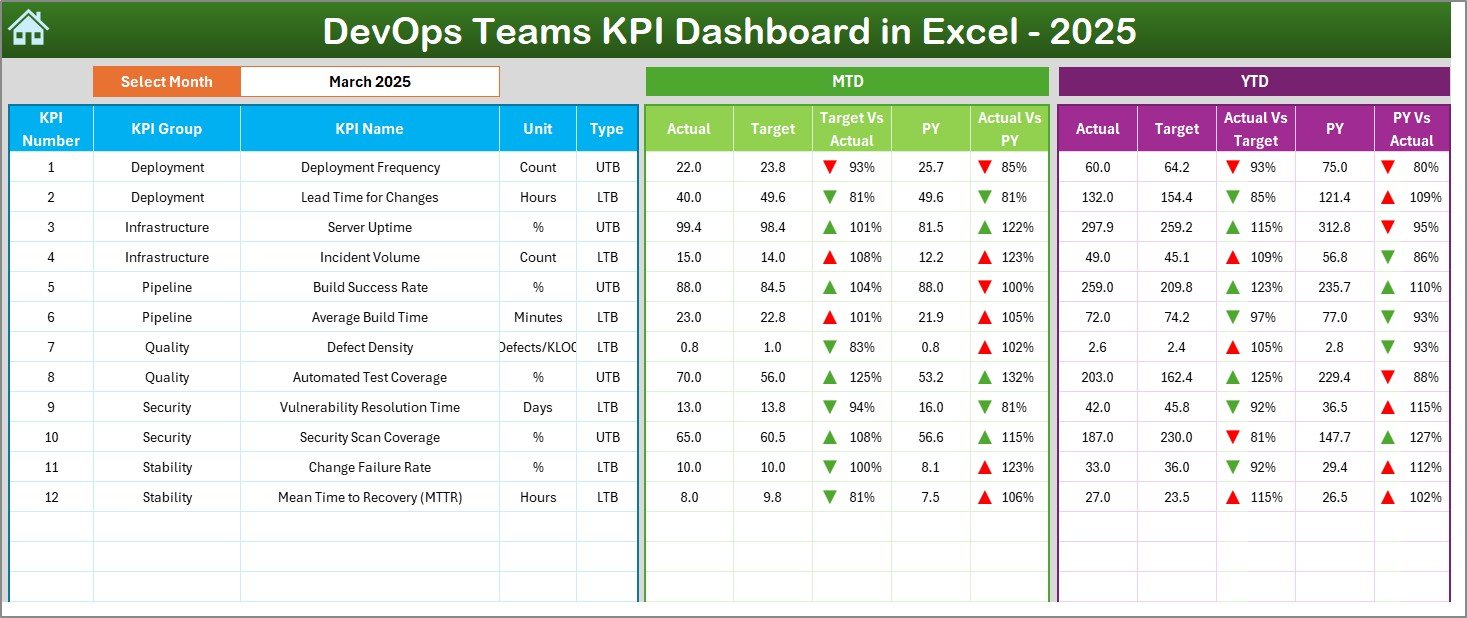
The DevOps Teams KPI Dashboard in Excel is a ready-to-use, professionally designed dashboard that helps you monitor deployment metrics, system reliability, quality indicators, and team productivity — all in one place.
Instead of building reports manually every month, this dashboard gives you instant visibility into Month-to-Date (MTD), Year-to-Date (YTD), Actual vs Target, and Previous Year comparisons.
Now let’s break it down clearly.
🚀 Key Feature of DevOps Teams KPI Dashboard in Excel
✨ Interactive Dashboard View
Select the month from a dropdown (Cell D3) and watch the entire dashboard update automatically.
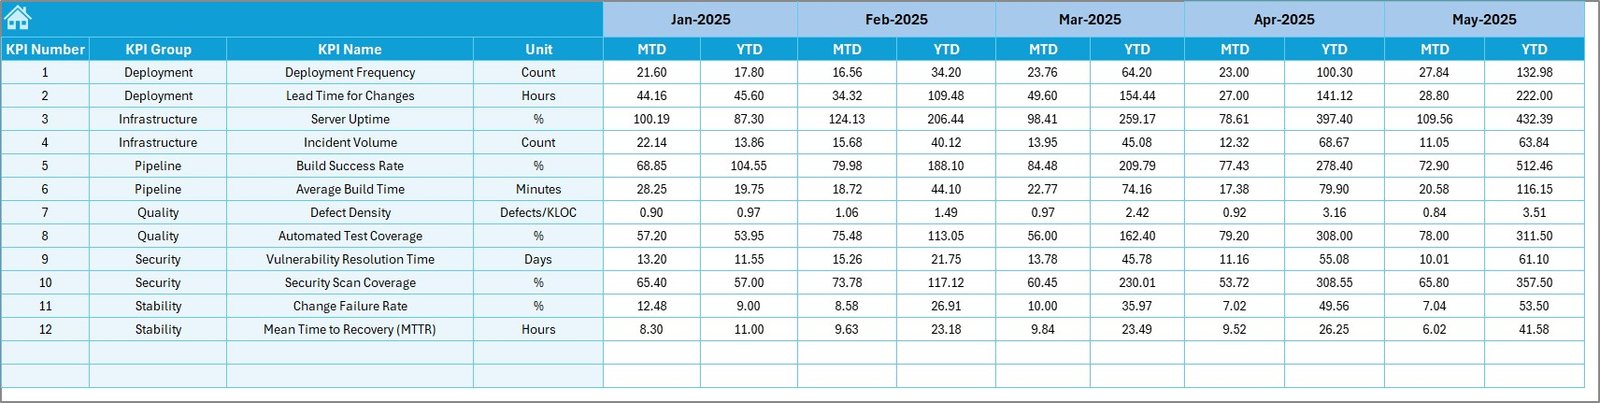
📊 MTD & YTD Performance Tracking
Compare Actual vs Target and Previous Year values with visual indicators.
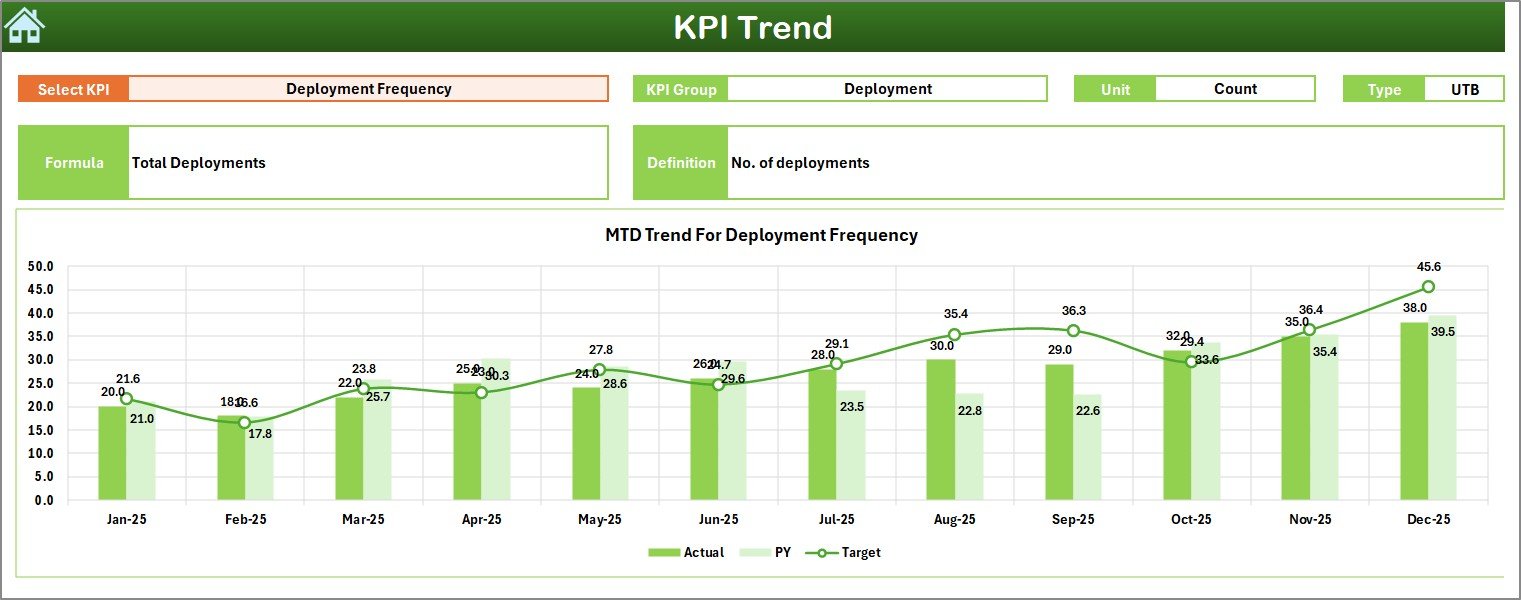
📈 Dynamic KPI Trend Charts
Analyze performance patterns over time using automated trend graphs.
🎯 Target vs Actual Comparisons
Instantly see performance gaps with arrow indicators and color signals.
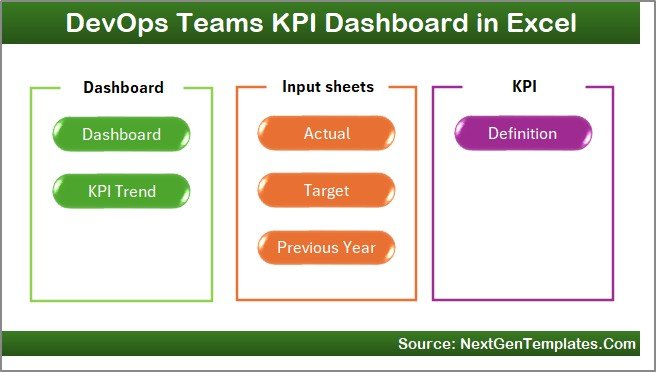
📂 7 Structured Worksheets
Home, Dashboard, KPI Trend, Actual Input, Target Sheet, Previous Year Data, and KPI Definition — everything organized clearly.
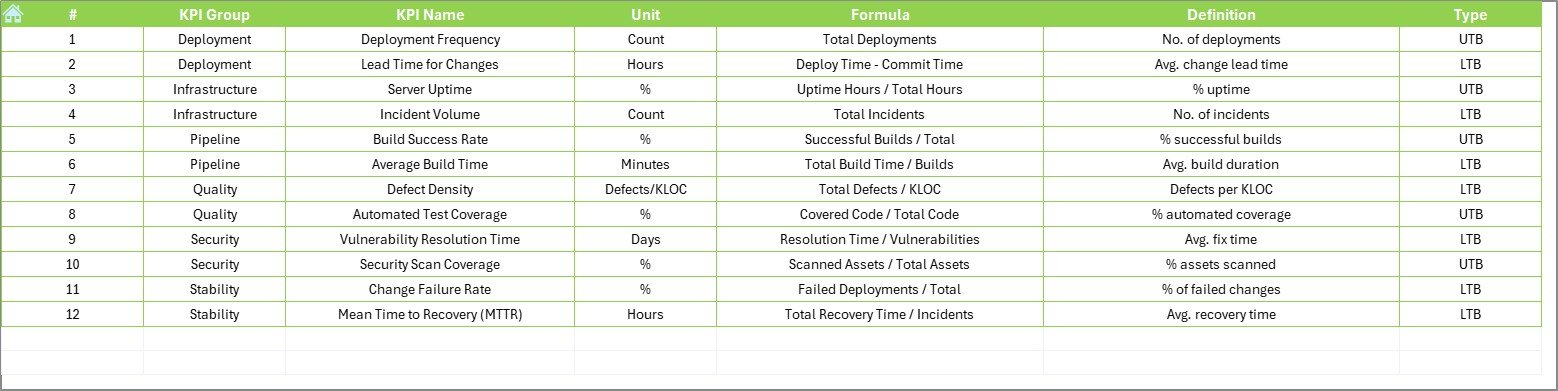
📘 Centralized KPI Documentation
Store KPI name, group, formula, definition, and type (LTB/UTB) in one place.
⚡ Fully Customizable Template
Modify KPIs, targets, and formulas according to your organization’s needs.
Because everything updates automatically, leadership teams can make faster and smarter decisions.
📦 What’s Inside the DevOps Teams KPI Dashboard in Excel
When you download this dashboard, you get:
✔️ A clean home sheet with clickable navigation buttons
✔️ A powerful Dashboard sheet with MTD and YTD comparisons
✔️ A KPI Trend sheet with dynamic charts
✔️ Structured Actual Numbers input sheet
✔️ Dedicated Target sheet for performance goals
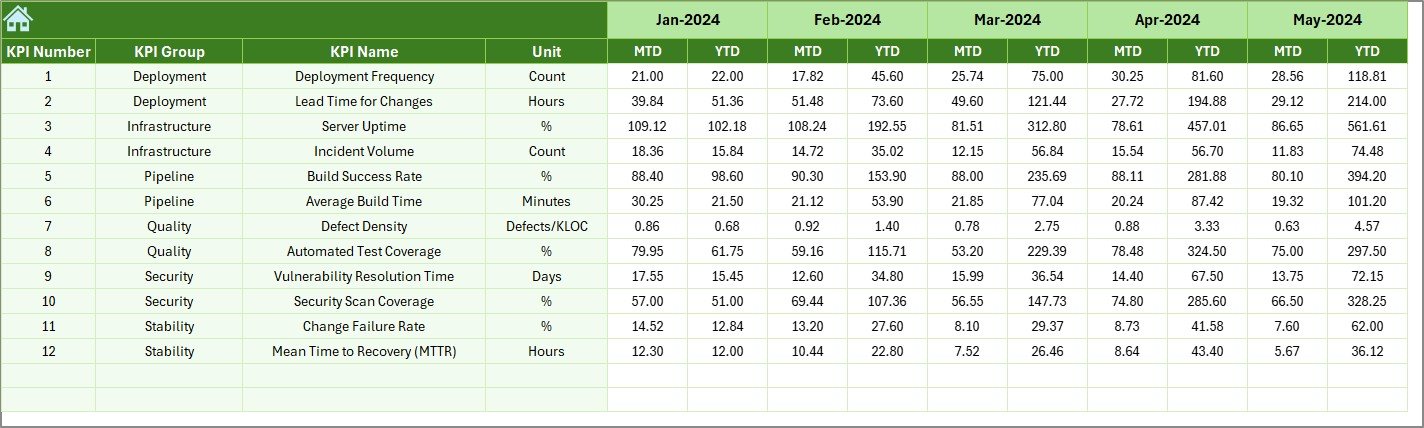
✔️ Previous Year comparison sheet
✔️ KPI Definition documentation sheet
This template tracks major DevOps KPIs such as:
• Deployment Frequency
• Lead Time for Changes
• Change Failure Rate
• System Uptime %
• Mean Time to Recovery (MTTR)
• Defect Leakage Rate
• Build Success Rate
• Automated Test Coverage %
• Sprint Velocity
Everything is structured for clarity and ease of use.
📊 How to Use the DevOps Teams KPI Dashboard in Excel
Using this dashboard is simple:
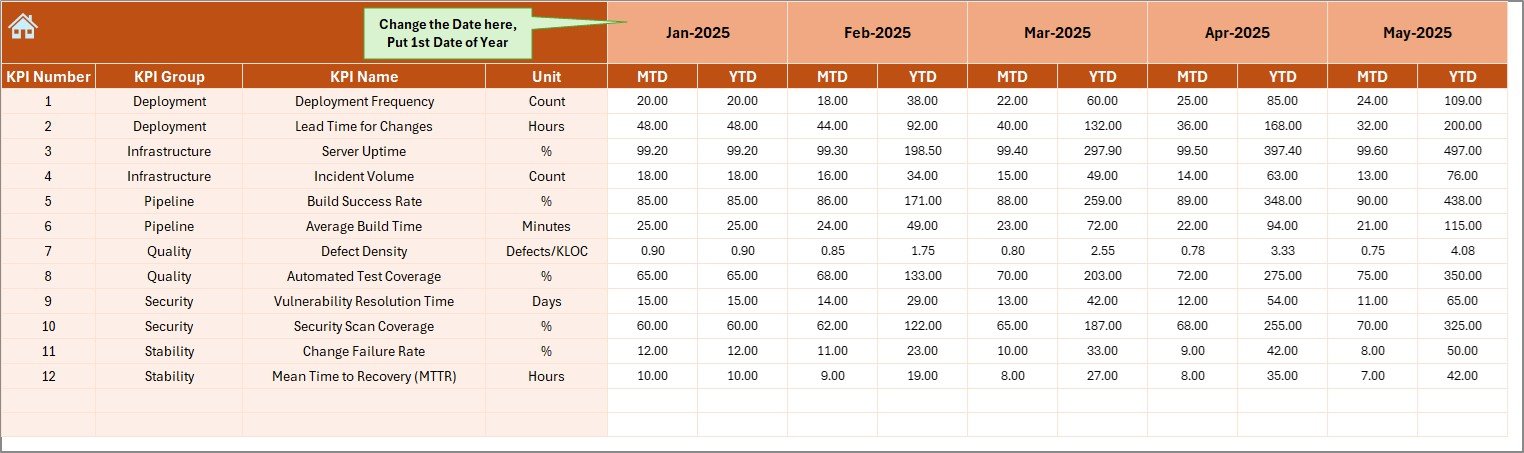
1️⃣ Enter monthly actual values in the Actual Input sheet.
2️⃣ Set performance targets in the Target sheet.
3️⃣ Add previous year numbers for historical comparison.
4️⃣ Select the month from the Dashboard dropdown.
5️⃣ Review MTD, YTD, and trend performance instantly.
Because the template uses structured formulas and conditional formatting, you do not need advanced Excel skills.
The dashboard automatically highlights:
• Performance improvement
• Performance decline
• Target achievement gaps
• Year-over-year growth
This makes monthly review meetings faster and more productive.
👥 Who Can Benefit from This DevOps Teams KPI Dashboard in Excel
This dashboard is perfect for:
👨💻 DevOps Managers
👨💼 CTOs
📊 Engineering Directors
🛠️ IT Operations Teams
📈 Product Owners
🚀 Startups & Enterprises
If you want structured KPI tracking without complex BI tools, this Excel dashboard delivers professional reporting instantly.
By using this dashboard, you improve visibility, increase accountability, reduce reporting time, and build a strong data-driven DevOps culture.
Stop relying on manual reports. Start measuring what truly matters.
Click here to read the Detailed blog post
Visit our YouTube channel to learn step-by-step video tutorials
👉 https://www.youtube.com/@PKAnExcelExpert


