Cyber threats never sleep. Data breaches rise. Compliance standards tighten. And one missed security KPI can cost millions.If your IT security audits still rely on scattered spreadsheets and manual reporting, you are already at risk.It’s time to move from reactive firefighting to proactive security management.Introducing the IT Security Auditing KPI Dashboard in Power BI — a powerful, ready-to-use analytics solution designed to monitor security performance, audit progress, compliance metrics, and risk indicators in one centralized system.
This interactive dashboard transforms complex security data into clear, visual insights. Instead of digging through static reports, you instantly see whether your KPIs meet targets, miss goals, or show warning signals.
Make smarter decisions. Strengthen governance. Stay audit-ready at all times.
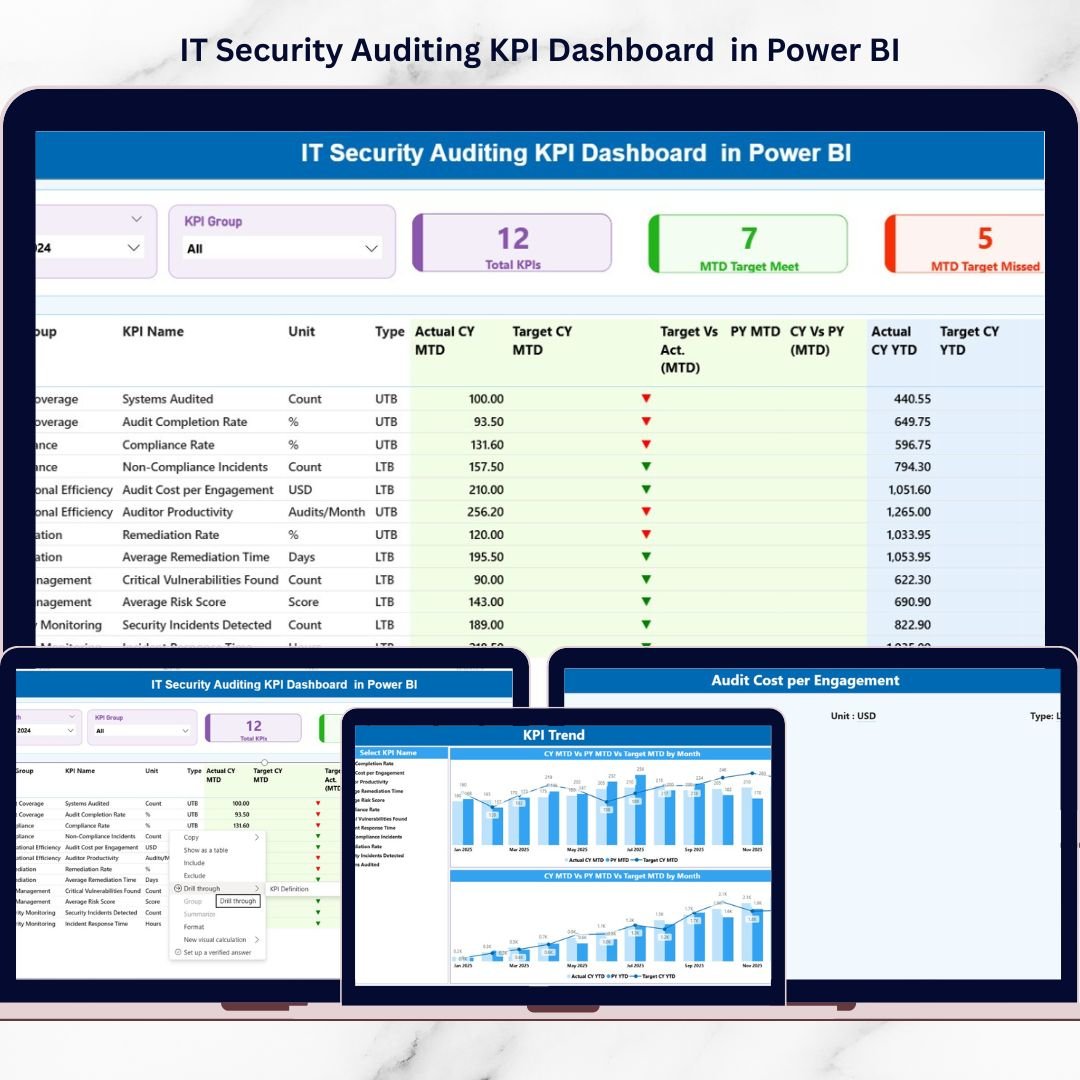
🚀 Key Feature of IT Security Auditing KPI Dashboard in Power BI
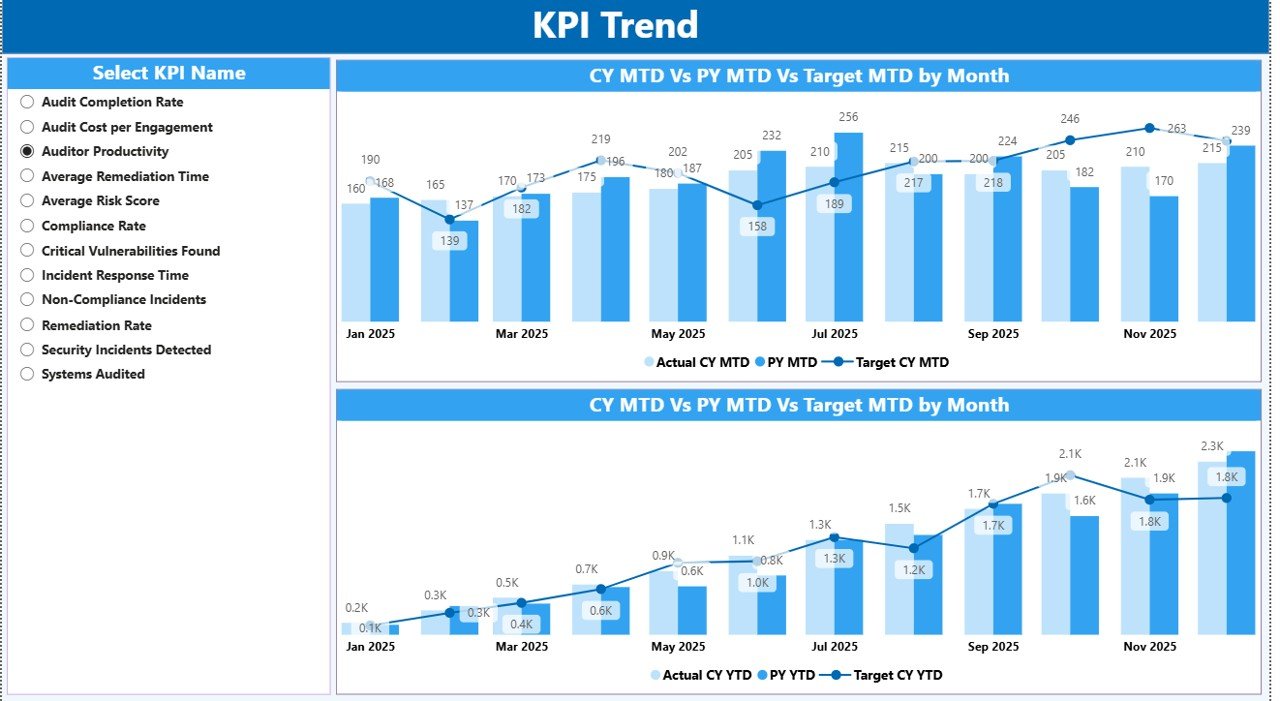
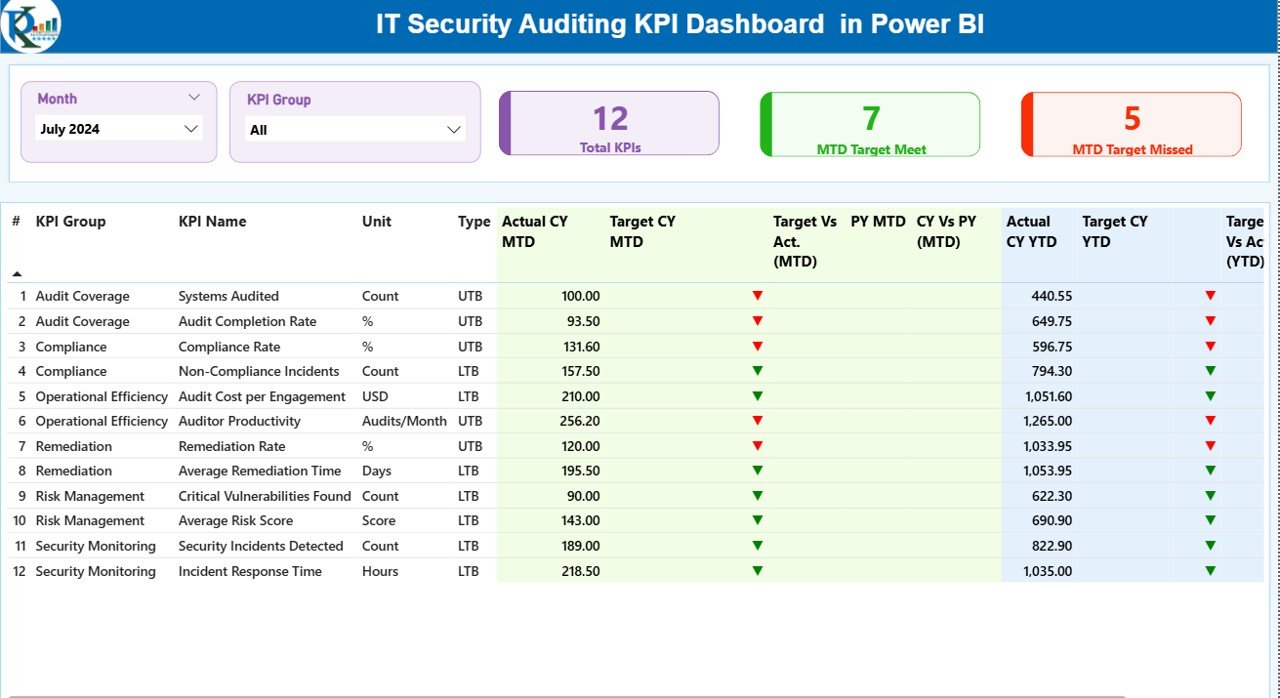
🔐 3 Interactive Dashboard Pages – Summary, KPI Trend, and KPI Definition pages for complete security visibility.
📊 MTD & YTD Performance Tracking – Monitor Month-to-Date and Year-to-Date metrics effortlessly.
📈 Current Year vs Previous Year Comparison – Measure improvement with dynamic year-over-year analysis.
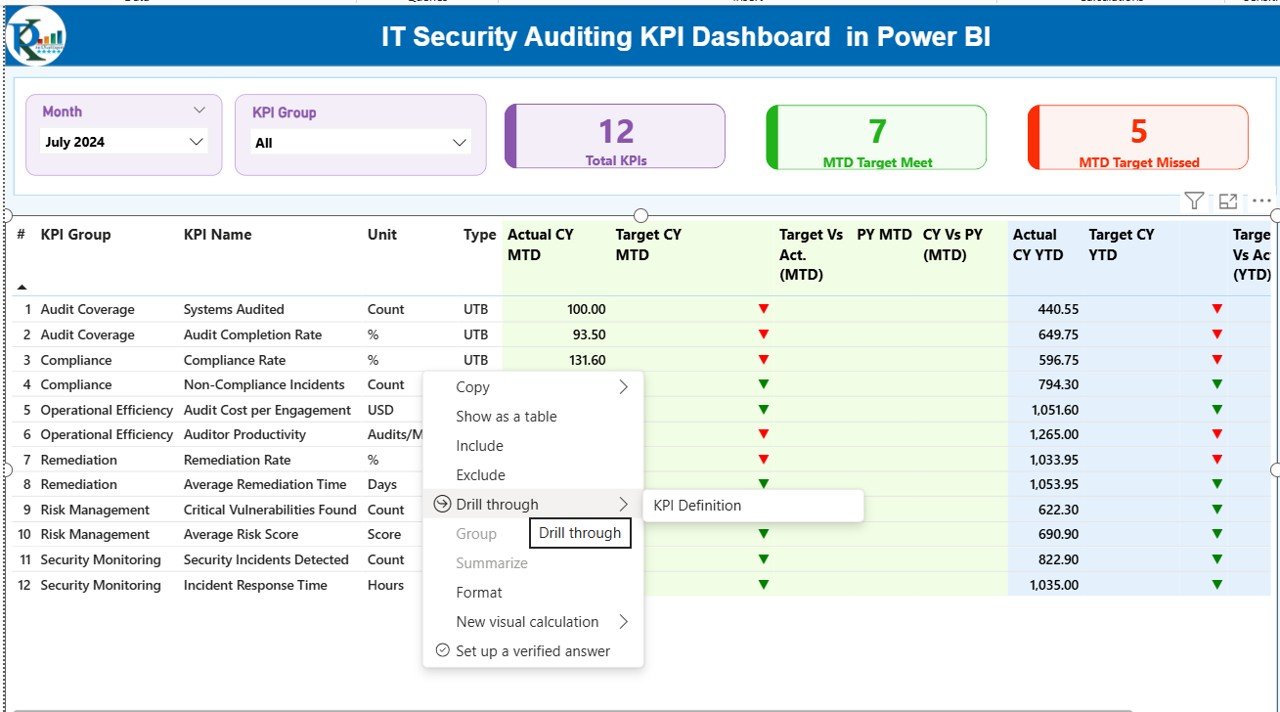
🎯 Target vs Actual Monitoring – Instantly identify underperforming KPIs with visual indicators.
🟢🔴 Smart Status Icons – Green and red symbols highlight performance health immediately.
🧩 KPI Group & Month Slicers – Filter results dynamically for focused analysis.
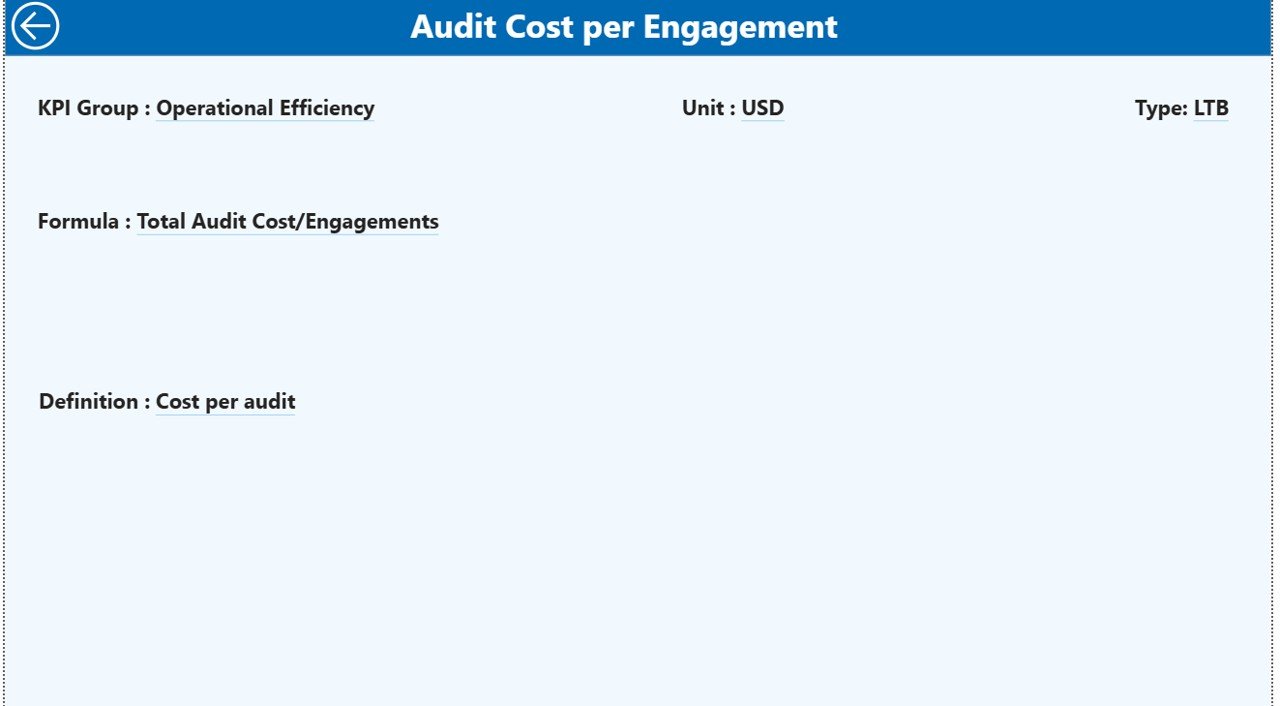
📘 Drill-Through KPI Definitions – Understand formulas, logic, and KPI type (LTB / UTB) in seconds.
📦 What’s Inside the IT Security Auditing KPI Dashboard in Power BI
This ready-to-use product includes:
✔ Fully designed Power BI Dashboard file (.pbix)
✔ Structured Excel data template with three sheets:
-
Input_Actual
-
Input_Target
-
KPI Definition
✔ Pre-configured KPI calculations
✔ Conditional formatting logic
✔ Dynamic slicers and combo charts
✔ Drill-through functionality
✔ Clean and professional layout
The dashboard allows you to track security KPIs such as:
-
Number of Security Incidents
-
Mean Time to Detect (MTTD)
-
Mean Time to Respond (MTTR)
-
Patch Compliance Rate
-
Vulnerability Remediation Rate
-
Audit Findings Closed
-
Compliance Score %
-
Phishing Simulation Failure Rate
-
Open Risk Items
You can also customize KPIs based on ISO 27001, NIST, SOC 2, or internal governance frameworks.
⚙️ How to Use the IT Security Auditing KPI Dashboard in Power BI
Using this dashboard is simple and structured:
1️⃣ Define your KPIs in the KPI Definition sheet.
2️⃣ Enter monthly actual performance in the Input_Actual sheet.
3️⃣ Enter monthly targets in the Input_Target sheet.
4️⃣ Connect the Excel file to Power BI.
5️⃣ Refresh the dashboard monthly.
The system automatically calculates:
-
Target vs Actual (MTD & YTD)
-
Current Year vs Previous Year comparison
-
KPI status indicators
-
Performance trends over time
No complex setup. No manual calculations. Just update the data and analyze results.
👥 Who Can Benefit from This IT Security Auditing KPI Dashboard?
This dashboard is ideal for:
🔹 IT Security Managers
🔹 Internal Audit Teams
🔹 Compliance Officers
🔹 Risk Management Professionals
🔹 CIOs and CTOs
🔹 Managed Security Service Providers
🔹 Organizations preparing for regulatory audits
If your organization handles sensitive data, manages compliance frameworks, or conducts regular security audits, this dashboard becomes an essential governance tool.
💡 Why This Dashboard Is a Game-Changer
Instead of reacting to incidents, you start preventing them.
Instead of waiting for quarterly reports, you monitor performance in real time.
Instead of guessing security posture, you measure it clearly.
With structured KPI tracking, historical comparison, and visual performance indicators, leadership gains full transparency into IT security health.
That means:
✔ Better risk prioritization
✔ Faster decision-making
✔ Stronger compliance management
✔ Improved accountability
✔ Enhanced IT governance
Cybersecurity risks evolve daily. Your reporting system should evolve too.
The IT Security Auditing KPI Dashboard in Power BI helps you stay ahead, stay compliant, and stay secure.
Click here to read the Detailed blog post
Watch the step-by-step video tutorial: