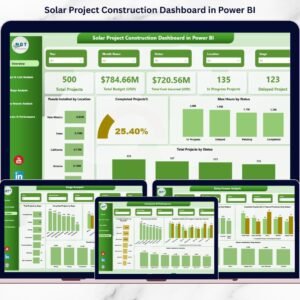
The solar industry is expanding at record speed. New projects launch every month. Investors demand accountability. Deadlines are tight. Budgets are stricter than ever.Yet many solar developers still rely on scattered Excel files to track construction progress.That approach costs time. It creates confusion. And worst of all, it delays decisions.Now imagine monitoring budget, delays, contractor performance, stages, and installation progress — all in one powerful, interactive dashboard.That’s exactly what the Solar Project Construction Dashboard in Power BI delivers.This ready-to-use Power BI solution transforms raw project data into clear visuals and actionable insights. Instead of chasing spreadsheets, you get instant clarity across all active solar sites.
🚀 Key Feature of Solar Project Construction Dashboard in Power BI
⚡ 5 Fully Interactive Dashboard Pages – Overview, Budget & Cost, Stage Analysis, Delay Analysis, and Contractor Performance.
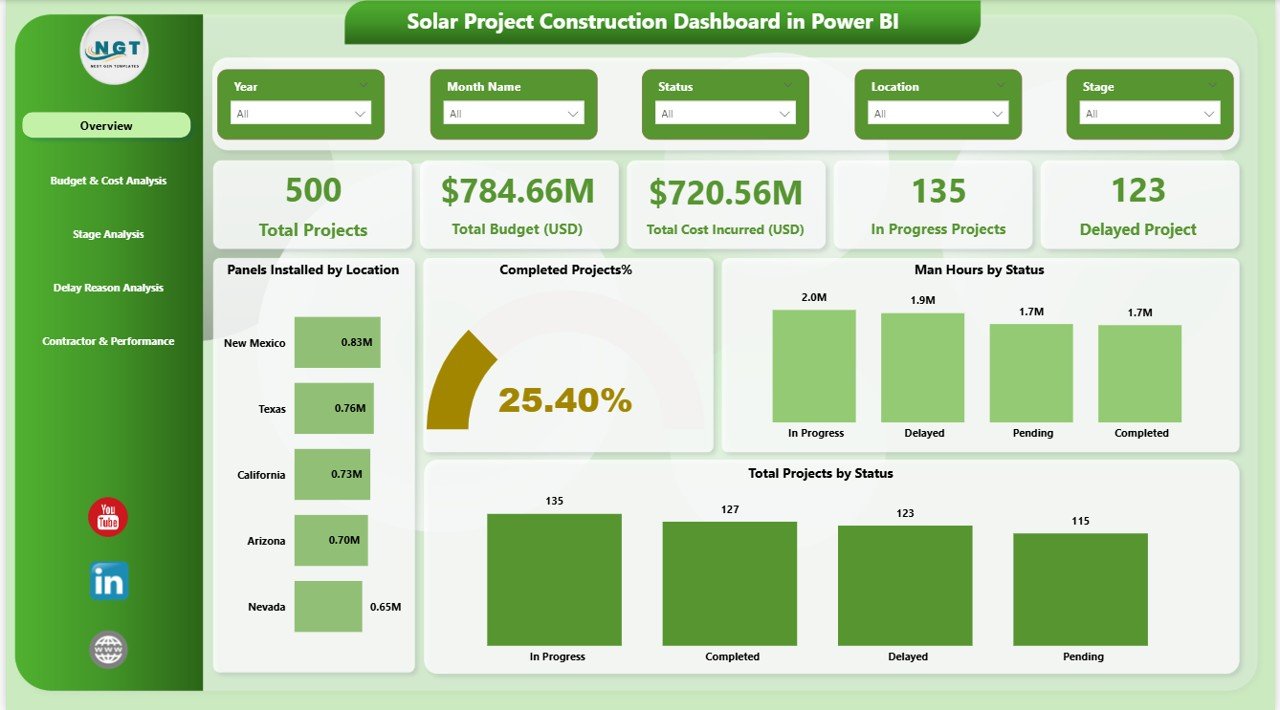
📊 Real-Time KPI Monitoring – Track Total Projects, Budget, Cost Incurred, Delayed Projects, and Completion % instantly.
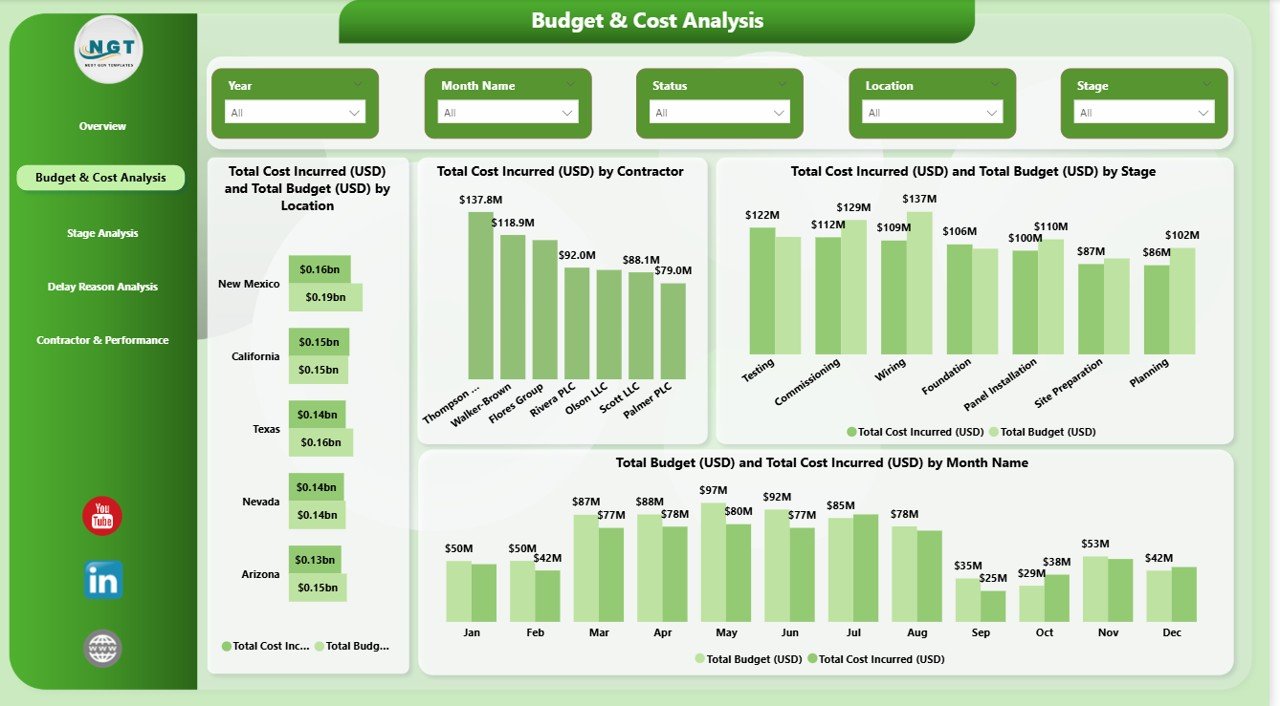
💰 Budget vs Actual Comparison – Identify overspending early and protect project margins.
📍 Location & Stage-Based Filtering – Use dynamic slicers to drill down by Location, Contractor, Stage, or Month.
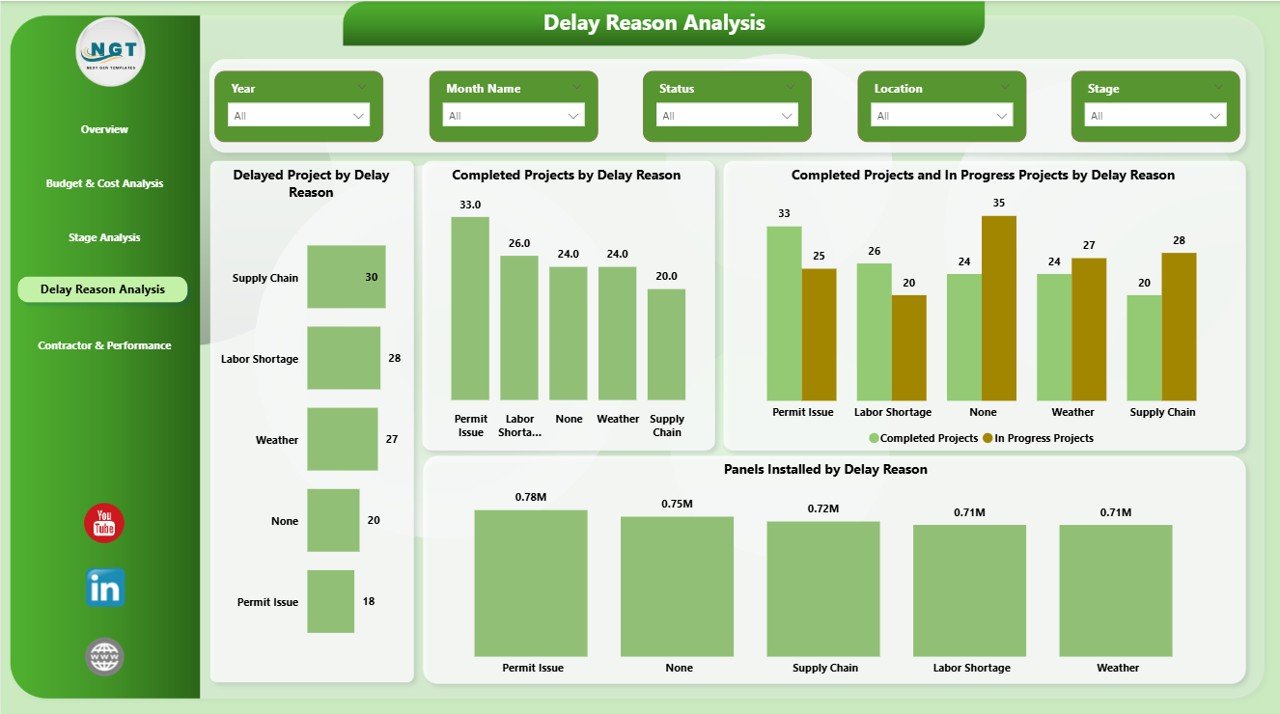
📈 Delay Reason Analysis – Understand root causes like weather, material shortages, or permit approvals.
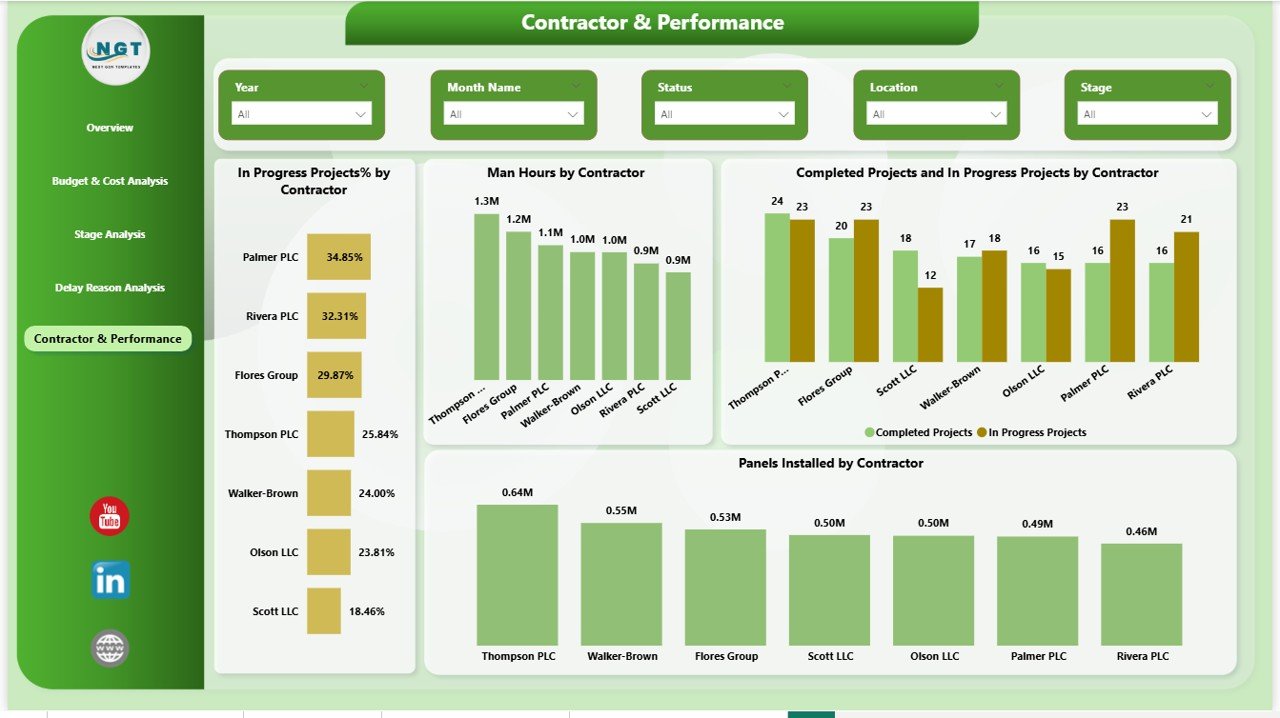
👷 Contractor Performance Insights – Compare productivity, man-hours, and installation progress across contractors.
🔄 Dynamic Drill-Down Capability – Click any visual to explore deeper insights instantly.
📌 Clean & Professional Layout – Executive-ready visuals designed for decision-makers.
📦 What’s Inside the Solar Project Construction Dashboard in Power BI
When you download this product, you receive:
✔ Power BI (.pbix) Dashboard File
✔ Structured Excel Data Template
✔ Pre-built 5 Dashboard Pages
✔ Ready-to-Use KPIs & Measures
✔ Dynamic Slicers & Filters
✔ Interactive Charts & KPI Cards
✔ Fully Editable Layout
The dashboard includes powerful pages such as:
Overview Page – Project health snapshot with KPI cards and installation metrics.
Budget & Cost Page – Monthly and stage-level financial tracking.
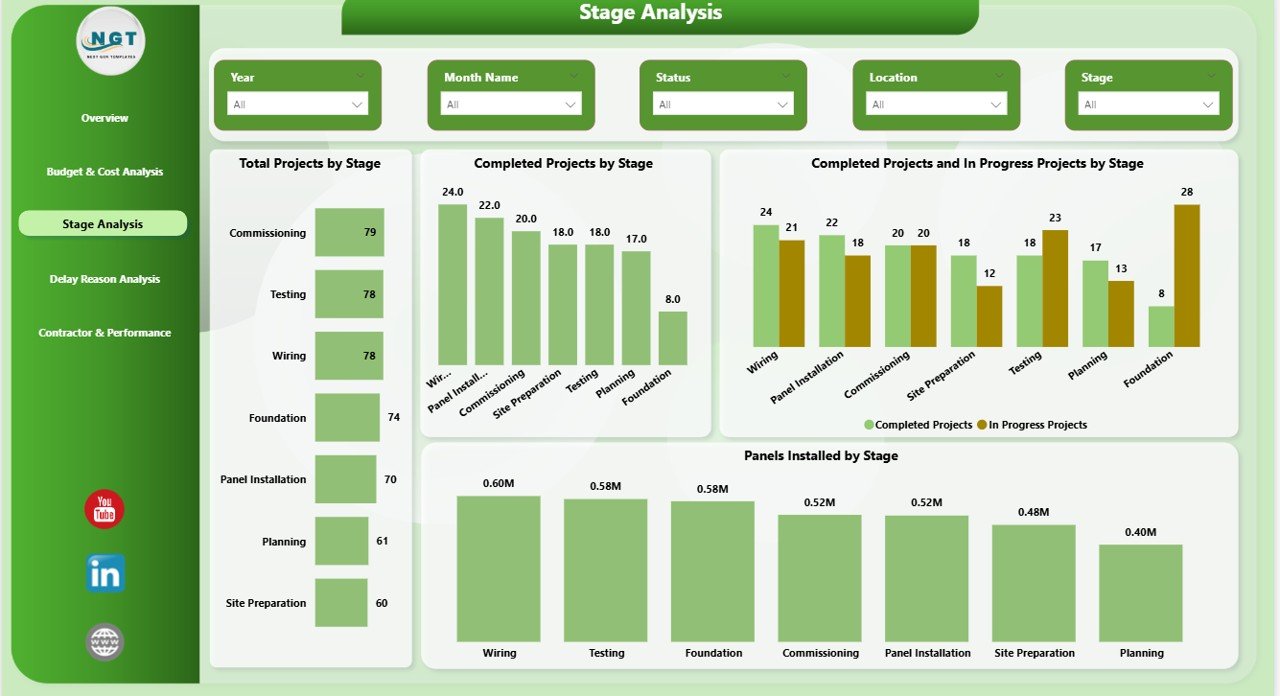
Stage Analysis Page – Monitor workflow bottlenecks and completion ratios.
Delay Reason Page – Identify and reduce recurring delay patterns.
Contractor Performance Page – Compare efficiency and execution performance.
Everything is structured for immediate use.
🛠 How to Use the Solar Project Construction Dashboard in Power BI
Getting started is simple.
1️⃣ Enter your project data in the structured Excel template.
2️⃣ Connect the Excel file to Power BI.
3️⃣ Refresh the dashboard.
4️⃣ Use slicers to filter by location, contractor, or stage.
5️⃣ Review insights and share with stakeholders.
Within minutes, you gain complete visibility over your solar construction projects.
No coding required. No complex modeling.
Just structured data and powerful insights.
👥 Who Can Benefit from This Solar Project Construction Dashboard in Power BI
This dashboard is perfect for:
☀ Solar Project Developers
🏗 EPC Contractors
🌍 Renewable Energy Companies
📊 Project Managers
💼 Financial Controllers
📋 Operations Heads
If your organization manages multiple solar sites, this dashboard becomes your control center.
It helps you:
• Reduce cost overruns
• Improve contractor accountability
• Minimize delays
• Increase transparency
• Make faster decisions
Data-driven project management increases profitability.
Solar construction is complex. However, your reporting should not be.
Instead of reacting to problems after they happen, this dashboard helps you act early. You see trends before they become issues. You control budgets before they overshoot. You manage contractors based on real performance data.
If you want stronger financial visibility, smoother execution, and higher project efficiency — this dashboard is your competitive advantage.
Make smarter decisions. Complete projects faster. Protect your margins.
The future of solar construction management is data-driven.