In a fast-moving logistics world, postal leaders cannot rely on scattered spreadsheets anymore. Delivery delays, rising operational costs, missed targets, and customer complaints demand real-time visibility.
What if you could track every postal KPI — MTD, YTD, Target vs Actual, and Year-over-Year growth — in one interactive Power BI dashboard?
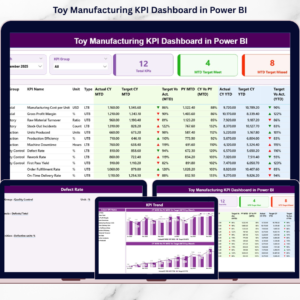
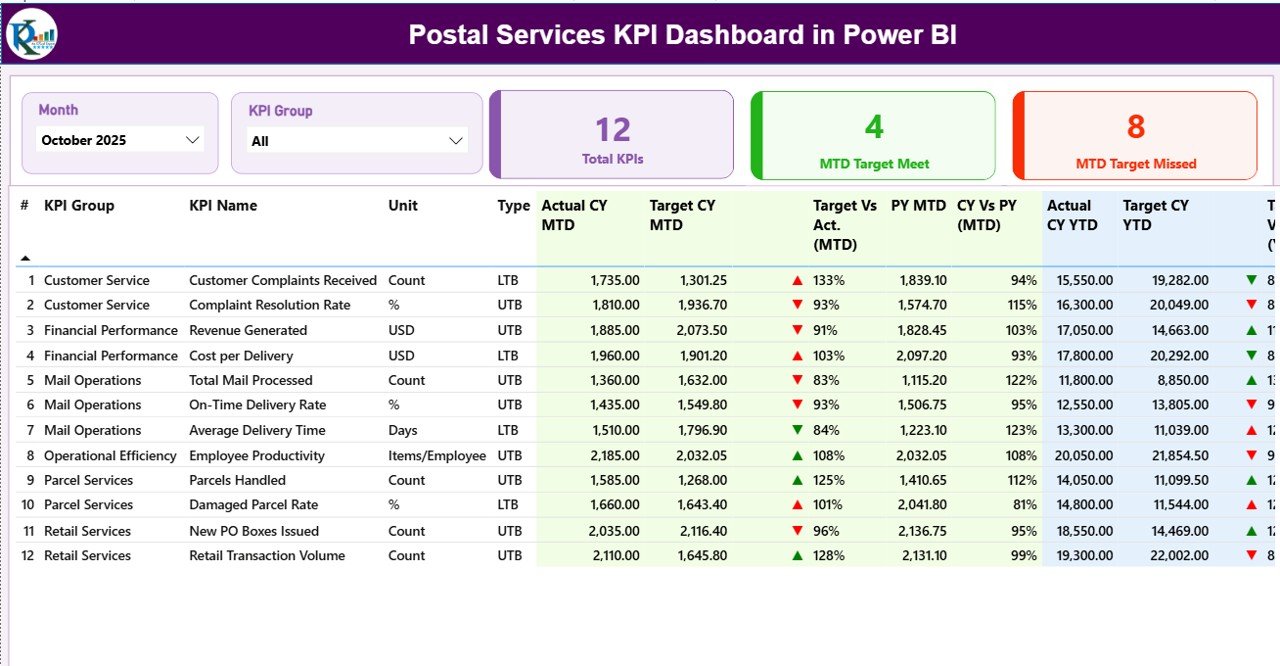
Introducing the Postal Services KPI Dashboard in Power BI — a ready-to-use performance tracking solution designed specifically for postal departments, courier companies, and logistics networks.
This dashboard connects structured Excel data with dynamic Power BI visuals. With powerful slicers, KPI cards, combo charts, and drill-through pages, you gain instant clarity into operational, financial, and customer performance metrics.
No manual calculations. No complicated reporting. Just structured, interactive, and professional KPI monitoring.
🚀 Key Feature of Postal Services KPI Dashboard in Power BI
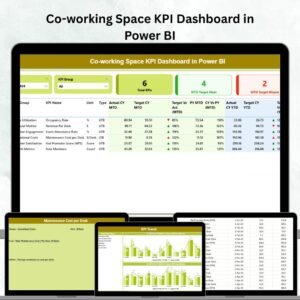
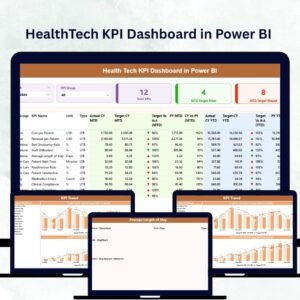
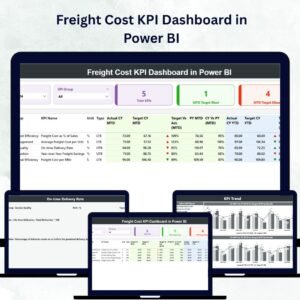
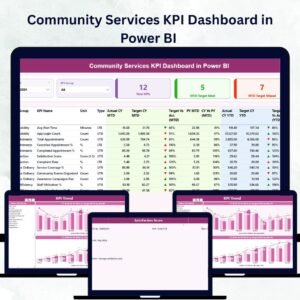
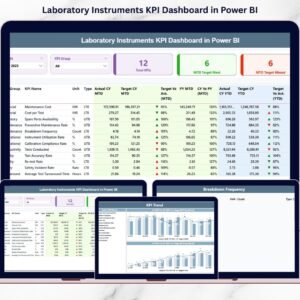
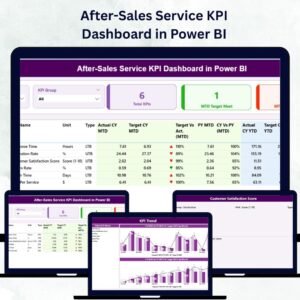
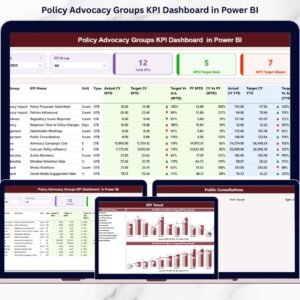
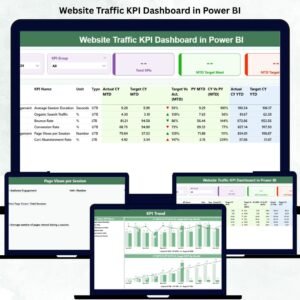
📊 3 Fully Interactive Pages – Summary, KPI Trend, and KPI Definition pages for complete performance analysis.
🎯 Target vs Actual Comparison – Instantly measure performance achievement using automated calculations.
📈 MTD & YTD Tracking – Monitor both short-term and long-term progress in seconds.
🔄 Previous Year (CY vs PY) Analysis – Identify growth trends clearly with year-over-year comparison.
🟢🔴 Smart Performance Indicators (LTB & UTB Logic) – Automatic ▲ green and ▼ red icons based on KPI type.
🧭 Dynamic Slicers – Filter by Month and KPI Group for instant insights.
🔍 Drill-Through KPI Definitions – Click to view detailed formula, unit, and explanation of each KPI.
📂 Excel Data Integration – Simple data entry with auto-refresh capability.
📦 What’s Inside the Postal Services KPI Dashboard in Power BI
This Power BI file includes 3 structured pages:
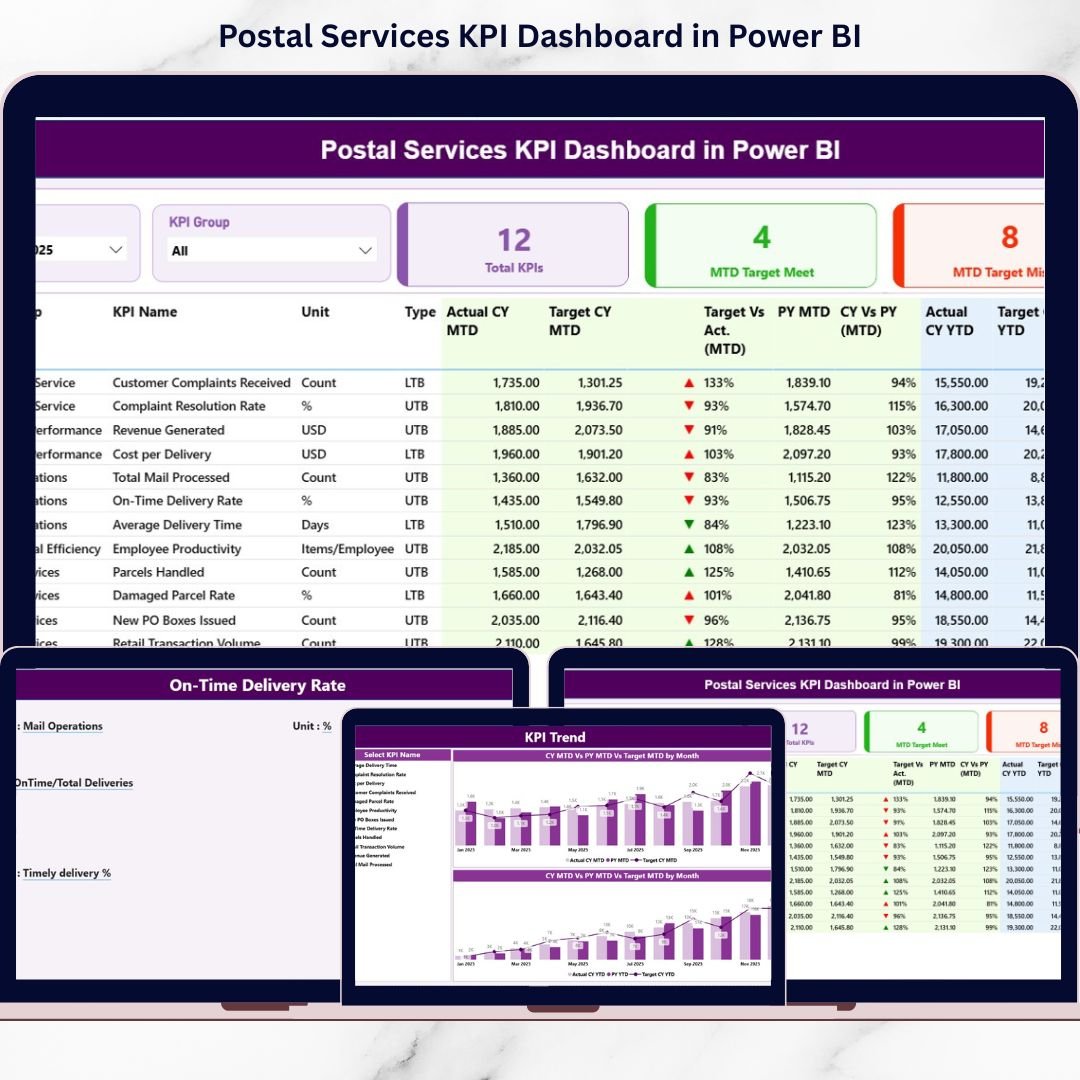
1️⃣ Summary Page – Performance Command Center
-
Month & KPI Group slicers
-
KPI cards:
-
Total KPI Count
-
MTD Target Met
-
MTD Target Missed
-
-
Detailed KPI performance table with:
-
Actual CY MTD & YTD
-
Target CY MTD & YTD
-
Previous Year comparison
-
Target vs Actual %
-
CY vs PY %
-
Performance icons
-
This page gives leadership a quick overview of performance gaps.
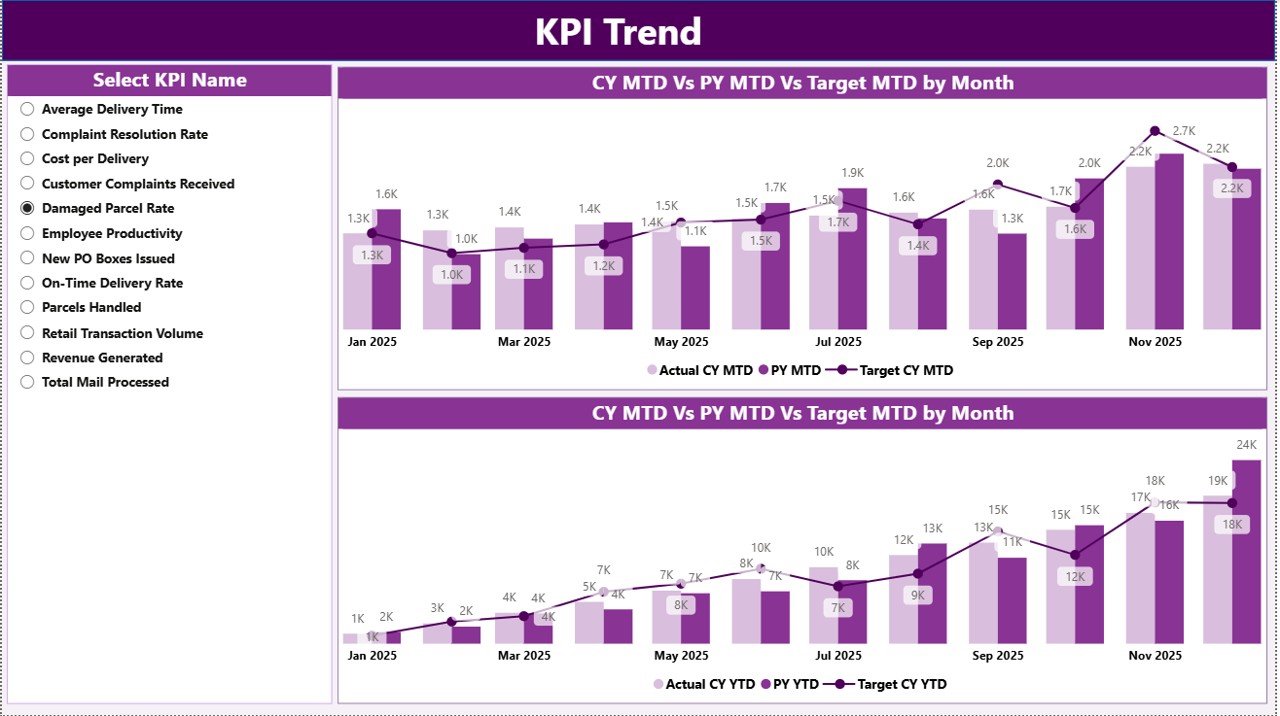
2️⃣ KPI Trend Page – Visual Performance Intelligence
-
2 Combo Charts:
-
MTD Comparison (Actual vs Target vs PY)
-
YTD Comparison (Actual vs Target vs PY)
-
-
KPI Name slicer
Instead of reviewing raw numbers, managers analyze trends visually and identify seasonal patterns.
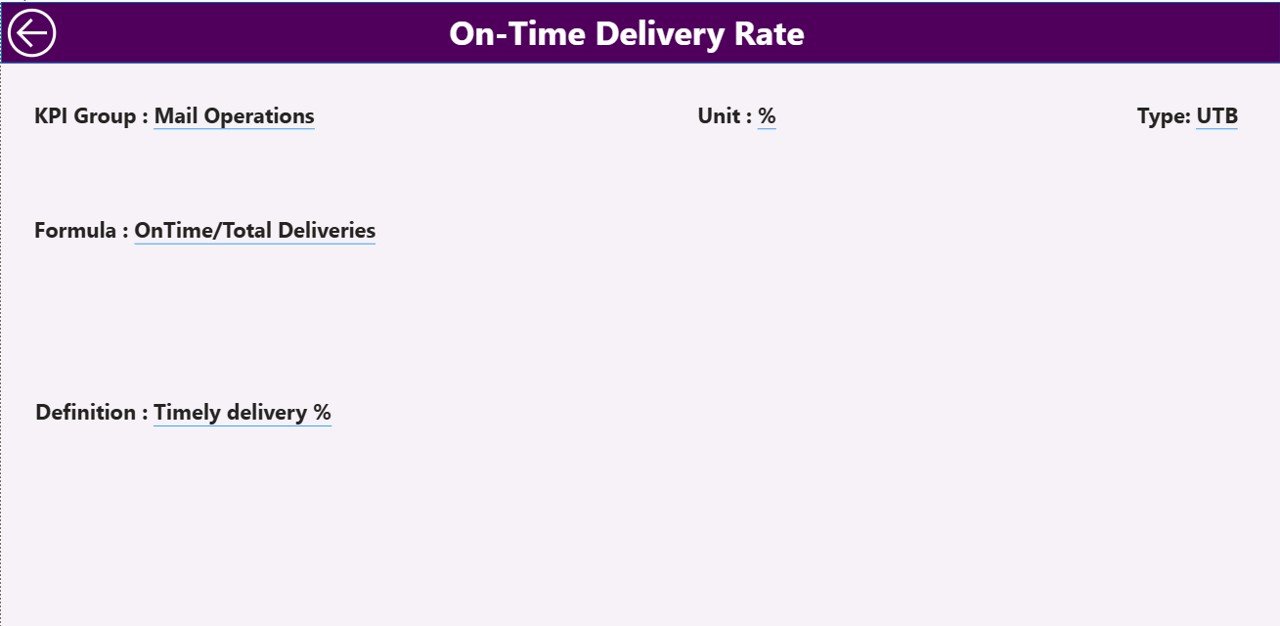
3️⃣ KPI Definition Page – Drill-Through Transparency
Hidden but accessible via drill-through.
Displays:
-
KPI Number
-
KPI Group
-
KPI Name
-
Unit
-
Formula
-
Definition
-
Type (LTB / UTB)
This ensures clarity and accountability across teams.
🛠 How to Use the Postal Services KPI Dashboard in Power BI
Using the dashboard is simple:
1️⃣ Enter actual data in the Input_Actual Excel sheet (MTD & YTD).
2️⃣ Update targets in the Input_Target sheet.
3️⃣ Maintain KPI structure in the KPI Definition sheet.
4️⃣ Refresh the Power BI file.
5️⃣ Use slicers to analyze monthly or group-level performance.
6️⃣ Drill through to review KPI logic and definitions.
Because the dashboard uses structured Excel sheets, data management remains easy and organized.
👥 Who Can Benefit from This Postal Services KPI Dashboard in Power BI
✔ National Postal Authorities
✔ Regional Postal Branch Managers
✔ Courier & Logistics Companies
✔ Operations & Delivery Managers
✔ Finance & Revenue Teams
✔ Performance Monitoring Analysts
✔ Government Logistics Departments
Whether you manage one branch or a nationwide network, this dashboard helps you track performance professionally.
Why This Dashboard Is a Must-Have for Postal Leaders
Instead of reacting after targets are missed, you identify performance gaps instantly.
Instead of manually calculating percentages, you rely on automated Power BI formulas.
Instead of reviewing static reports, you interact with dynamic visuals.
From On-Time Delivery Rate to Delivery Cost per Parcel, from Customer Complaint Ratio to Revenue per Route — every KPI becomes measurable, comparable, and actionable.
If you want faster decisions, improved accountability, reduced reporting time, and better operational control, this dashboard becomes your complete postal performance intelligence system.
Click here to read the Detailed blog post
Visit our YouTube channel to learn step-by-step video tutorials
👉 YouTube Channel – PKAnExcelExpert