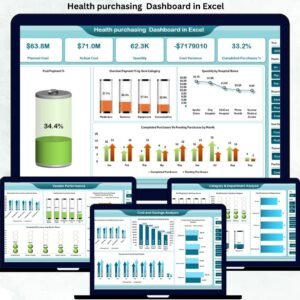
The Digital Transformation Dashboard in Excel gives leaders one centralized, interactive system to monitor budgets, risks, performance, and customer impact — all inside a single structured Excel file.
Built using Pivot Tables, Pivot Charts, slicers, and KPI cards, this dashboard converts raw data into strategic clarity.
This isn’t just reporting.
This is transformation management made simple. 🚀📊
🚀 Key Feature of Digital Transformation Dashboard in Excel
📊 5 Structured Analytical Pages
Track performance across Overview, Department, Project Category, Region, and Month analysis.
💰 Budget vs Actual Cost Monitoring
Instantly identify cost variance and prevent overspending.
📈 Completion % Tracking
Monitor project progress at department, region, and category levels.
🔐 Cybersecurity Risk Visibility
Highlight high-risk exposure before issues escalate.
⭐ Customer Experience Score Monitoring
Measure how digital initiatives impact customer satisfaction.
🧭 Left-Side Page Navigator
Switch between pages quickly and smoothly.
🎛 Dynamic Slicers
Filter by Department, Region, Project Category, Technology Type, or Month instantly.
📂 Separate Data & Support Sheets
Structured backend ensures accurate calculations.
⚙ Fully Customizable KPIs
Adapt the dashboard according to your transformation strategy.
📦 What’s Inside the Digital Transformation Dashboard in Excel
This ready-to-use dashboard includes 5 powerful pages:
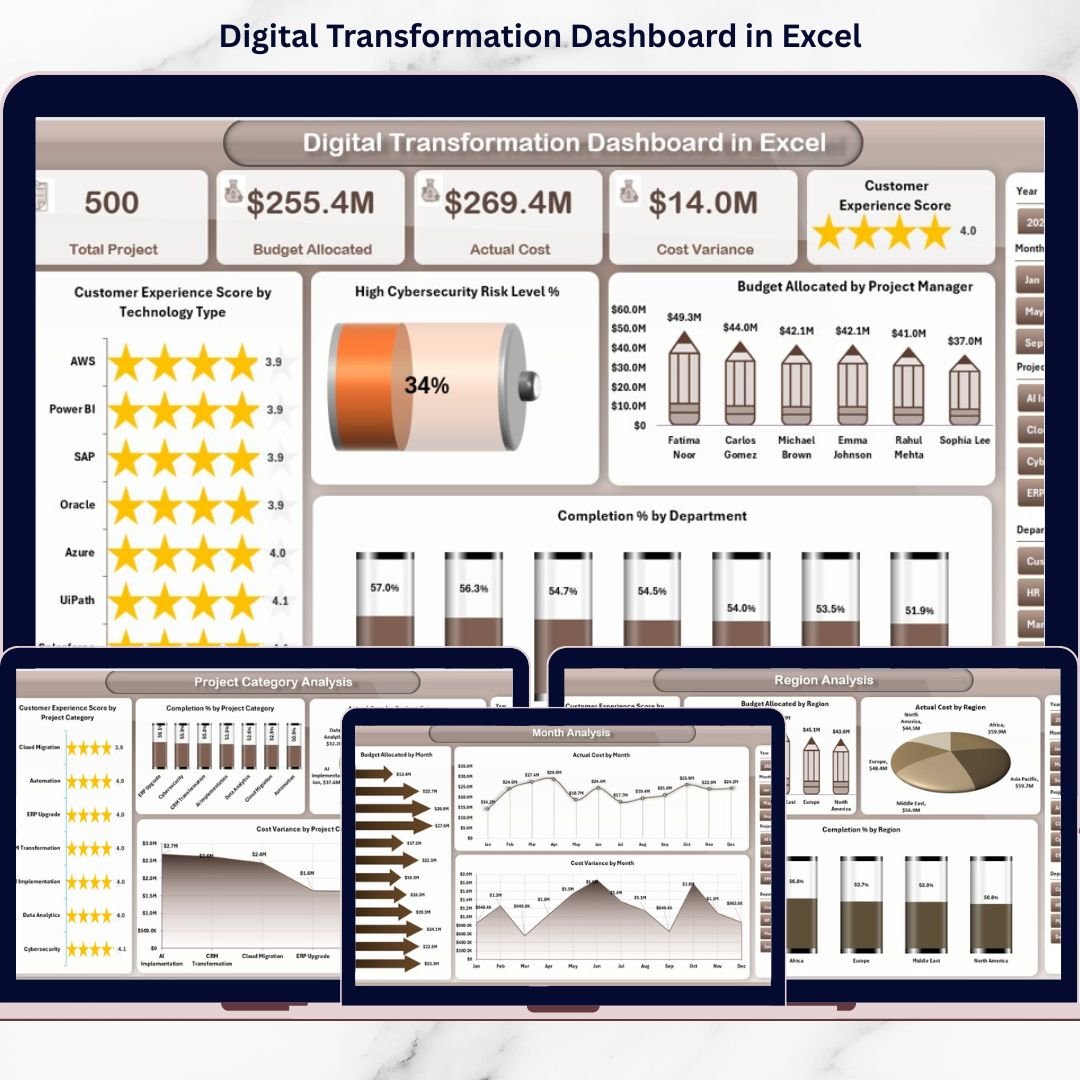
1️⃣ Overview Page – The Command Center
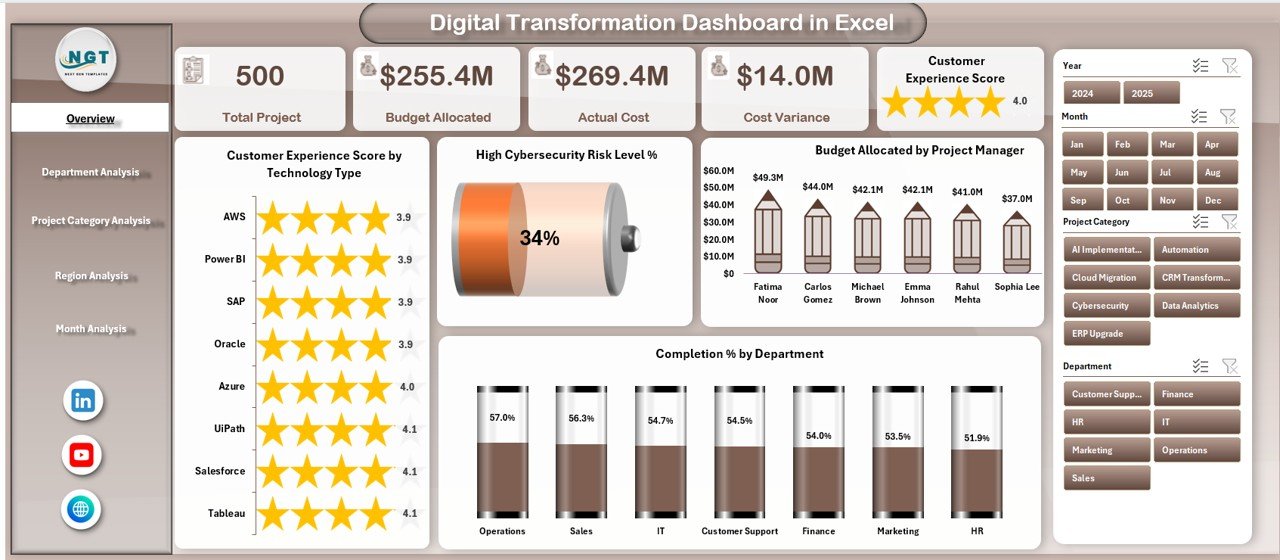
✔ 4 KPI Cards:
-
Total Budget Allocation
-
Total Actual Cost
-
Overall Completion %
-
High Cybersecurity Risk Level %
✔ 4 Interactive Charts:
-
Customer Experience Score by Technology Type
-
High Cybersecurity Risk %
-
Budget Allocation by Project Manager
-
Completion % by Department
This page gives executives instant clarity.
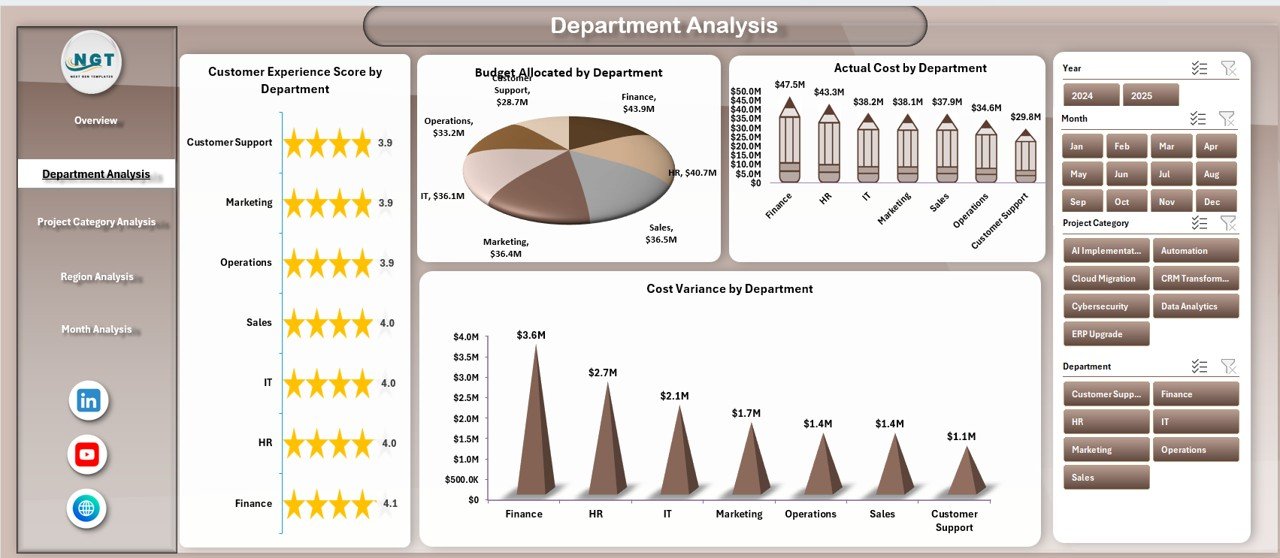
2️⃣ Department Analysis
✔ Customer Experience Score by Department
✔ Budget Allocation by Department
✔ Actual Cost by Department
✔ Cost Variance by Department
Identify which departments stay on budget and meet completion goals.
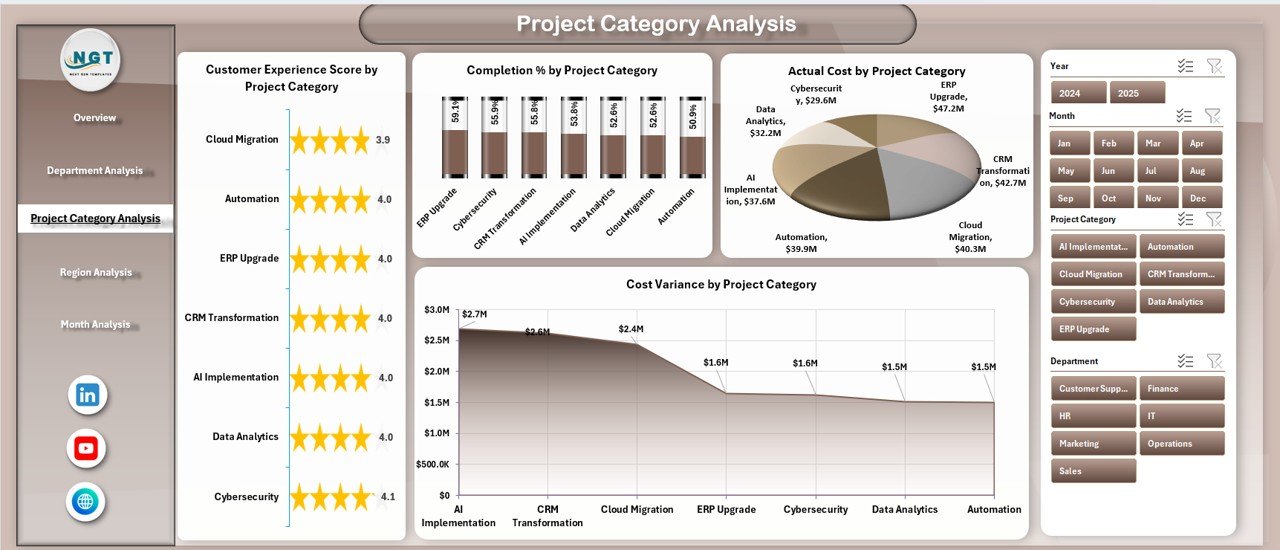
3️⃣ Project Category Analysis
✔ Customer Experience Score by Project Category
✔ Completion % by Category
✔ Actual Cost by Category
✔ Cost Variance by Category
Compare automation, cybersecurity, innovation, and system upgrade initiatives effectively.
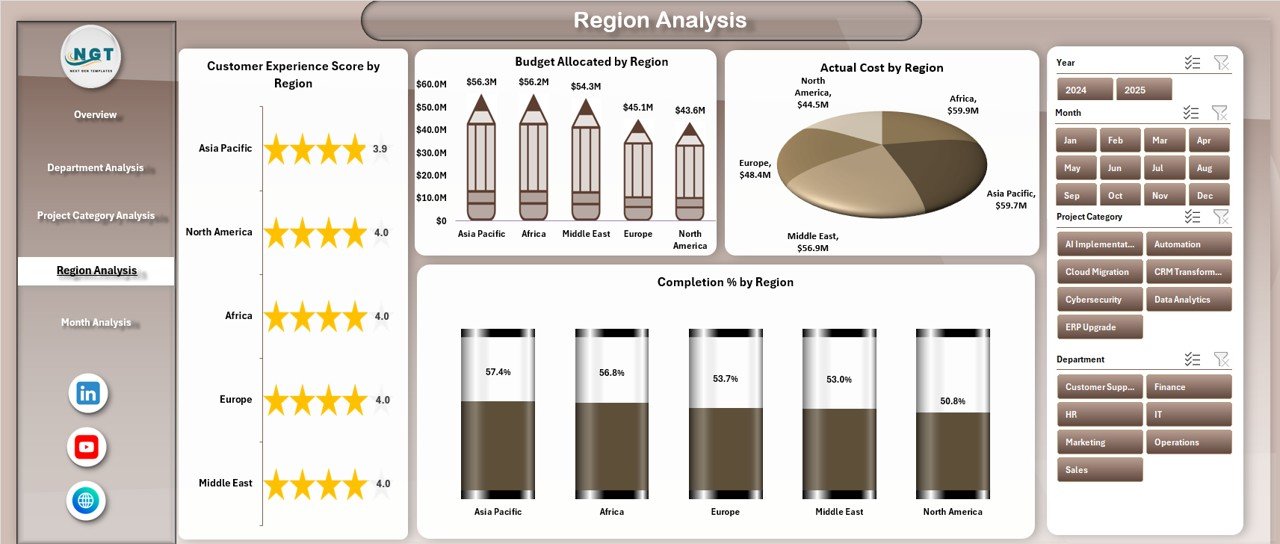
4️⃣ Region Analysis
✔ Customer Experience Score by Region
✔ Completion % by Region
✔ Actual Cost by Region
✔ Cost Variance by Region
Monitor global or multi-location transformation performance clearly.
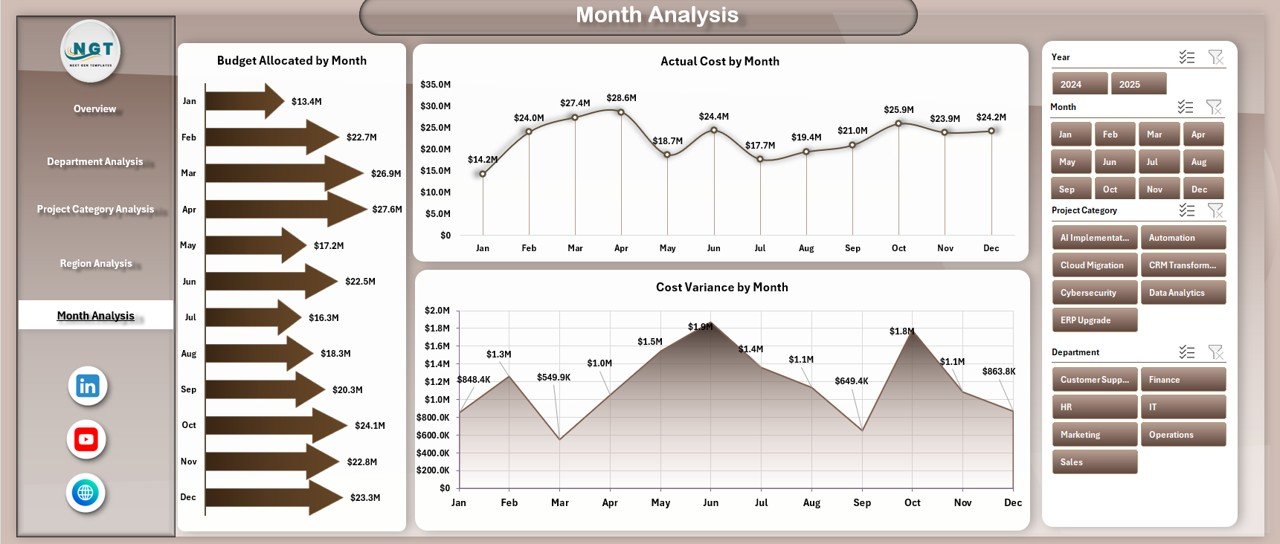
5️⃣ Month Analysis
✔ Budget Allocation by Month
✔ Actual Cost by Month
✔ Cost Variance by Month
Track monthly trends, spending spikes, and financial consistency.
🛠 How to Use the Digital Transformation Dashboard in Excel
Using this dashboard is simple:
1️⃣ Enter project data into the structured Data Sheet
2️⃣ Include budget, cost, completion %, risk level, and experience score
3️⃣ Refresh Pivot Tables
4️⃣ Use slicers to filter by department or month
5️⃣ Start with Overview page
6️⃣ Drill into category or regional analysis
7️⃣ Take action based on insights
No coding required. Just structured data and smart analysis.
👥 Who Can Benefit from This Digital Transformation Dashboard in Excel
This dashboard is perfect for:
👨💼 CIOs
📊 Digital Transformation Managers
📈 Project Managers
💰 Finance Teams
🏢 Department Heads
🧠 Strategy Consultants
🚀 Startups and Enterprises
If your organization runs digital initiatives, this dashboard becomes essential.
Why This Dashboard Improves Strategic Control
When you track:
-
Budget Allocation
-
Actual Cost
-
Cost Variance
-
Completion %
-
Cybersecurity Risk Level
-
Customer Experience Score
-
Technology Adoption
You gain:
✔ Faster executive decision-making
✔ Stronger budget control
✔ Improved accountability
✔ Reduced transformation risk
✔ Better alignment with strategic goals
Transformation stops being chaotic. It becomes measurable and manageable.
How It Drives Transformation Success
Because this dashboard combines:
Financial metrics
Operational progress
Risk indicators
Customer impact
Leaders can:
-
Allocate resources smarter
-
Identify high-performing teams
-
Reduce risk exposure
-
Improve customer satisfaction
-
Align projects with long-term strategy
Clear data drives successful transformation.
Click here to read the Detailed blog post
Visit our YouTube channel to learn step-by-step video tutorials
YouTube Channel