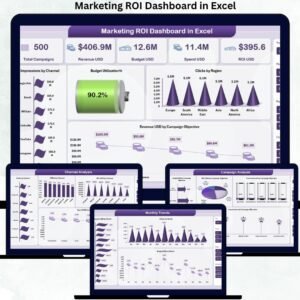
The Partner Alliances Dashboard in Excel is a ready-to-use, interactive performance tracking system that centralizes revenue, leads, contract value, active alliances, and customer satisfaction into one powerful Excel file.
Built using Pivot Tables, Pivot Charts, KPI cards, and slicers, this dashboard transforms raw data into strategic clarity.
Stop guessing. Start optimizing your partner ecosystem. 🚀📊
🚀 Key Feature of Partner Alliances Dashboard in Excel
📊 5 Interactive Analytical Pages
Analyze partner performance from multiple perspectives.
🎯 KPI Cards for Instant Insights
Track Active Alliance %, Total Revenue, Contract Value, and Satisfaction Score instantly.
📈 Revenue by Account Manager
Evaluate performance across alliance managers.
🏢 Partner Type & Tier Analysis
Compare Resellers, Technology Partners, Strategic Partners, and Tier levels.
🌍 Industry & Regional Insights
Identify high-growth industries and revenue-driving countries.
📅 Month-wise Trend Tracking
Monitor growth patterns and seasonal performance.
🎛 Dynamic Slicers (Filters)
Filter by Month, Region, Account Manager, Partner Type, and Industry instantly.
📂 Structured Data & Support Sheets
Clean backend ensures smooth reporting.
🧭 Left-Side Page Navigator
Move between dashboard pages quickly.
📦 What’s Inside the Partner Alliances Dashboard in Excel
This ready-to-use dashboard includes:
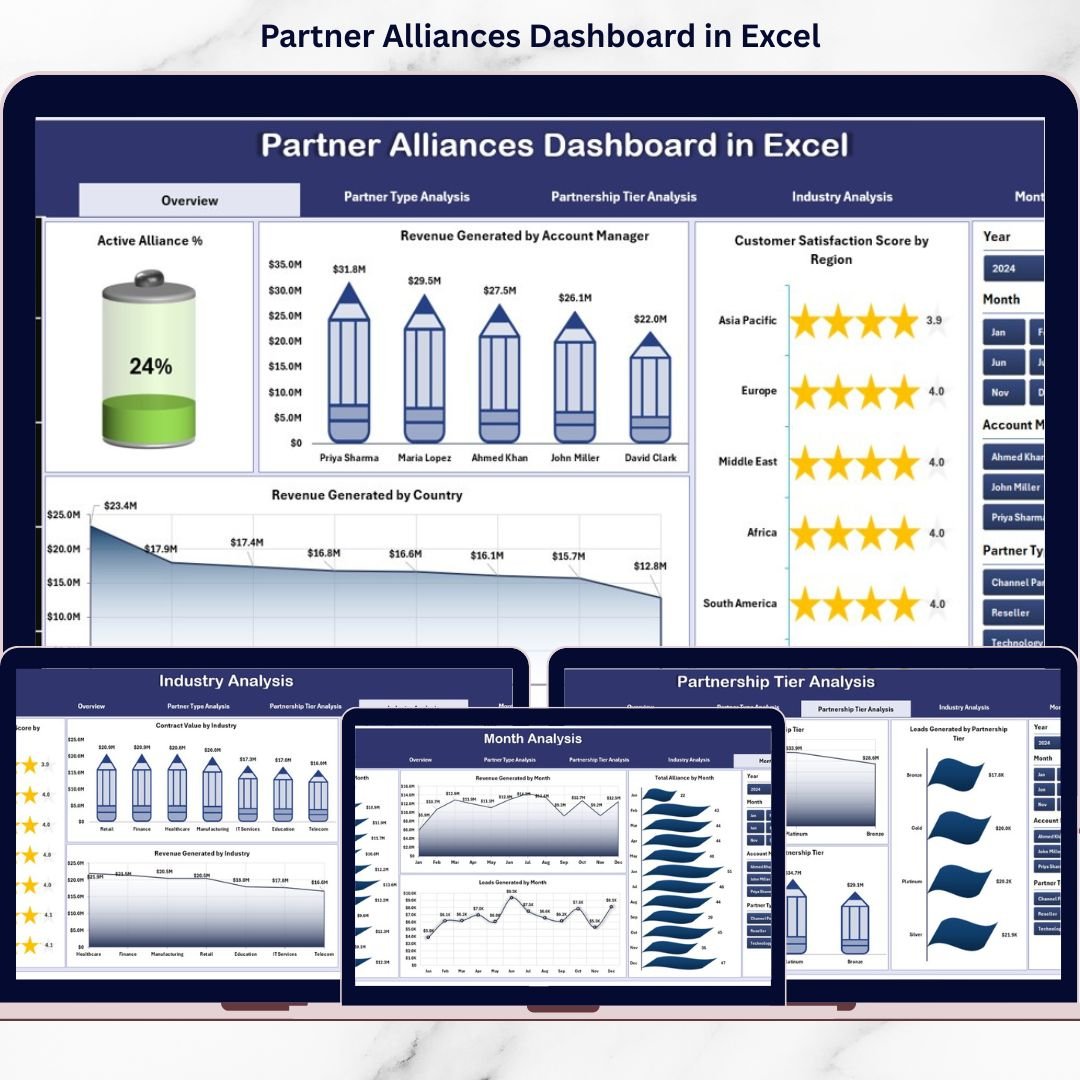
1️⃣ Overview Page – The Command Center
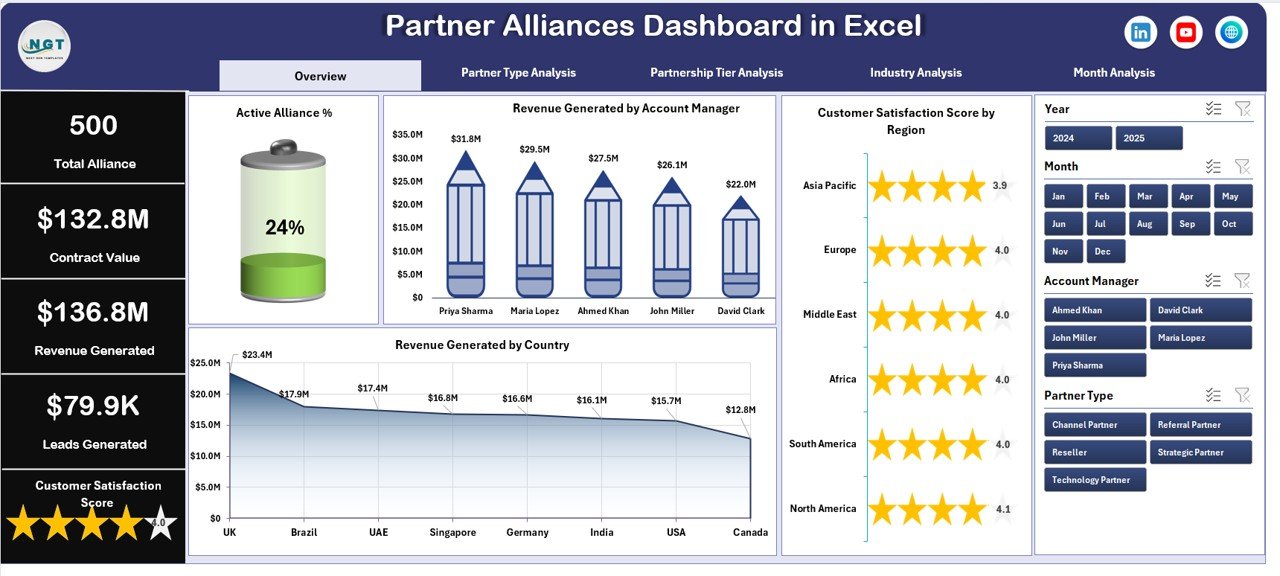
✔ 4 KPI Cards:
-
Active Alliance %
-
Total Revenue Generated
-
Average Customer Satisfaction Score
-
Total Contract Value
✔ 4 Pivot Charts:
-
Active Alliance %
-
Revenue by Account Manager
-
Satisfaction Score by Region
-
Revenue by Country
Get a complete snapshot within seconds.
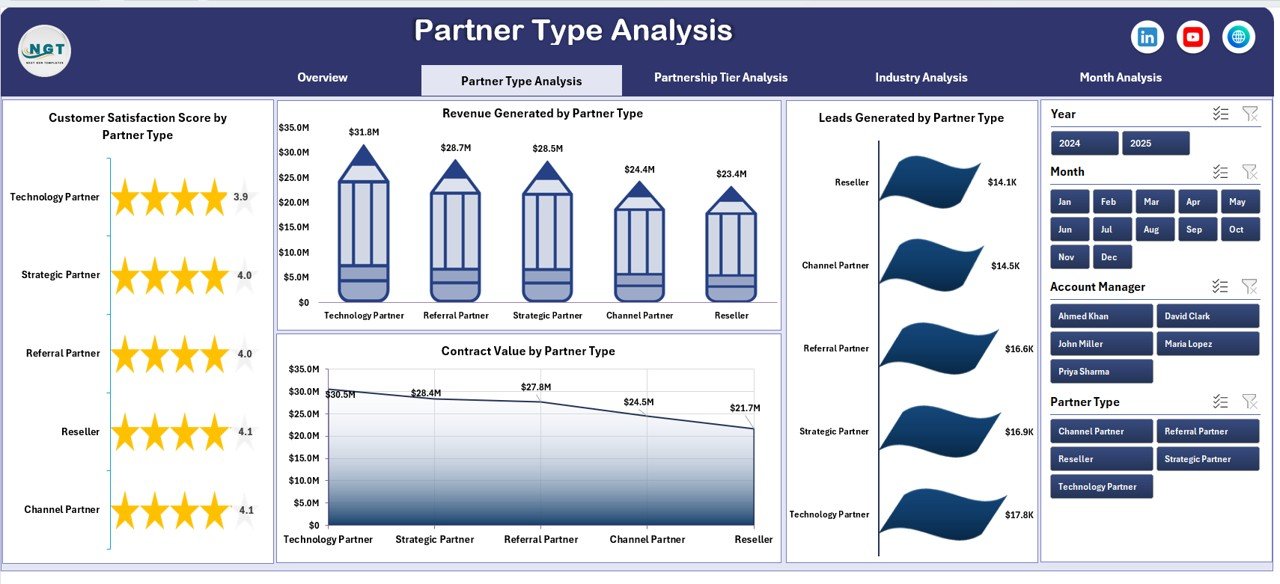
2️⃣ Partner Type Analysis
✔ Revenue by Partner Type
✔ Satisfaction Score by Partner Type
✔ Leads Generated by Partner Type
✔ Contract Value by Partner Type
Identify which partner categories drive revenue and growth.
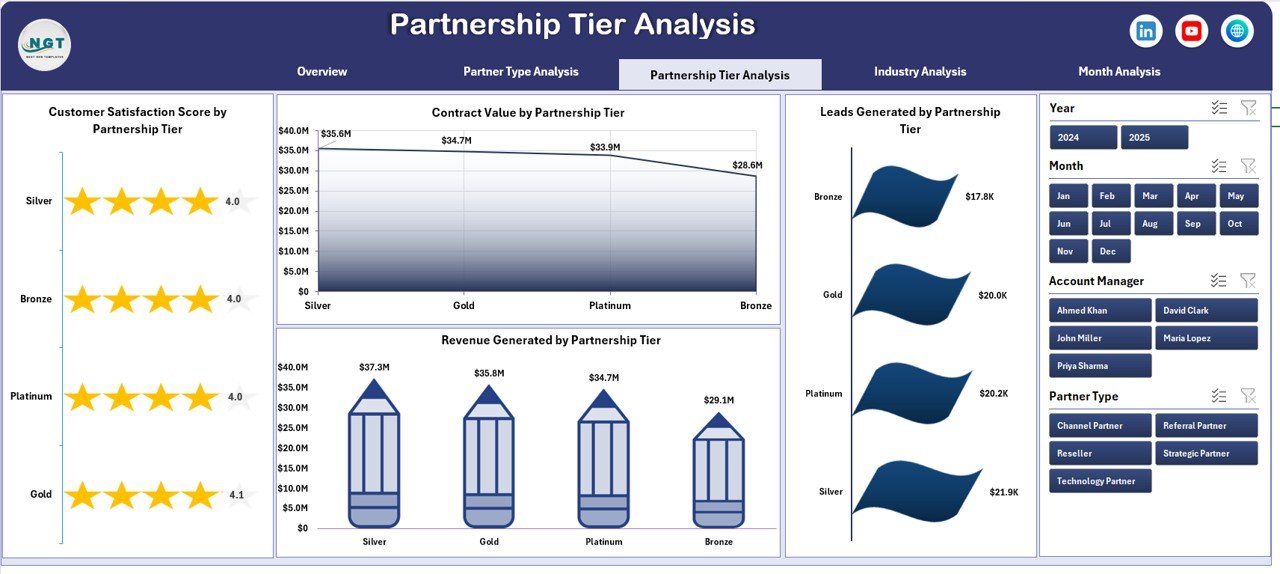
3️⃣ Partnership Tier Analysis
✔ Revenue by Tier (Platinum, Gold, Silver, Bronze)
✔ Satisfaction by Tier
✔ Leads by Tier
✔ Contract Value by Tier
Reward high-performing tiers and improve lower-tier engagement.
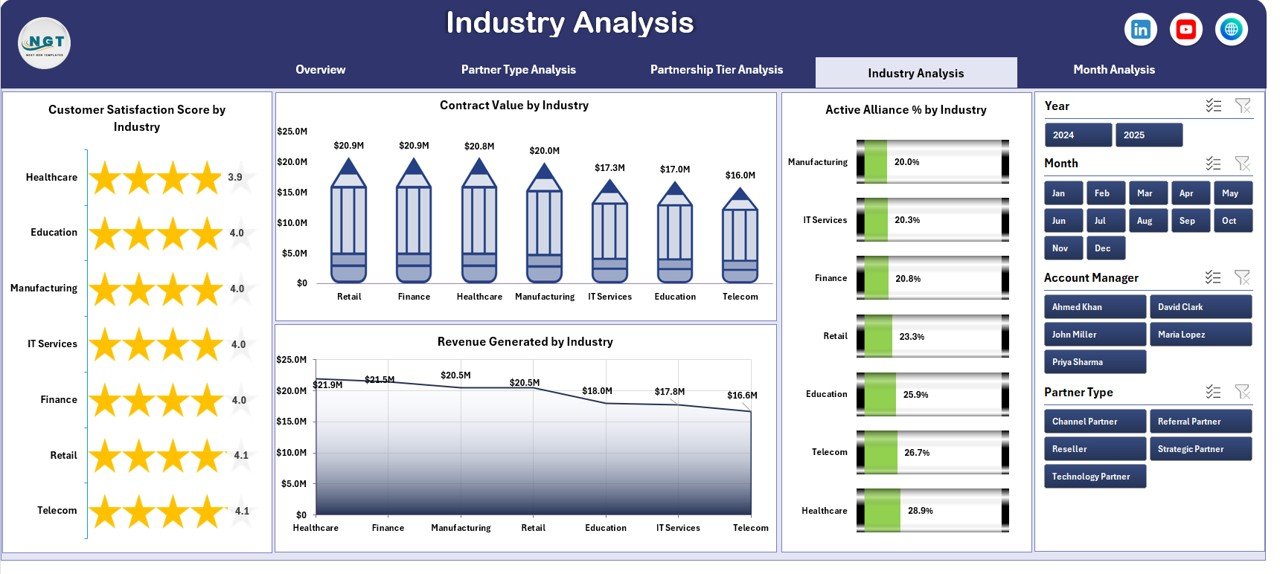
4️⃣ Industry Analysis
✔ Revenue by Industry
✔ Satisfaction by Industry
✔ Contract Value by Industry
✔ Active Alliance % by Industry
Strengthen focus on high-performing sectors.
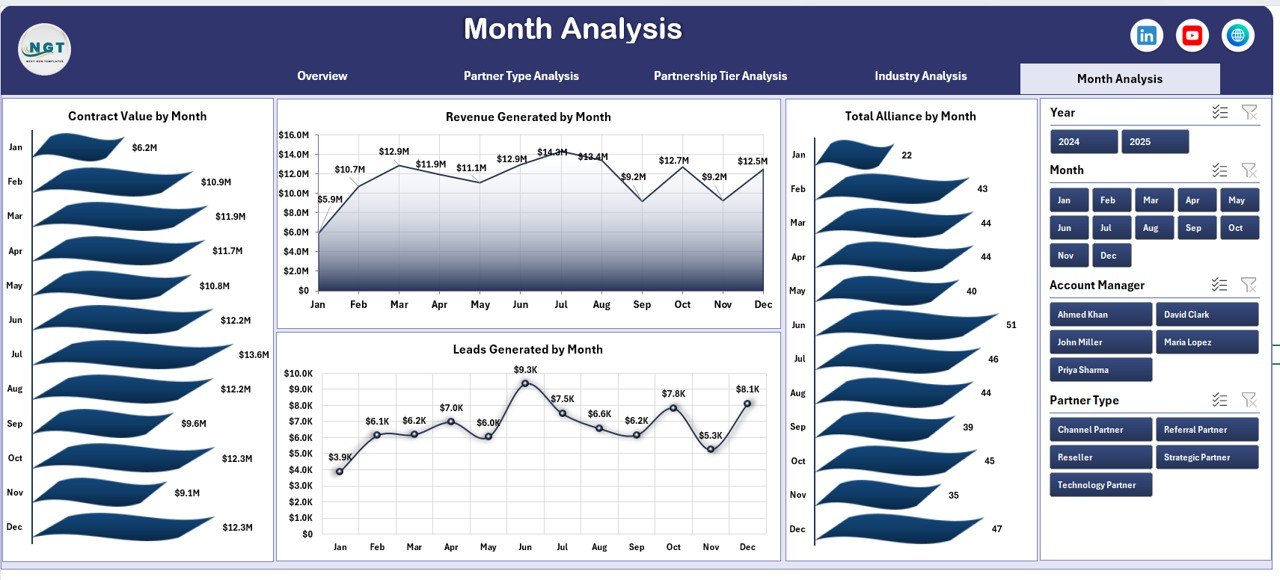
5️⃣ Month Analysis
✔ Revenue by Month
✔ Total Alliances by Month
✔ Contract Value by Month
✔ Leads by Month
Track performance trends and growth patterns clearly.
🛠 How to Use the Partner Alliances Dashboard in Excel
Using this dashboard is simple:
1️⃣ Enter data in the structured Data Sheet
2️⃣ Include revenue, leads, contract value, and satisfaction score
3️⃣ Refresh Pivot Tables
4️⃣ Use slicers to filter by month, region, or partner type
5️⃣ Start with Overview page
6️⃣ Drill into Tier, Industry, or Month analysis
7️⃣ Take action based on insights
No coding required. No complex software needed.
👥 Who Can Benefit from This Partner Alliances Dashboard in Excel
This dashboard is ideal for:
🤝 Business Development Teams
📊 Alliance Managers
📈 Sales Leaders
🏢 Strategic Partnership Teams
🌍 Channel Sales Managers
👔 Executives & Directors
If your business manages partnerships, this dashboard becomes essential.
Why This Dashboard Improves ROI
When you track:
💰 Revenue
📄 Contract Value
📈 Leads Generated
⭐ Customer Satisfaction
📊 Active Alliance %
You gain:
✔ Clear visibility into partner performance
✔ Faster decision-making
✔ Better incentive planning
✔ Smarter resource allocation
✔ Improved accountability
✔ Stronger growth strategy
Partnerships stop being guesswork. They become measurable assets.
How It Supports Strategic Growth
This dashboard helps you:
-
Identify top-performing partner types
-
Reward high-value tiers
-
Optimize account manager performance
-
Target profitable industries
-
Monitor monthly revenue trends
-
Detect underperforming regions early
Clear data. Stronger alliances. Higher growth.
Click here to read the Detailed blog post
Visit our YouTube channel to learn step-by-step video tutorials
YouTube Channel