


The Seed and Fertilizer Manufacturing Dashboard never slows down. Demand shifts with seasons. Raw material prices fluctuate without warning. Production targets change frequently. Meanwhile, management expects accurate numbers — instantly.
If you still rely on scattered Excel files and manual reports, you are missing critical insights.
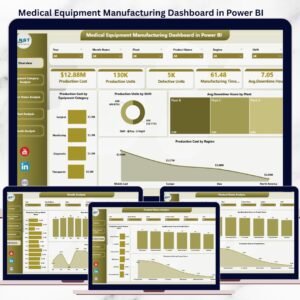
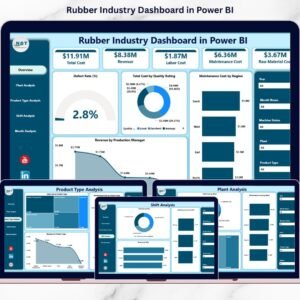
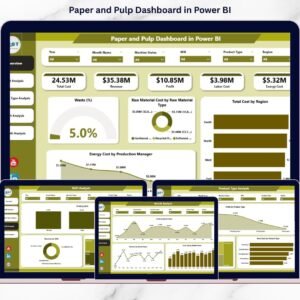
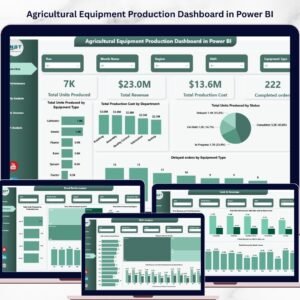
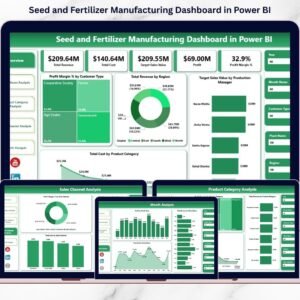
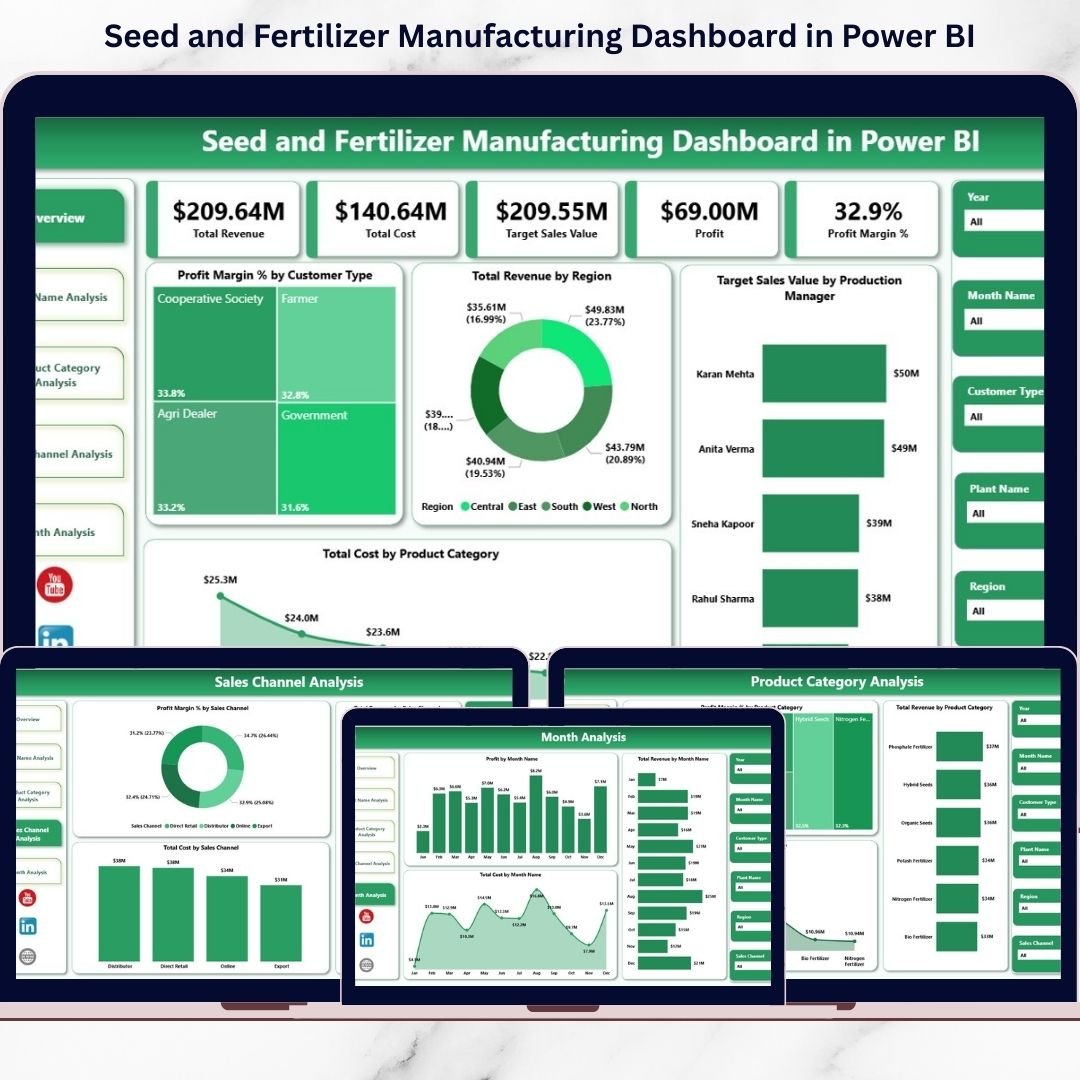
Now imagine tracking Total Revenue, Total Cost, Profit, Profit Margin %, Plant Performance, Product Categories, Sales Channels, and Monthly Trends — all in one powerful, interactive Power BI dashboard.
That is exactly what the Seed and Fertilizer Manufacturing Dashboard in Power BI delivers.
This ready-to-use business intelligence solution transforms raw operational data into dynamic visuals, KPI cards, and drill-down reports. As a result, you gain complete control over your manufacturing performance and make smarter strategic decisions.
Stop reacting. Start leading with data.
🚀 Key Features of Seed and Fertilizer Manufacturing Dashboard in Power BI
📊 5 Fully Designed Analytical Pages
🎯 Interactive KPI Cards for quick performance review
🏭 Plant-Level Performance Tracking
🌿 Product Category Profitability Analysis
🌍 Region-Wise Revenue Monitoring
🛒 Sales Channel Comparison
📅 Monthly Trend Analysis
🔎 Smart Slicers for instant filtering
⚡ Real-Time Data Refresh
📤 Easy Sharing with Management Teams
Built in Power BI, this dashboard allows dynamic filtering, drill-through capability, and seamless data refresh — giving you real-time insights whenever you need them.
📦 What’s Inside the Seed and Fertilizer Manufacturing Dashboard in Power BI
This dashboard includes 5 powerful pages designed for complete business visibility:
1️⃣ Overview Page
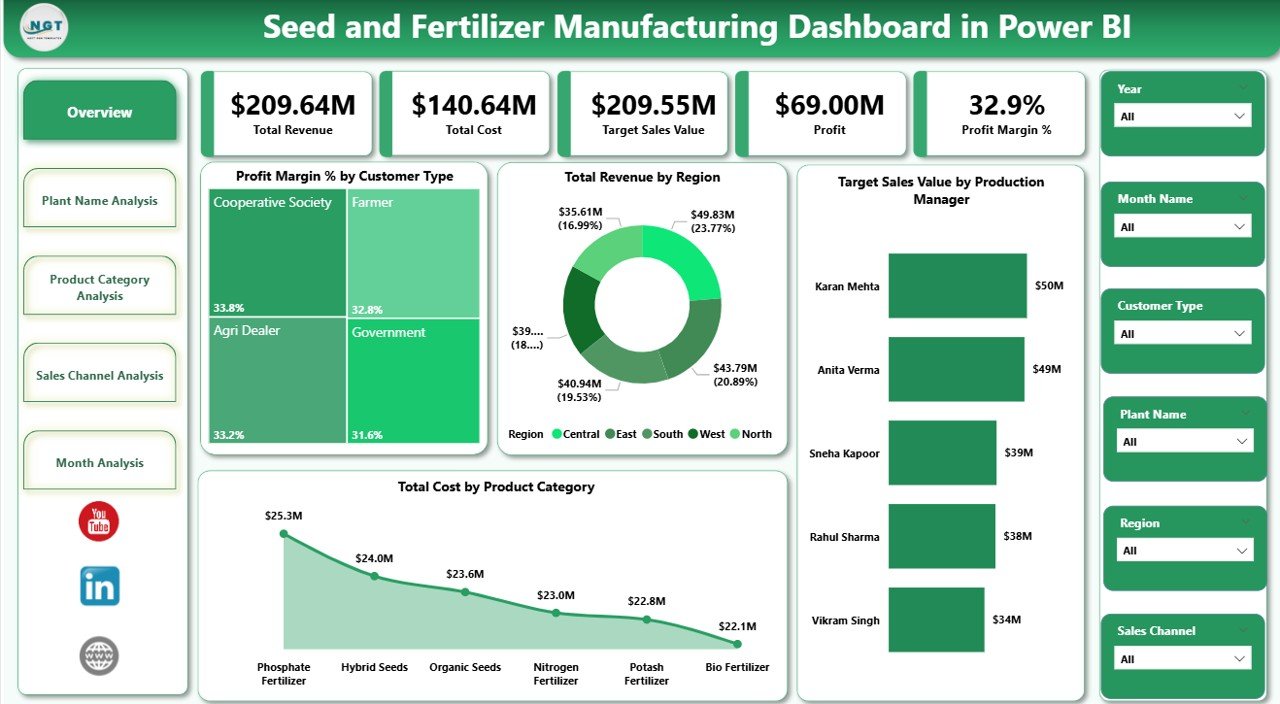
Your command center.
It displays:
-
Profit Margin % by Customer Type
-
Total Revenue by Region
-
Target Sales Value by Production Manager
-
Total Cost by Product Category
With slicers for Month, Region, Customer Type, Product Category, and Production Manager, you can instantly drill down into performance gaps.
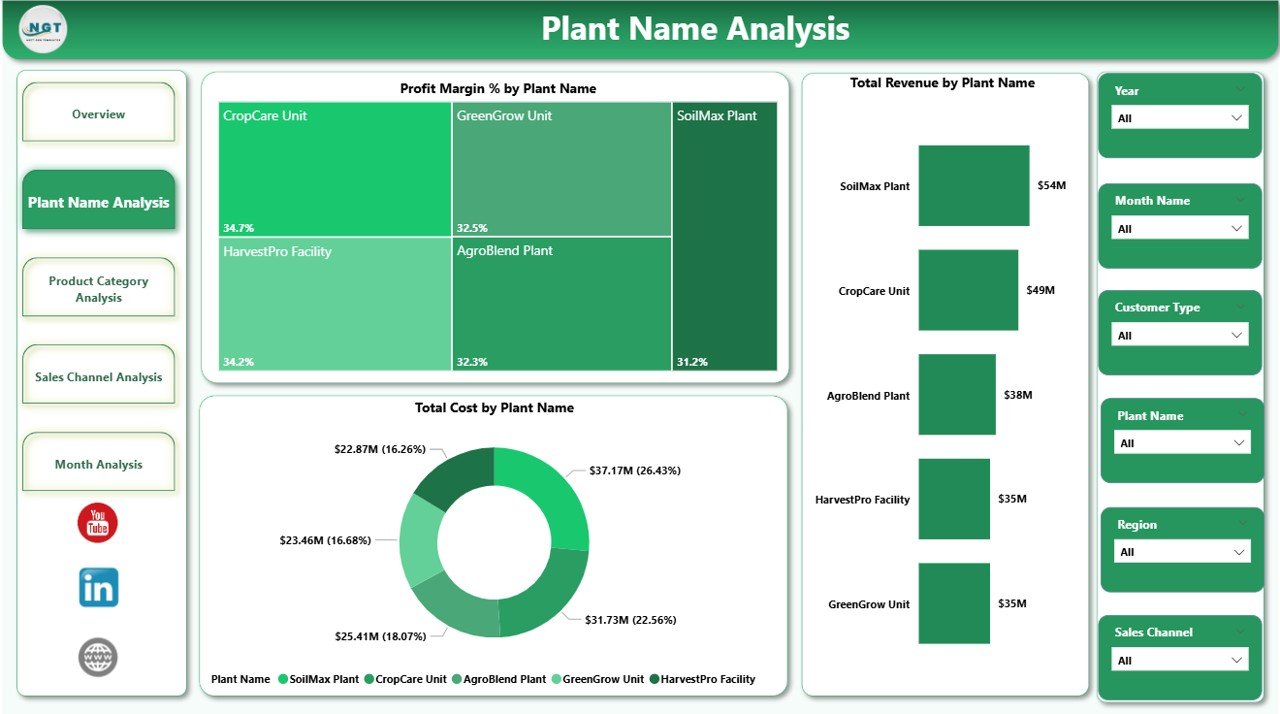
2️⃣ Plant Name Analysis
Compare multiple production plants easily.
Track:
-
Profit Margin % by Plant
-
Total Revenue by Plant
-
Total Cost by Plant
Identify high-performing plants and detect cost inefficiencies quickly.
3️⃣ Product Category Analysis
Monitor profitability across:
-
Hybrid Seeds
-
Organic Fertilizers
-
Chemical Fertilizers
-
Micronutrients
-
Crop Protection Products
See which products drive maximum revenue and which require pricing adjustments.
4️⃣ Sales Channel Analysis
Evaluate performance across:
-
Distributors
-
Dealers
-
Direct Sales
-
Online Sales
-
Retail Stores
Compare revenue, cost, and profit margin to optimize your sales strategy.
5️⃣ Month Analysis
Seasonality matters in agriculture.
Track:
-
Profit by Month
-
Revenue by Month
-
Cost by Month
Identify peak demand months and plan production accordingly.
🛠 How to Use the Seed and Fertilizer Manufacturing Dashboard in Power BI
Using this dashboard is simple:
1️⃣ Import or connect your operational data
2️⃣ Update monthly revenue, cost, and target figures
3️⃣ Refresh the dashboard
4️⃣ Use slicers to explore insights instantly
No advanced Power BI expertise required. The interface is clean, intuitive, and business-focused.
👥 Who Can Benefit from This Seed and Fertilizer Manufacturing Dashboard in Power BI
🌾 Seed Manufacturers
🧪 Fertilizer Producers
🌿 Agrochemical Companies
🏭 Plant Managers
📊 Regional Sales Managers
💰 Finance Teams
⚙ Operations Heads
If you manage production, sales, cost, or profitability, this dashboard becomes your daily performance monitoring tool.
By using this dashboard, you:
✔ Identify high-margin product categories
✔ Detect cost overruns at plant level
✔ Compare regional revenue performance
✔ Optimize sales channel profitability
✔ Track production manager targets
✔ Monitor seasonal trends
✔ Improve forecasting accuracy
Instead of preparing manual reports, you focus on improving operations and increasing profit.
This is not just a Power BI file. It is a complete manufacturing intelligence system designed specifically for agricultural businesses.
If you want better visibility, stronger cost control, and higher profitability — this dashboard gives you the competitive advantage.