
Procurement costs can quietly eat into your company’s profit. One delayed shipment, one unchecked category spend, or one ignored variance can cost thousands. But what if you could track everything — total spend, budget variance, supplier lead time, delayed orders, and regional performance — in one powerful, interactive system?
That is exactly what the Procurement Spend Analysis Dashboard in Power BI is designed to do.
This ready-to-use Power BI solution transforms your raw procurement data into intelligent, visual insights. Instead of juggling multiple Excel files and manual reports, you get one centralized dashboard that gives you complete control over procurement performance.
Whether you are a Procurement Manager, Finance Head, or Business Owner, this dashboard helps you reduce cost, improve vendor accountability, and make smarter purchasing decisions — faster.
🚀 Key Features of Procurement Spend Analysis Dashboard in Power BI
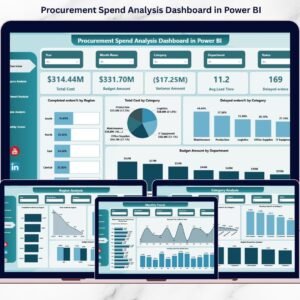
✅ Interactive Overview Page – Instantly monitor Total Cost, Budget Amount, Variance, Average Lead Time, and Delayed Orders in one snapshot.
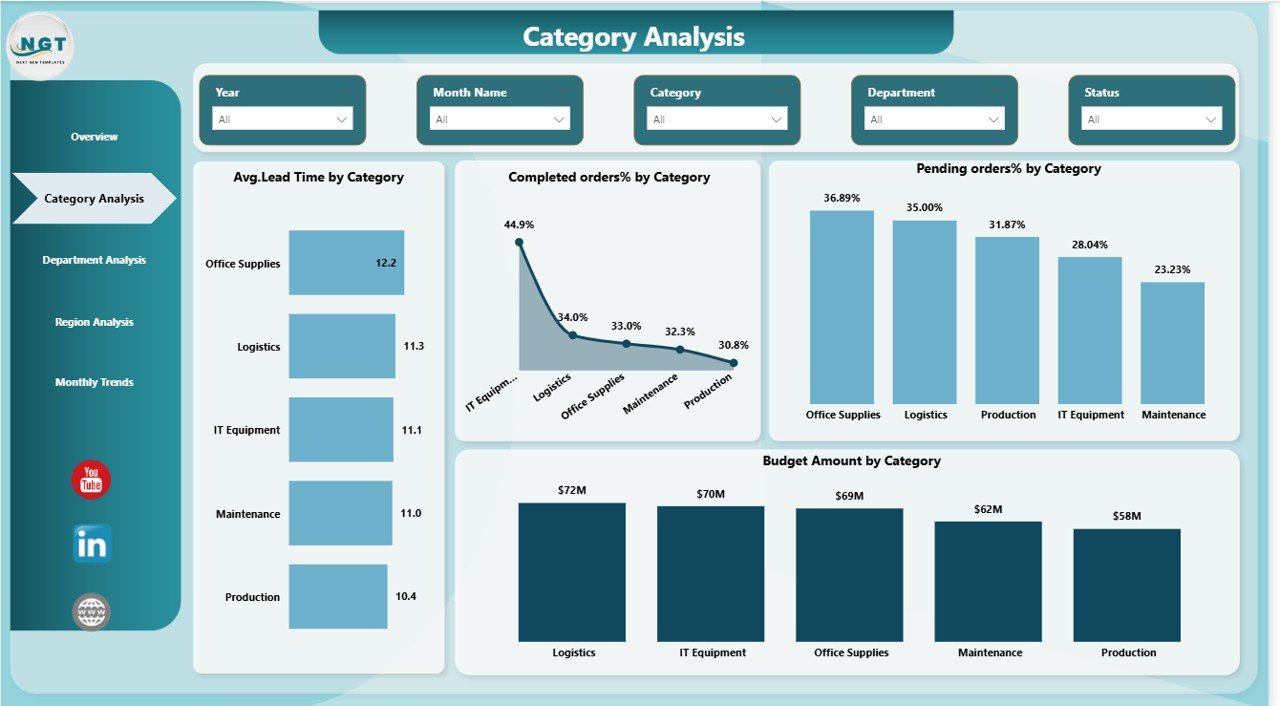
📊 Category-Level Analysis – Identify high-spend categories, pending orders %, and average lead time by category.
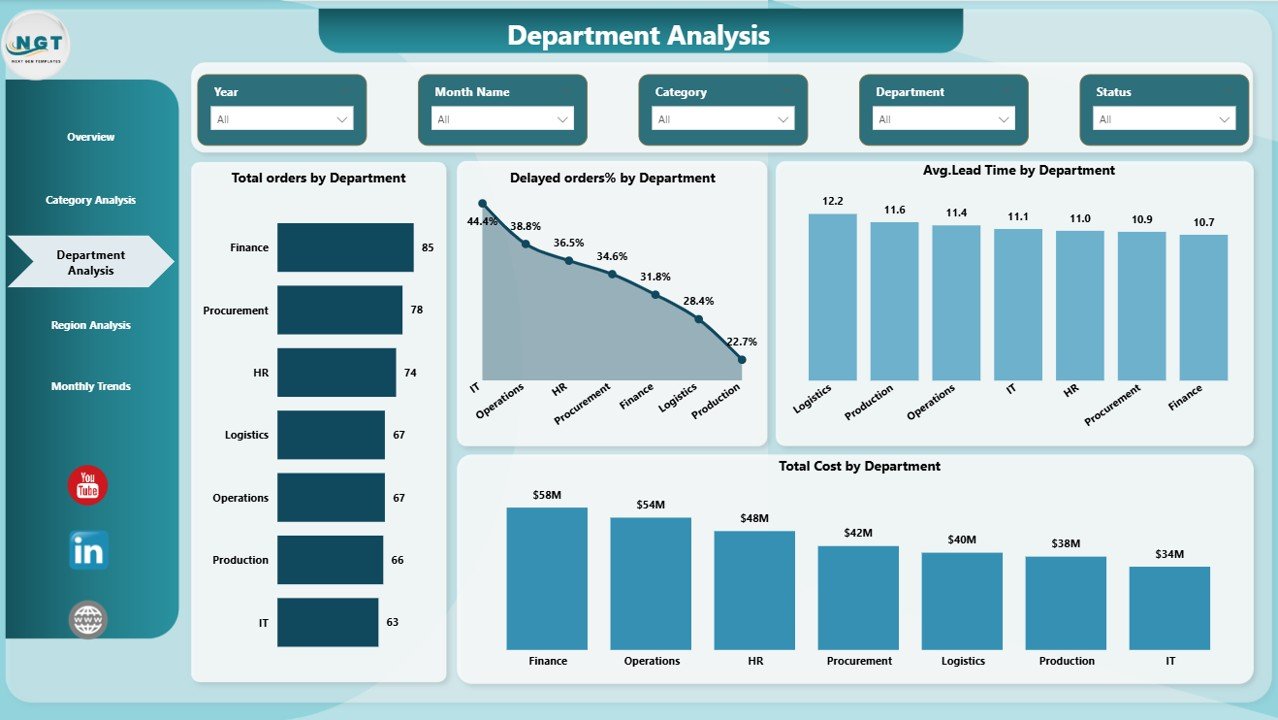
🏢 Department Insights – Compare total orders, cost, and delays department-wise for better accountability.
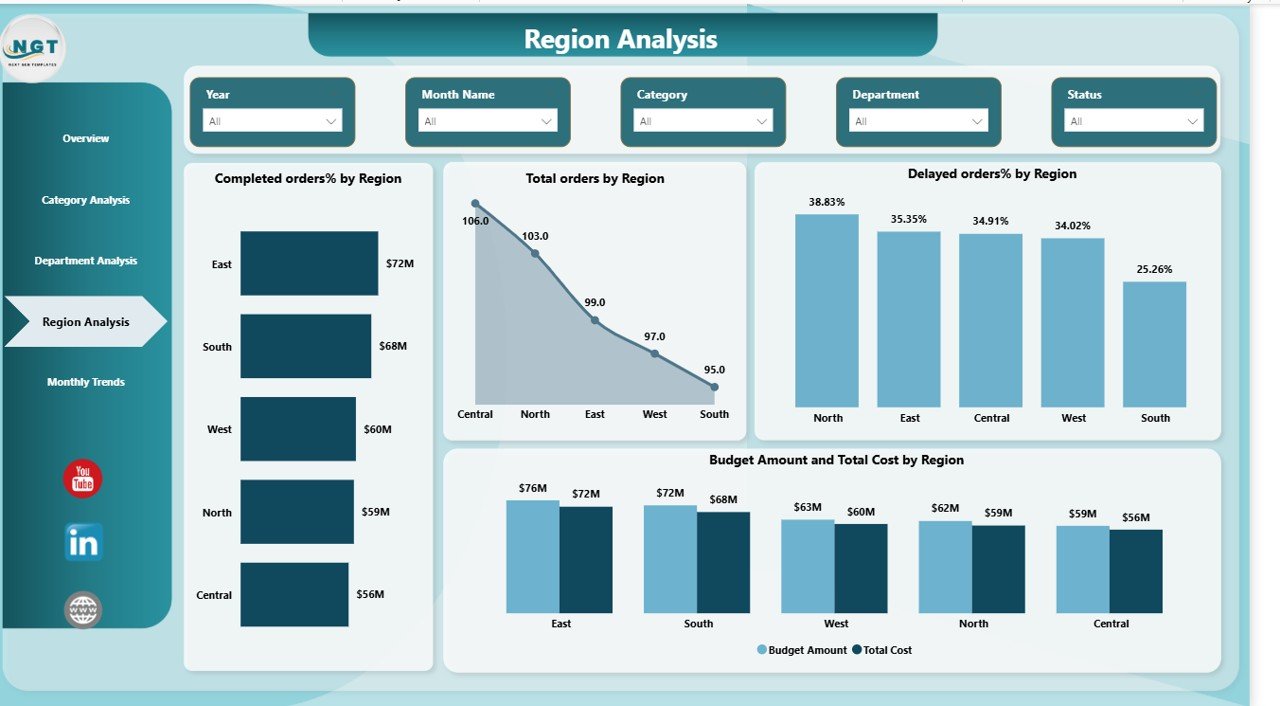
🌍 Regional Performance Tracking – Analyze procurement efficiency across different regions.
📅 Monthly Trend Analysis – Track cost patterns, lead time trends, and seasonal procurement fluctuations.
🎯 Powerful KPI Cards – Monitor critical metrics like Completed Orders %, Pending Orders %, and Variance Amount.
🔎 Dynamic Slicers & Filters – Drill down into data instantly without technical expertise.
⚡ Real-Time Decision Support – Identify overspending and supplier delays immediately.

📦 What’s Inside the Procurement Spend Analysis Dashboard?
When you download this product, you receive:
✔ A fully designed Power BI (.pbix) file
✔ 5 interactive dashboard pages
✔ Pre-built KPI calculations
✔ Clean data model structure
✔ Ready-to-use visual reports
✔ Dynamic slicers for filtering by category, department, region, and month
✔ Structured layout for professional presentations
Each page is carefully designed to provide clarity, speed, and decision-making power.
The 5 dashboard pages include:
1️⃣ Overview Page – A management-level snapshot showing Total Cost, Budget, Variance, Lead Time, and Delayed Orders.
2️⃣ Category Analysis – Deep insights into category-wise performance, lead time, and pending orders.
3️⃣ Department Analysis – Identify which departments drive the most spend and delays.
4️⃣ Region Analysis – Compare regional procurement efficiency and budget usage.
5️⃣ Monthly Trends – Track performance improvement or decline month by month.
🛠 How to Use the Procurement Spend Analysis Dashboard?
Using this dashboard is simple and user-friendly:
1️⃣ Open the Power BI file.
2️⃣ Connect or update your procurement dataset (Excel, ERP, SQL, etc.).
3️⃣ Refresh the data.
4️⃣ Use slicers to filter by department, category, region, or month.
5️⃣ Review KPI cards and visual charts.
6️⃣ Identify performance gaps and take corrective action.
No advanced coding is required. Once set up, even non-technical users can navigate the dashboard easily.
You can also integrate it with ERP systems for automatic updates, ensuring real-time procurement tracking.
👥 Who Can Benefit from This Procurement Spend Analysis Dashboard?
This dashboard is ideal for:
✔ Procurement Managers
✔ Finance Teams
✔ CFOs
✔ Supply Chain Managers
✔ Operations Heads
✔ Business Owners
✔ Regional Managers
If your organization wants better cost control, improved supplier performance, and transparent procurement reporting, this dashboard is a must-have tool.
It helps teams shift from reactive procurement management to proactive strategic planning.
Instead of discovering issues after budget overruns happen, you identify problems early and act immediately.
Why This Dashboard Is a Game-Changer
Procurement is not just about purchasing — it directly impacts profit margins. Even a 2–3% reduction in procurement inefficiency can significantly improve bottom-line performance.
This dashboard gives you:
• Full visibility
• Cost transparency
• Supplier performance monitoring
• Department accountability
• Data-driven strategy
If you want to stop overspending, reduce delays, and improve procurement efficiency, this Power BI dashboard is the smartest investment you can make today.
Click here to read the Detailed blog post
Watch the step-by-step video tutorial: