
Knowledge is one of the most powerful assets in any organization—but it is also one of the easiest to lose. When employees leave, processes change, or documentation is incomplete, critical organizational knowledge disappears silently. This is exactly why the Knowledge Preservation KPI Dashboard in Power BI is a must-have solution for modern organizations that want to protect institutional knowledge, ensure continuity, and drive smarter decisions 📊.
This ready-to-use Power BI dashboard helps you track, measure, and analyze how effectively your organization captures, transfers, and retains knowledge. Instead of relying on scattered Excel files, emails, and undocumented practices, you get a centralized, visual, and data-driven system to monitor knowledge preservation performance in real time.
Designed with clarity, usability, and scalability in mind, this dashboard empowers HR teams, L&D professionals, process owners, and leadership teams to identify risks early, close knowledge gaps, and build long-term organizational resilience.
🔑 Key Features of Knowledge Preservation KPI Dashboard in Power BI
🚀 Centralized Knowledge KPI Tracking
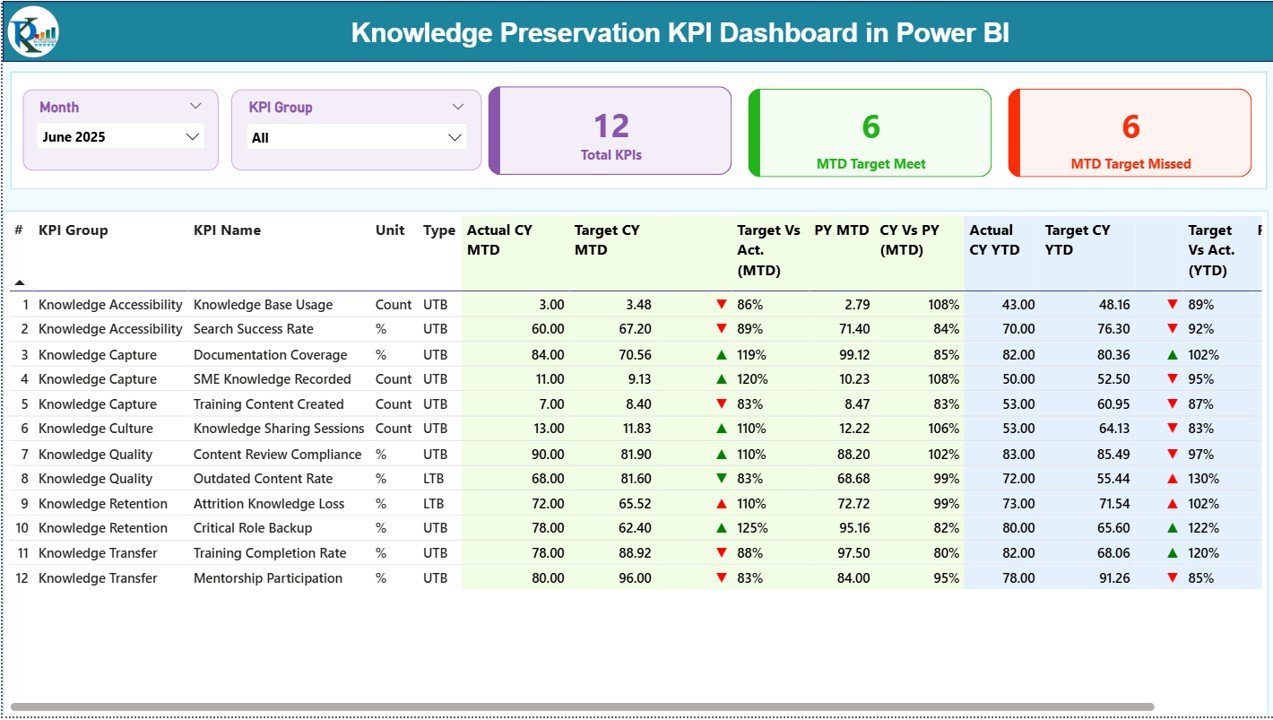
Monitor all knowledge preservation KPIs in one interactive Power BI dashboard.
📅 MTD & YTD Performance Monitoring
Track month-to-date and year-to-date performance side by side for better clarity.
🎯 Target vs Actual Analysis
Instantly identify KPIs that meet targets and those that need attention.
📈 Previous Year Comparison
Benchmark current performance against previous year values to spot trends.
🎛️ Interactive Slicers
Filter data easily by Month and KPI Group for focused analysis.
🚦 Visual Status Indicators
Red ▼ and Green ▲ icons highlight performance gaps instantly.
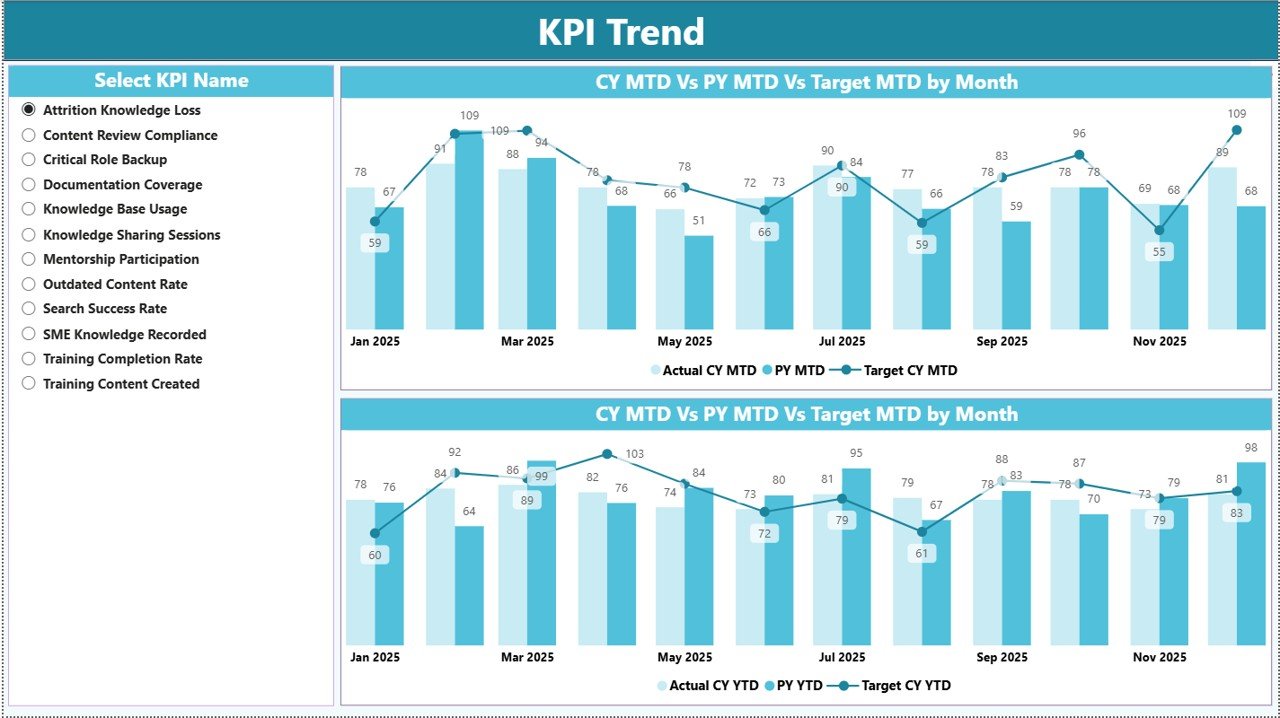
📊 Trend Analysis Charts
Analyze KPI trends over time using MTD and YTD combo charts.
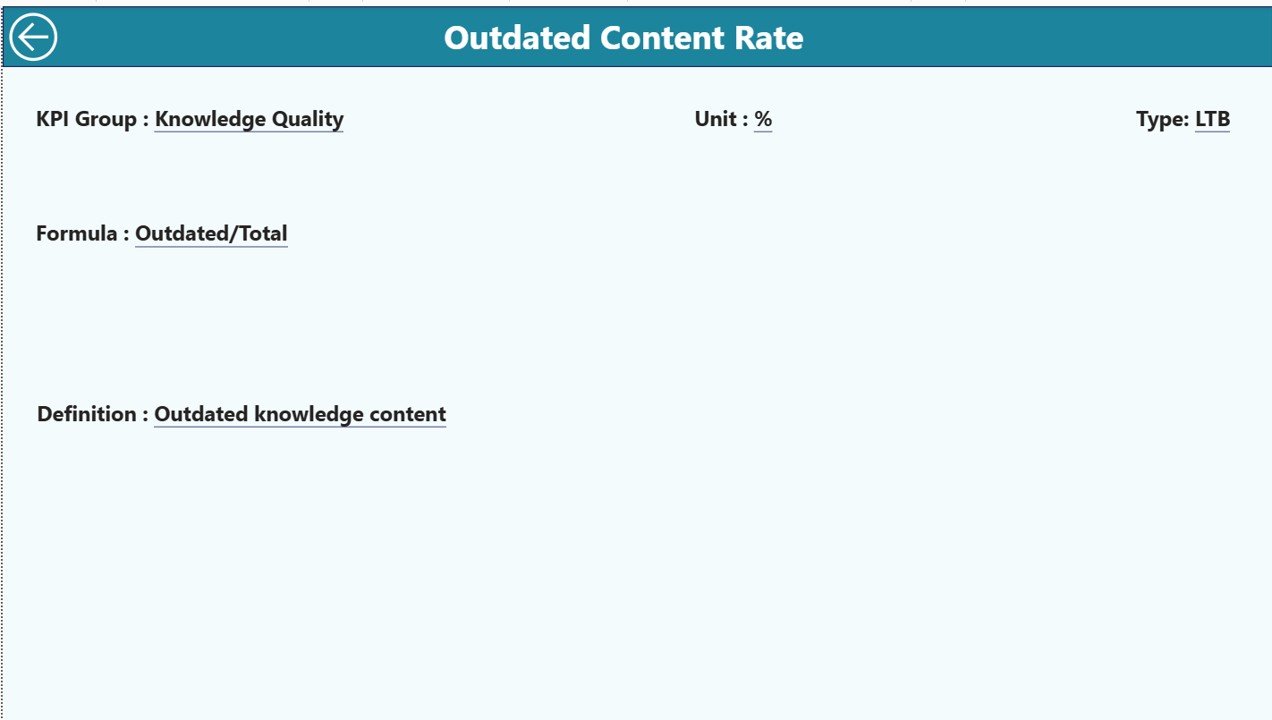
🧩 Drill-Through KPI Definitions
Access KPI formulas and definitions directly from the dashboard.
📦 What’s Inside the Knowledge Preservation KPI Dashboard
This product includes a fully structured Power BI dashboard supported by a clean Excel data model.
✔️ Power BI Dashboard File
– Summary Page
– KPI Trend Page
– KPI Definition Page (drill-through)
✔️ Excel Data Source with 3 Sheets
– Input Actual: MTD & YTD actual KPI values
– Input Target: MTD & YTD target values
– KPI Definition: KPI number, group, unit, formula, definition, and type
✔️ pre-built KPIs & Calculations
– Automated MTD, YTD, Target vs Actual, and PY comparisons
– No manual formulas needed inside Power BI
✔️ User-Friendly Design
– Easy to maintain even for non-technical users
– Clean layout for fast decision-making
🛠️ How to Use the Knowledge Preservation KPI Dashboard
Using this dashboard is simple and efficient—even if you are new to Power BI.
1️⃣ Update KPI values in the Excel Input Actual and Input Target sheets
2️⃣ Ensure KPI names match the KPI Definition sheet
3️⃣ Refresh the Power BI file
4️⃣ Instantly view updated MTD, YTD, trends, and comparisons
5️⃣ Use slicers to analyze specific months or KPI groups
6️⃣ Drill through to view KPI definitions when needed
No advanced Power BI or DAX skills are required—basic Excel knowledge is enough ✅.
👥 Who Can Benefit from This Dashboard?
This dashboard is ideal for organizations that take knowledge seriously.
👨💼 HR & People Analytics Teams – Track knowledge retention and transfer
🎓 Learning & Development Teams – Measure training and documentation effectiveness
⚙️ Process Excellence Teams – Ensure process continuity and standardization
🧠 Knowledge Management Teams – Identify gaps in institutional knowledge
🛡️ Compliance & Risk Teams – Support audits with historical KPI data
🏢 Senior Leadership – Make data-driven decisions with confidence
It works perfectly across industries such as IT services, consulting, manufacturing, healthcare, and finance.
🚀 Why This Dashboard Is a Game changer
Unlike traditional Excel reports, this Power BI dashboard offers automation, interactivity, and clarity. It helps organizations move from reactive knowledge management to proactive knowledge governance, ensuring that critical expertise never walks out the door unnoticed.
🔗 Click here to read the Detailed blog post
🎥 Visit our YouTube channel to learn step-by-step video tutorials


Reviews
There are no reviews yet.