Virtual events have become a core channel for marketing, training, lead generation, and community engagement. However, running webinars, virtual conferences, and online workshops without measuring performance leads to unclear outcomes and missed improvement opportunities.
That is exactly where the Virtual Events KPI Scorecard in Excel becomes an essential performance management tool.
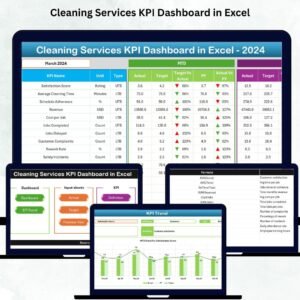
This ready-to-use Excel scorecard helps event teams track key virtual event KPIs, compare Actual vs Target, analyze MTD and YTD performance, and monitor trends over time. Instead of relying on scattered reports from multiple platforms, teams get a single, structured, and visual performance view—directly inside Excel.
Simple, flexible, and powerful, this scorecard transforms virtual event data into actionable insights.
⭐ Key Features of Virtual Events KPI Scorecard in Excel
-
📊 Centralized KPI Performance Tracking for virtual events
-
🎯 Actual vs Target Comparison for clear performance gaps
-
📅 MTD & YTD Performance Analysis
-
📈 KPI Trend Analysis with charts
-
🎛️ Interactive Dropdown Filters (Month / MTD / YTD)
-
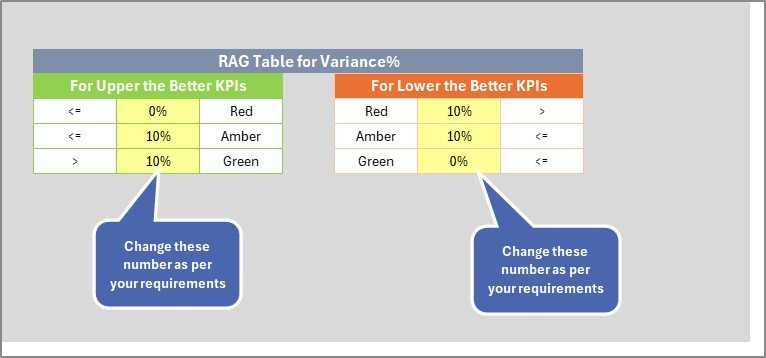
🟢🔴 Visual Performance Indicators using conditional formatting
-
📋 KPI Definition & Governance Sheet
-
⚙️ 100% Excel-Based & Fully Customizable
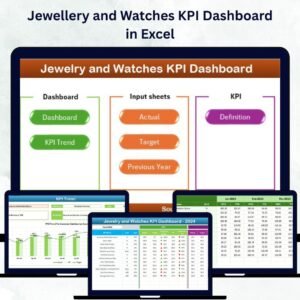
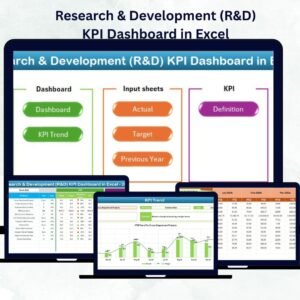
📦 What’s Included in the Virtual Events KPI Scorecard in Excel
This ready-to-use template includes 4 structured Excel worksheets; each designed for a specific role in performance tracking.
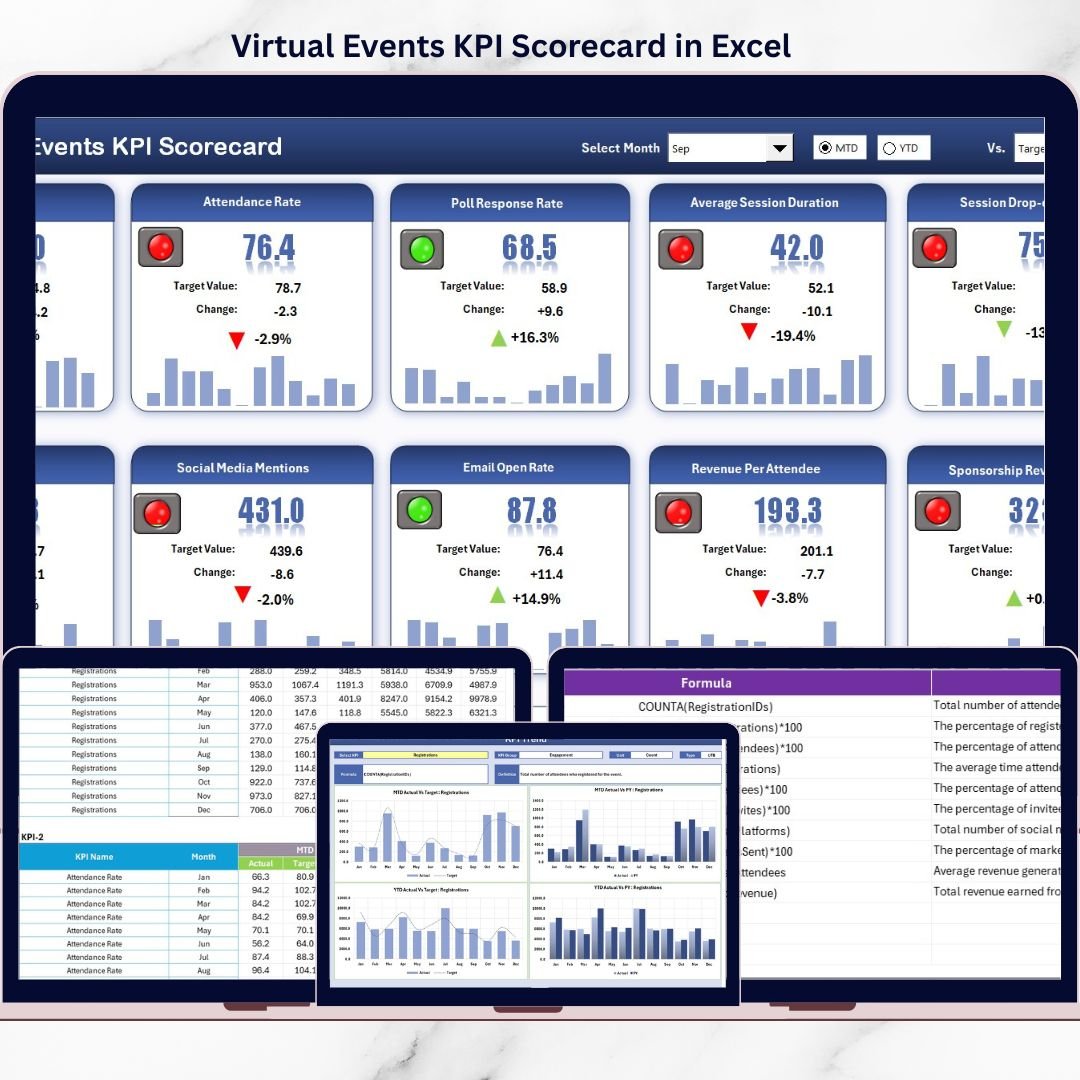
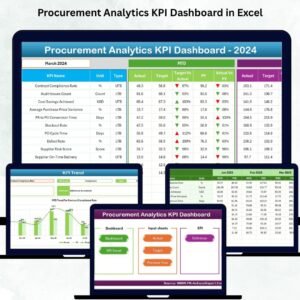
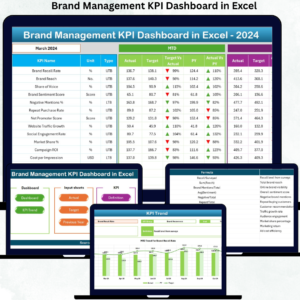
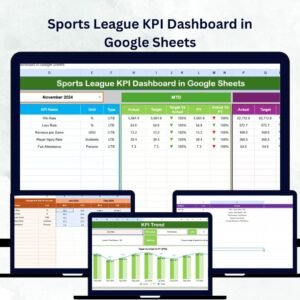
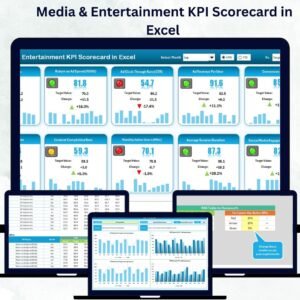
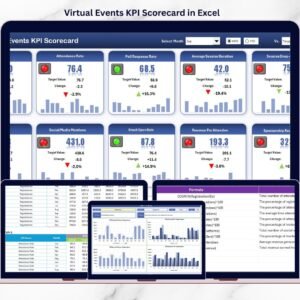
📄 1. Scorecard Sheet – Main Performance Dashboard
Virtual Events KPI Scorecard in Excel
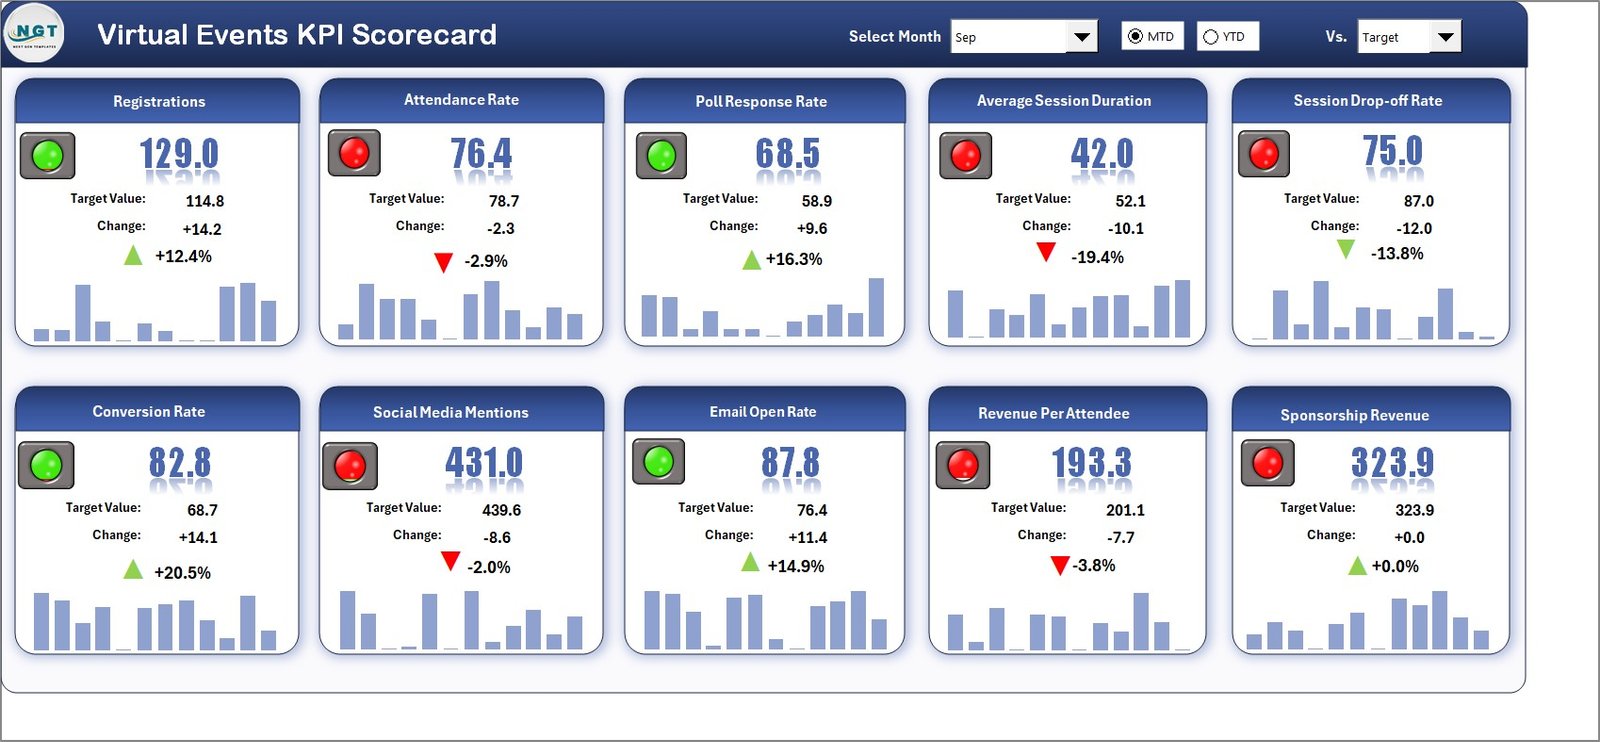
This is the primary dashboard where all KPIs are displayed in a clean and structured format.
🔹 Interactive Dropdowns
-
Select Month
-
Switch between MTD and YTD views
All KPI values update automatically based on selection.
🔹 Actual vs Target Comparison
Each KPI clearly shows:
-
Actual Value
-
Target Value
This instantly highlights performance gaps.
🔹 Visual Performance Indicators
-
Color-coded KPI status
-
Clear identification of underperforming KPIs
🔹 Comprehensive KPI View
-
KPI Name
-
KPI Group
-
Unit
-
MTD Actual & Target
-
YTD Actual & Target
Decision-makers can assess virtual event performance within seconds.
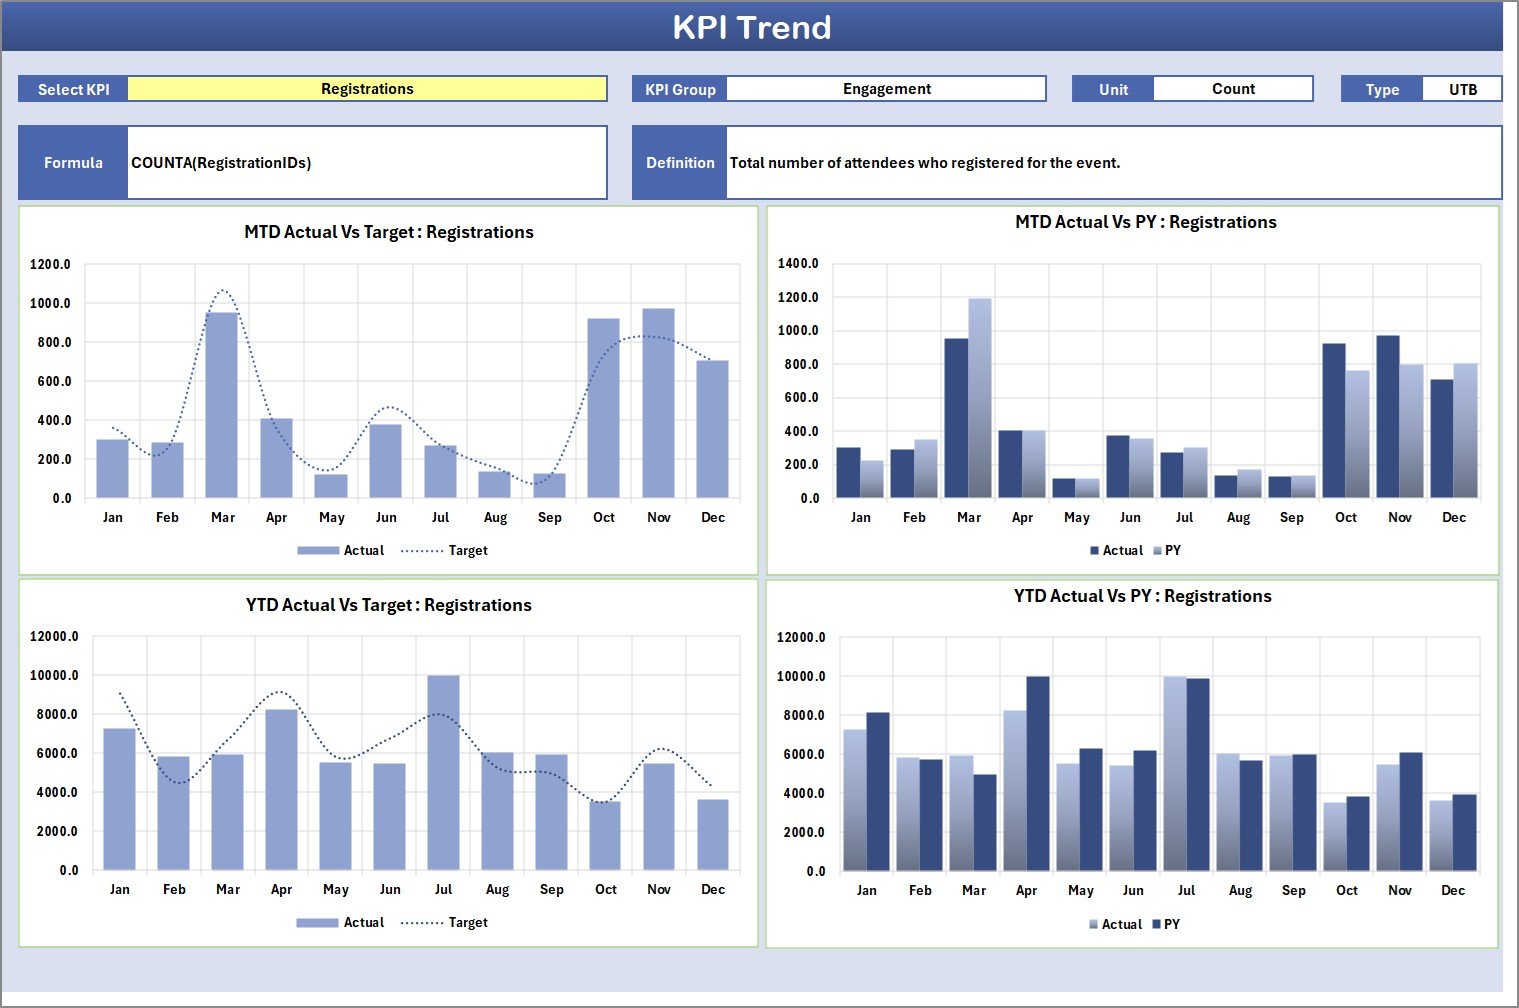
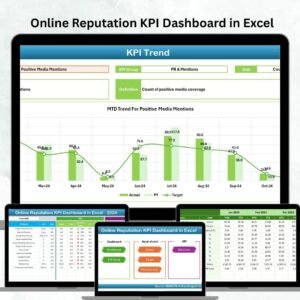
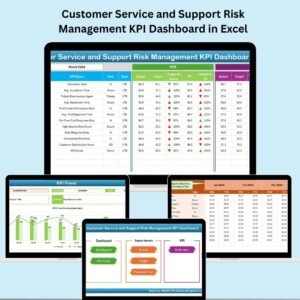
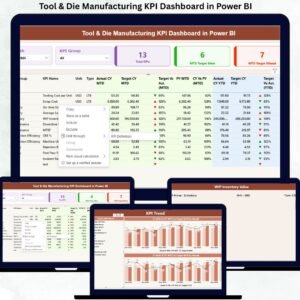
📄 2. KPI Trend Sheet – Performance Trend Analysis
The KPI Trend Sheet focuses on deep-dive analysis of individual KPIs.
🔹 KPI Selection Dropdown
-
Select KPI from dropdown (cell C3)
🔹 KPI Details Display
-
KPI Group
-
KPI Unit
-
KPI Type (LTB / UTB)
-
KPI Formula
-
KPI Definition
🔹 Trend Charts
-
MTD Trend (Actual vs Target vs Previous Year)
-
YTD Trend (Actual vs Target vs Previous Year)
This helps teams identify performance patterns, improvements, and declines.
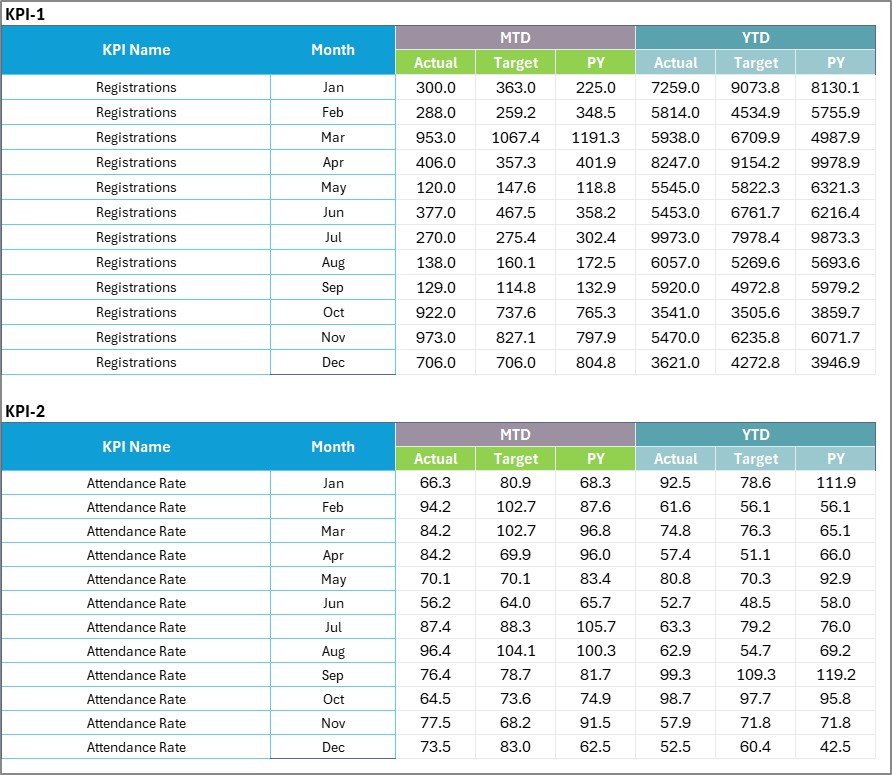
📄 3. Input Data Sheet – KPI Data Entry Area
This sheet acts as the data foundation of the scorecard.
You can enter:
-
Actual KPI values
-
Target KPI values
-
Month-wise data
Once data is updated, all dashboards and charts refresh automatically, ensuring real-time insights.
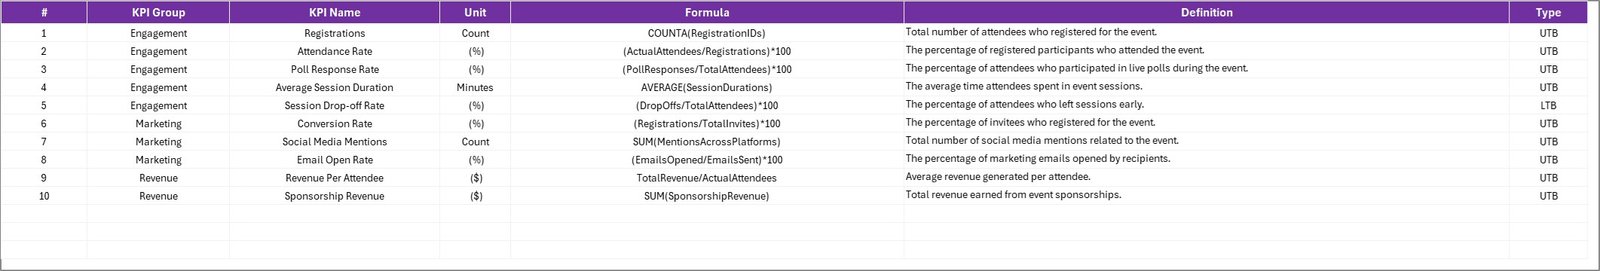
📄 4. KPI Definition Sheet – KPI Governance Layer
This sheet ensures clarity, consistency, and standardization.
It captures:
-
KPI Name
-
KPI Group
-
Unit
-
Formula
-
KPI Definition
This prevents confusion and ensures everyone interprets KPIs the same way.
🚀 How This Scorecard Improves Virtual Event Performance
✔ Aligns teams with measurable event goals
✔ Highlights underperforming KPIs early
✔ Supports data-driven decisions
✔ Improves engagement, conversion, and ROI
✔ Enables continuous improvement
Instead of guesswork, teams manage events with clear performance visibility.
👥 Who Should Use Virtual Events KPI Scorecard in Excel?
This scorecard is ideal for:
-
🎯 Marketing Teams
-
🎥 Event Managers
-
🎓 Training & L&D Teams
-
💻 Webinar Hosts
-
🌍 Community Managers
-
🚀 Product Marketing Teams
-
🏢 Small Businesses & Enterprises
If you run virtual events, this scorecard fits perfectly.
📊 Example KPIs You Can Track
-
Event Registrations
-
Attendance Rate
-
Engagement Rate
-
Drop-off Rate
-
Average Watch Time
-
Feedback / Satisfaction Score
-
Conversion Rate
-
Cost per Attendee
-
Repeat Attendee Rate
All KPIs are fully customizable.
📖 Click here to read the Detailed blog post
🎥 Visit our YouTube channel for step-by-step tutorials
👉 https://youtube.com/@PKAnExcelExpert


Reviews
There are no reviews yet.