Insurance brokers manage policies, agents, commissions, premiums, and payments every single month. However, when this information lives in raw spreadsheets or manual summaries, visibility drops, errors increase, and performance tracking becomes reactive instead of proactive.
That is exactly where the Insurance Brokers Dashboard in Google Sheets creates real impact.
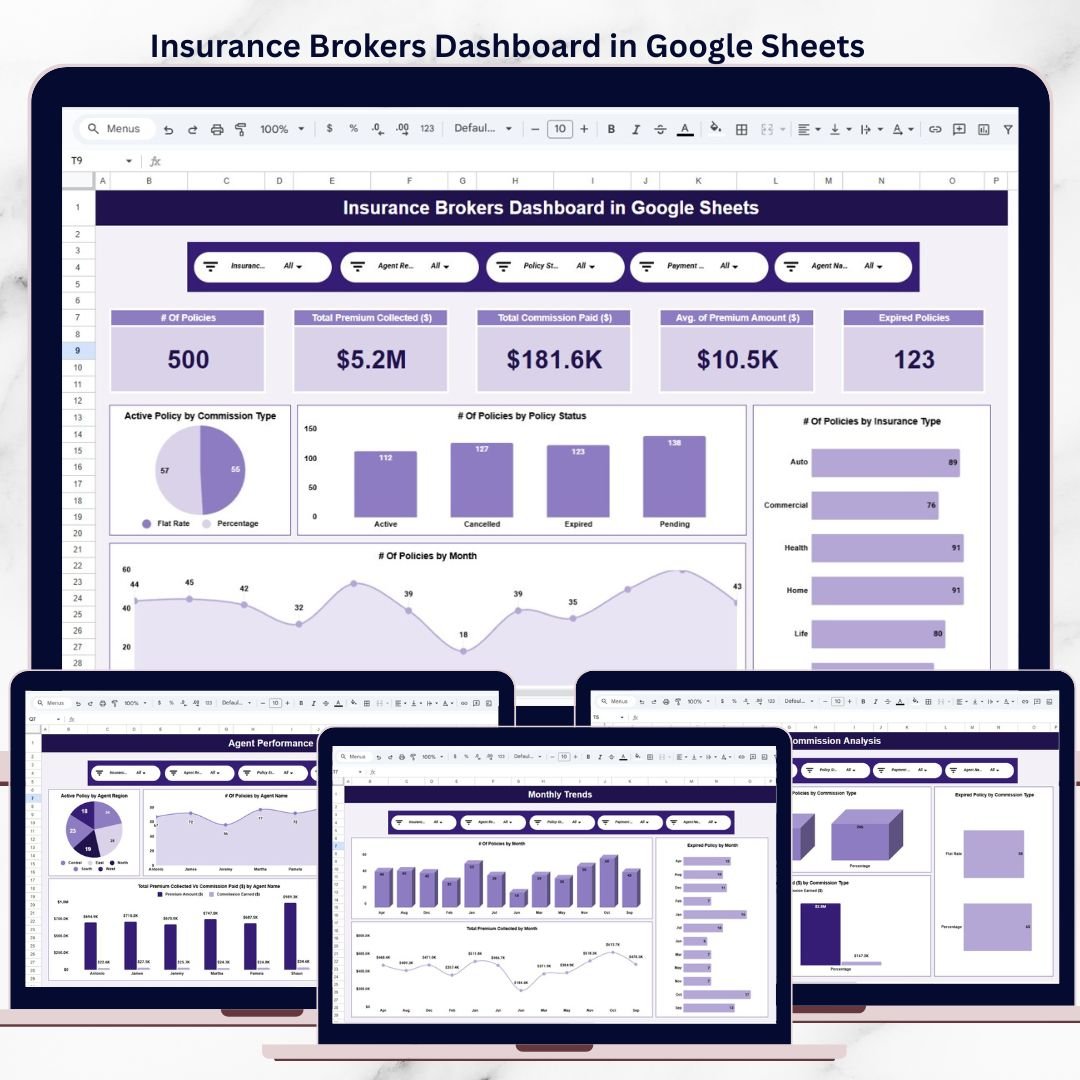
This ready-to-use Google Sheets dashboard transforms raw insurance data into clear KPIs, interactive charts, slicers, and trends. Instead of chasing numbers across files, brokers get instant clarity on policy performance, agent productivity, commissions, and revenue—all in one centralized dashboard.
Because it is built in Google Sheets, the dashboard remains cloud-based, collaborative, and easy to update, making it ideal for fast-moving insurance businesses.
⭐ Key Features of Insurance Brokers Dashboard in Google Sheets
📊 All-in-One Insurance Performance Dashboard
Track policies, premiums, commissions, agents, and payments in one place.
🎛️ Interactive Slicers
Filter data instantly by insurance type, agent, region, policy status, or payment mode.
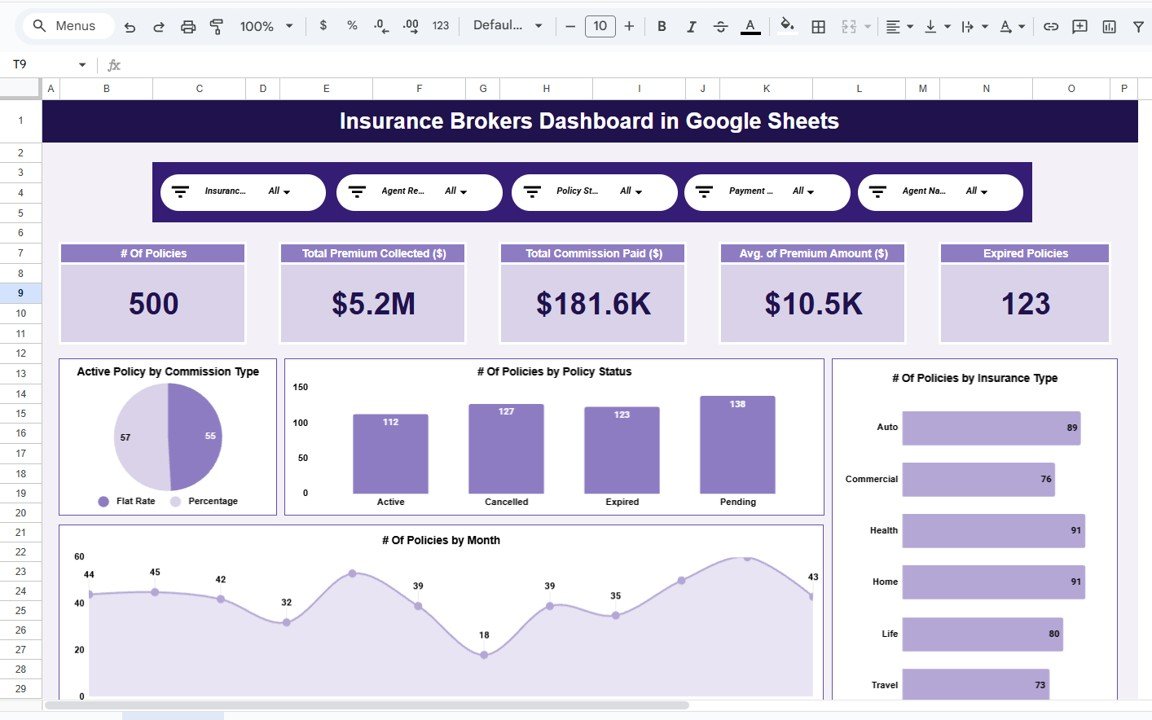
📈 Real-Time KPI Cards
Monitor total policies, premium collected, commission paid, and expired policies at a glance.
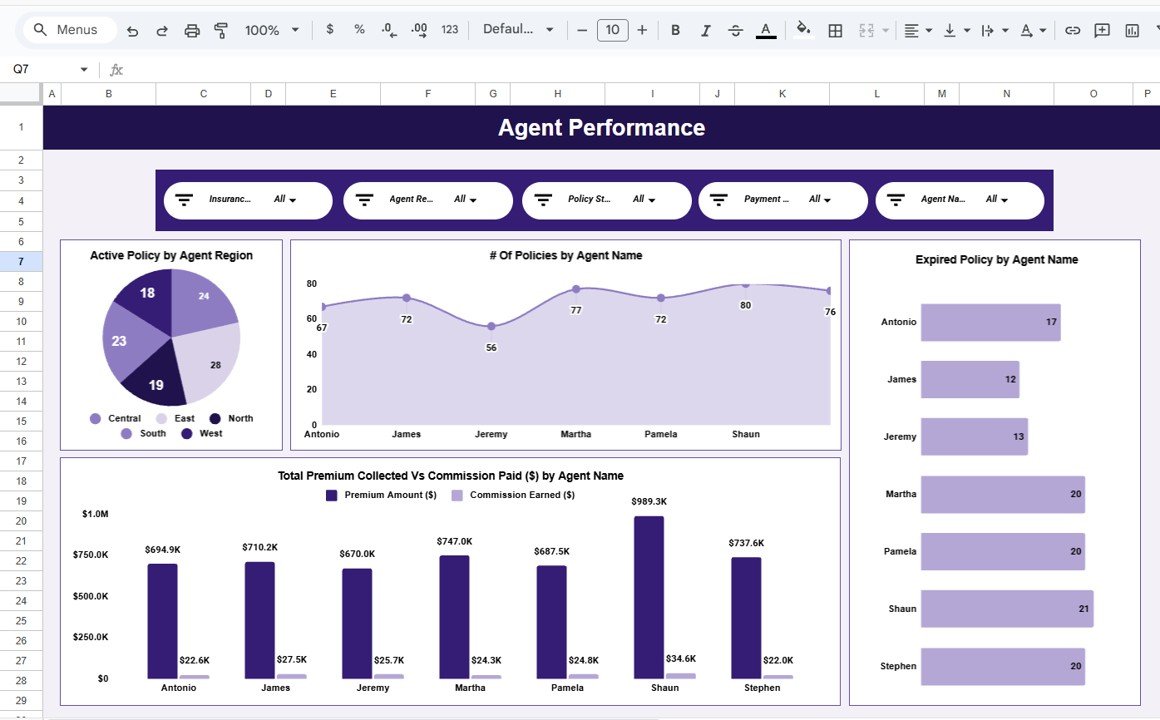
🧑💼 Agent Performance Analysis
Identify top-performing and underperforming agents quickly.
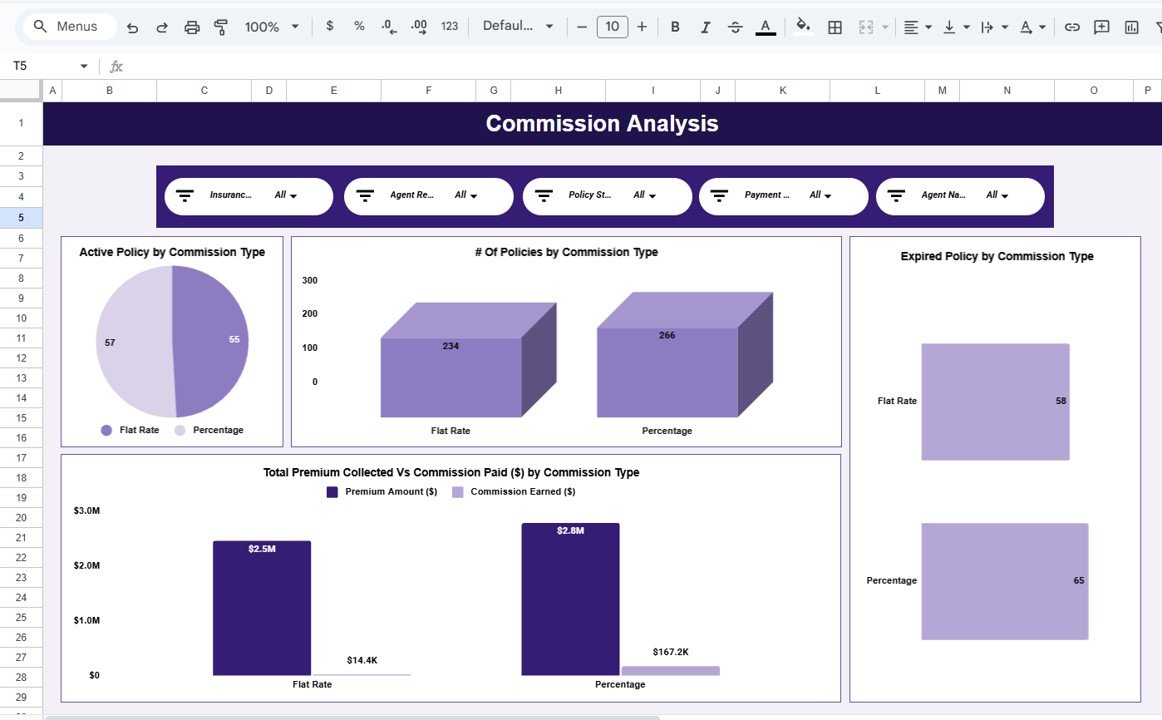
💰 Commission & Revenue Insights
Understand commission structures and payout efficiency clearly.
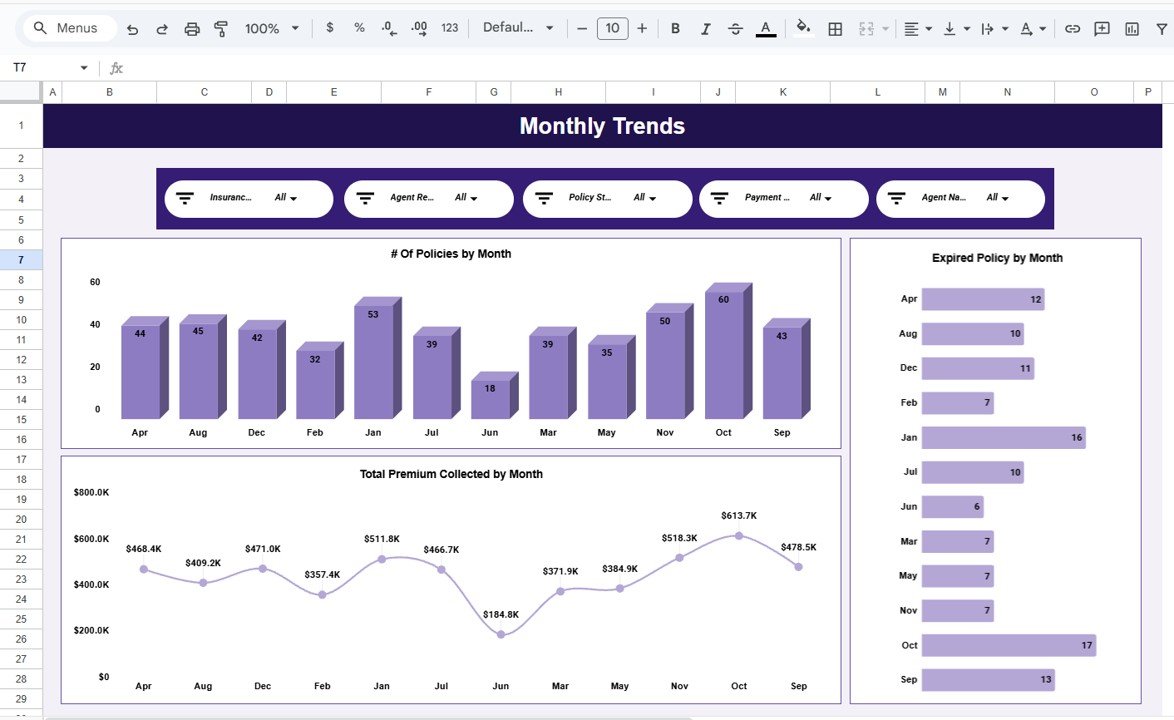
📅 Monthly Trend Analysis
Track policy count, revenue, and expiries over time.
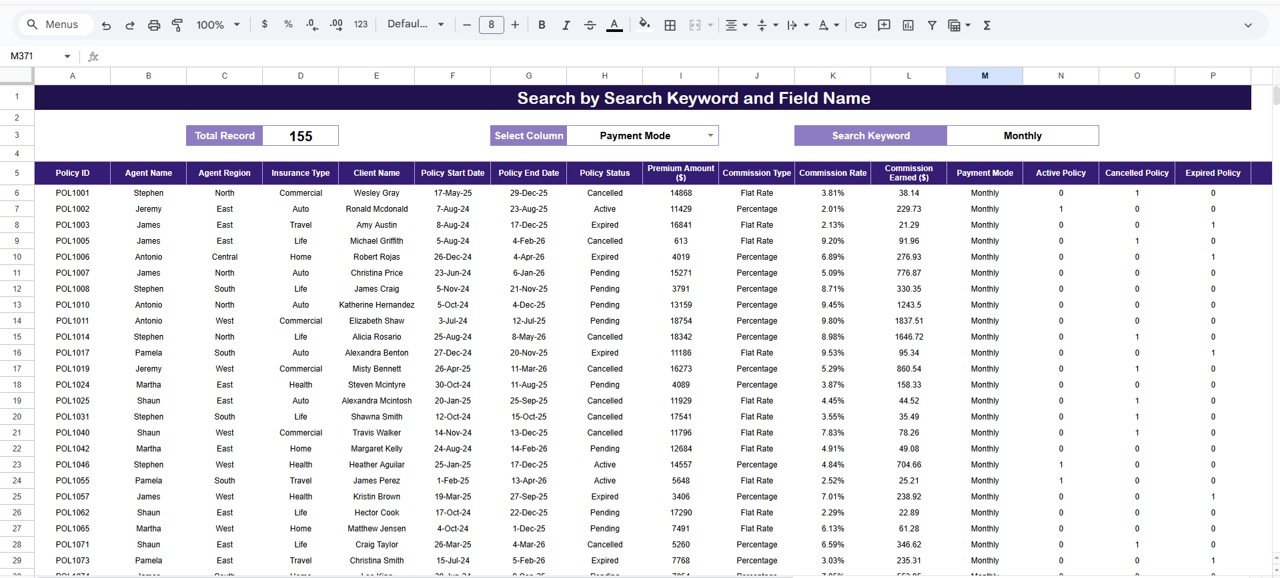
🔍 Search & Drill-Down Capability
Find policy-level details instantly using keyword search.
☁️ Built in Google Sheets
Real-time collaboration with no complex tools required.
📦 What’s Inside the Insurance Brokers Dashboard in Google Sheets?
This dashboard includes six professionally designed analytical pages, each focused on a specific business area:
📌 Overview Page
High-level snapshot of policies, premiums, commissions, and trends.
📌 Agent Performance Page
Agent-wise policies, premiums, commissions, and expiries.
📌 Commission Analysis Page
Commission type performance, premium vs commission comparison.
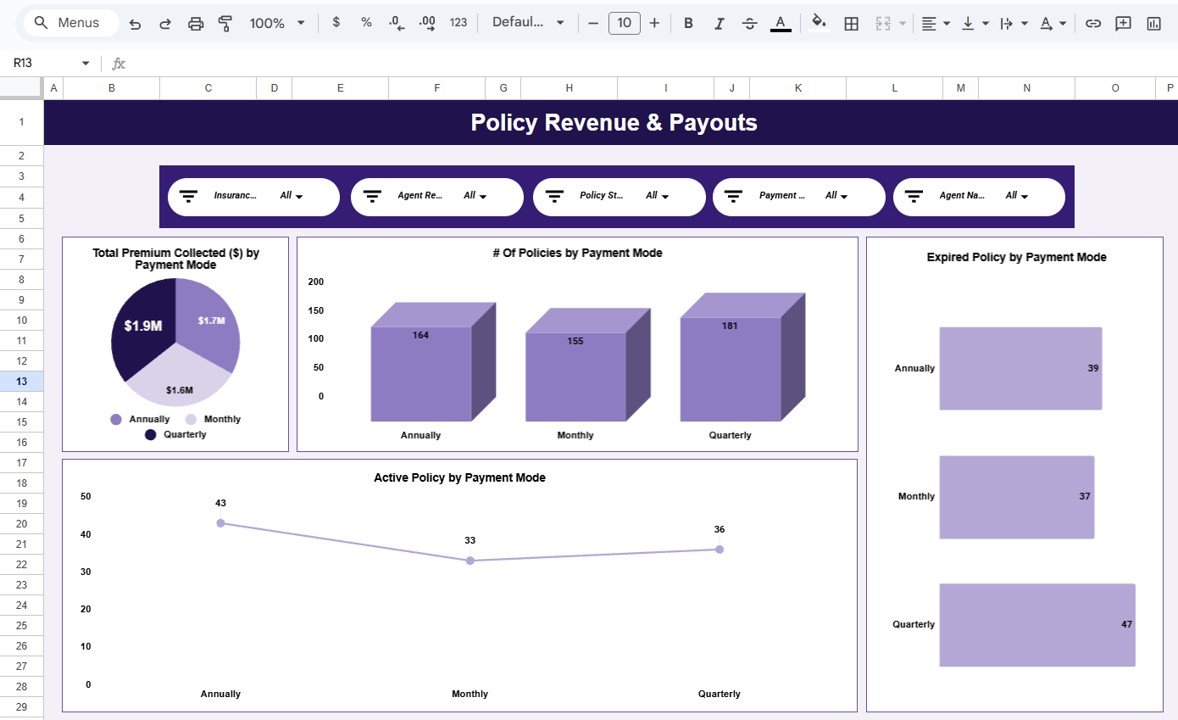
📌 Policy Revenue & Payouts Page
Payment-mode-wise revenue and policy distribution.
📌 Monthly Trends Page
Month-wise policy count, premium collection, and expiries.
📌 Search & Detailed Data Page
Keyword-based search, record count, and policy-level drill-down.
Together, these pages create a complete insurance brokerage performance management system.
🛠️ How to Use the Insurance Brokers Dashboard in Google Sheets
Using this dashboard is simple and intuitive:
1️⃣ Enter policy and transaction data in the data table
2️⃣ Use slicers to filter by agent, insurance type, or policy status
3️⃣ Review KPI cards and charts on each page
4️⃣ Analyze trends across months and agents
5️⃣ Identify gaps and take corrective action
All visuals update automatically, so users focus on insights—not formulas.
👥 Who Can Benefit from This Insurance Brokers Dashboard?
This dashboard is ideal for:
🛡️ Insurance Brokers & Agencies
🧑💼 Sales & Agent Managers
💰 Finance & Commission Teams
📊 Operations Teams
🏢 Business Owners
Whether you manage a small brokerage or a large agency, this dashboard scales easily.
🚀 Why This Dashboard Is a Must-Have for Insurance Brokers
✔ Centralizes insurance reporting
✔ Improves agent accountability
✔ Simplifies commission analysis
✔ Reveals revenue and policy trends
✔ Saves hours of manual reporting
✔ No Power BI or complex systems required
This dashboard turns Google Sheets into a powerful insurance analytics tool.
🔗 Click here to read the Detailed blog post
Watch the step-by-step video tutorial:
📺 Visit our YouTube channel to learn step-by-step video tutorials and dashboard walkthroughs.


Reviews
There are no reviews yet.