Ticket resolution time is one of the most critical performance indicators for any support-driven organization. Whether you manage IT incidents, customer service requests, internal helpdesk issues, or technical support tickets, slow resolutions quickly lead to frustrated users, SLA breaches, escalations, and rising operational costs. Unfortunately, many teams still rely on emails, ticket exports, or disconnected spreadsheets to monitor ticket performance. As a result, visibility is limited and improvement becomes reactive instead of proactive.Ticket Resolution Time KPI Dashboard in Google Sheets
That is exactly why the Ticket Resolution Time KPI Dashboard in Google Sheets becomes an essential service performance management tool.
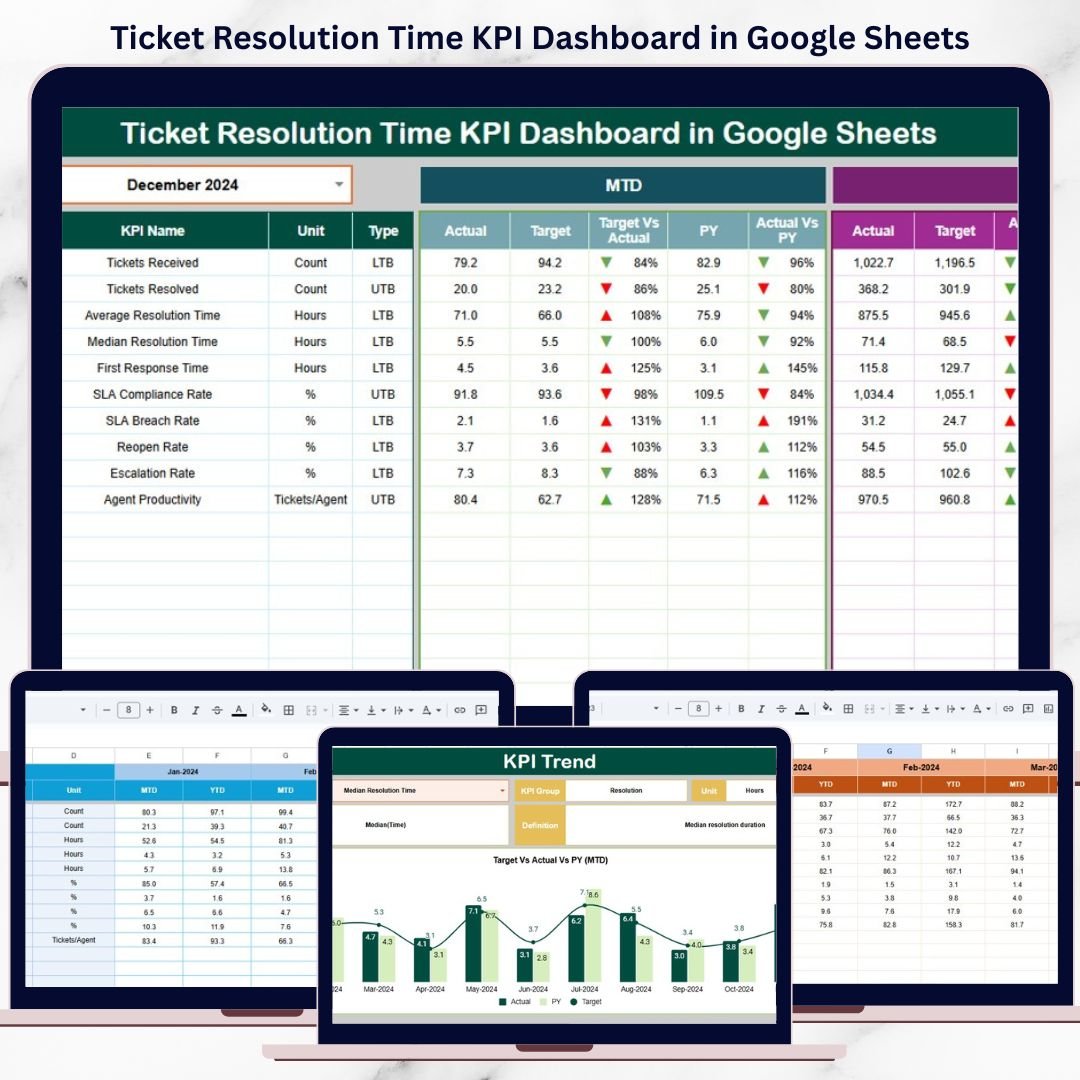
This ready-to-use dashboard converts raw ticket data into structured KPIs, trends, and comparisons that clearly show how efficiently tickets are handled. It helps IT support teams, helpdesk managers, customer service leaders, and executives track resolution speed, SLA compliance, backlog levels, and productivity in one centralized Google Sheets dashboard. Instead of guessing where delays occur, teams gain instant clarity through automated calculations and visual indicators—without relying on expensive ticketing analytics or BI tools.Ticket Resolution Time KPI Dashboard in Google Sheets
Because it runs entirely in Google Sheets, the dashboard is easy to use, collaborative, and scalable for organizations of any size.
✨ Key Features of the Ticket Resolution Time KPI Dashboard in Google Sheets
⏱️ 1. MTD & YTD Resolution Performance Tracking
Monitor Month-to-Date and Year-to-Date ticket resolution KPIs to understand both short-term performance and long-term efficiency trends.Ticket Resolution Time KPI Dashboard in Google Sheets
🎯 2. Target vs Actual & Previous-Year Comparison
Compare actual resolution performance against SLA targets and last year’s benchmarks to identify gaps and improvements.Ticket Resolution Time KPI Dashboard in Google Sheets
📈 3. Visual Performance Indicators
Conditional formatting arrows provide instant clarity:
-
🟢 Green arrow → faster resolution and SLA compliance
-
🔴 Red arrow → delays, backlog risk, or SLA breaches
📉 4. KPI Trend Analysis
Track month-wise KPI trends to understand changes in resolution speed, backlog growth, and service quality.
☁️ 5. Google Sheets-Based Collaboration
Enable IT, service, and leadership teams to collaborate using a single shared dashboard with real-time updates.
📦 What’s Inside the Ticket Resolution Time KPI Dashboard in Google Sheets
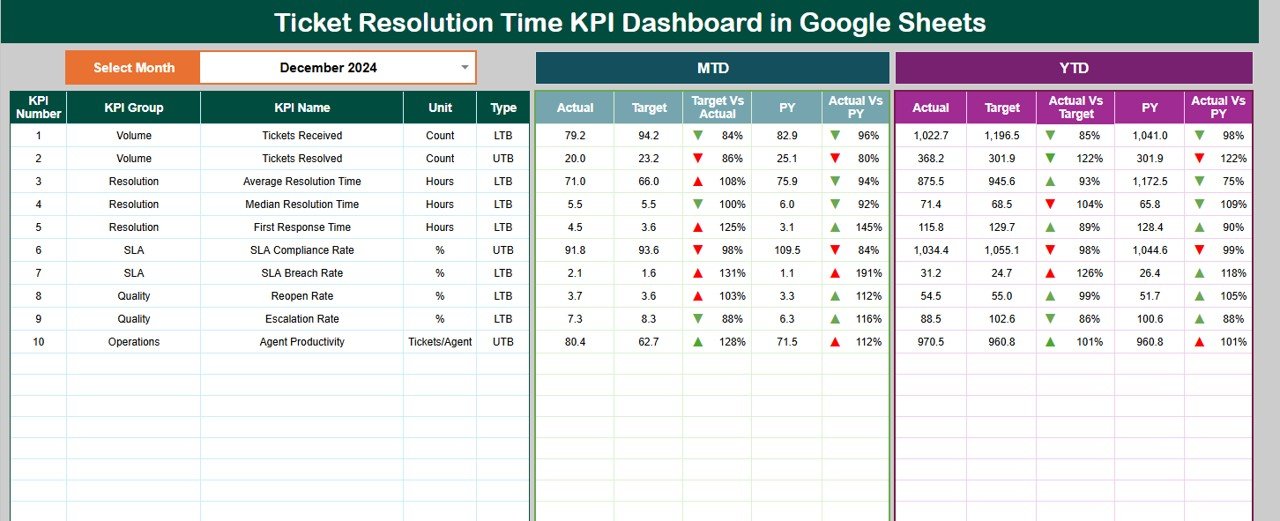
🖥️ Dashboard Sheet Tab (Main Control Panel)
This is the executive summary view used during service reviews and SLA discussions.
Month Selector
-
Located in cell D3
-
Automatically refreshes all KPIs
MTD Metrics Displayed
-
Actual
-
Target
-
Previous Year
-
Target vs Actual
-
Previous Year vs Actual
YTD Metrics Displayed
-
Actual
-
Target
-
Previous Year
-
Target vs Actual
-
Previous Year vs Actual
This layout gives leadership a complete snapshot of resolution performance in seconds.
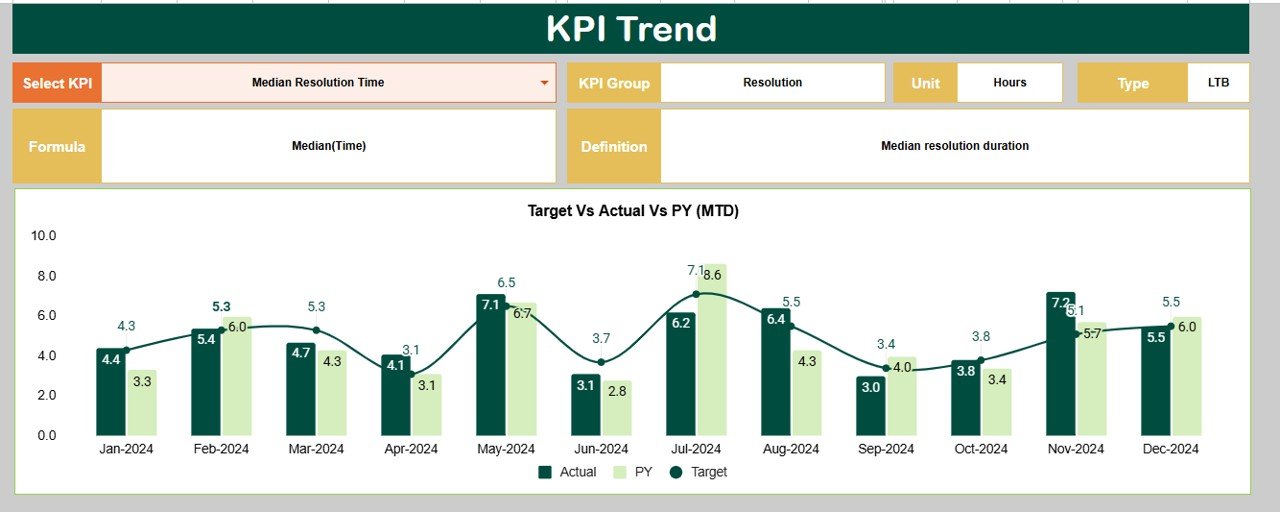
📊 KPI Trend Sheet Tab
This sheet supports deep-dive analysis of individual ticket KPIs.
How It Works
-
Select a KPI from the dropdown in cell C3
Details Displayed
-
KPI Group
-
Unit of Measurement
-
KPI Type (Lower the Better / Upper the Better)
-
KPI Formula
-
KPI Definition
Trend Visualization
-
Month-wise KPI movement
-
Resolution speed changes
-
Backlog and SLA risk indicators
This sheet is ideal for identifying recurring delays and process inefficiencies.
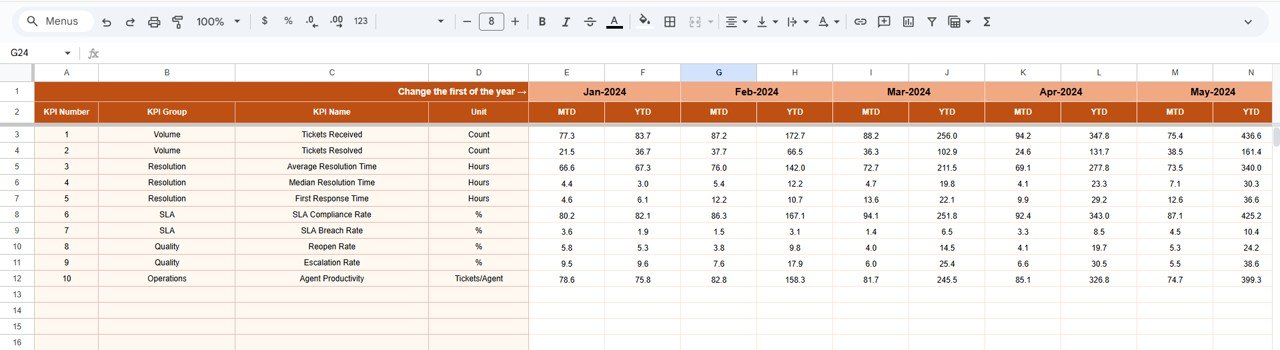
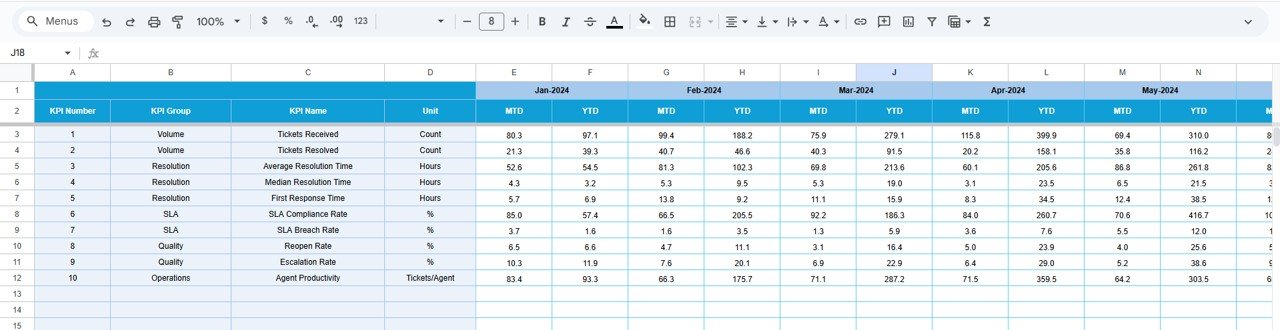
📋 Actual Number Sheet Tab
This is the structured data-entry sheet for real ticket performance.
-
Enter MTD Actual values
-
Enter YTD Actual values
-
Define the first month of the year in cell E1
All dashboard calculations and visuals update automatically.
🎯 Target Sheet Tab
This sheet stores SLA and performance goals.
-
Monthly (MTD) targets
-
Annual (YTD) targets
Targets help teams align ticket resolution efforts with service commitments.
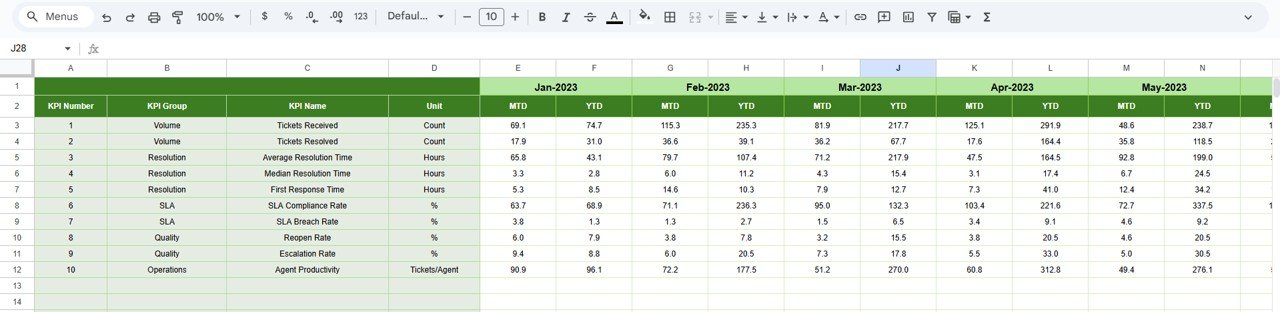
📆 Previous Year Number Sheet Tab
Stores last year’s ticket performance data to support:
-
Year-over-year comparison
-
Historical benchmarking
-
Long-term service improvement tracking
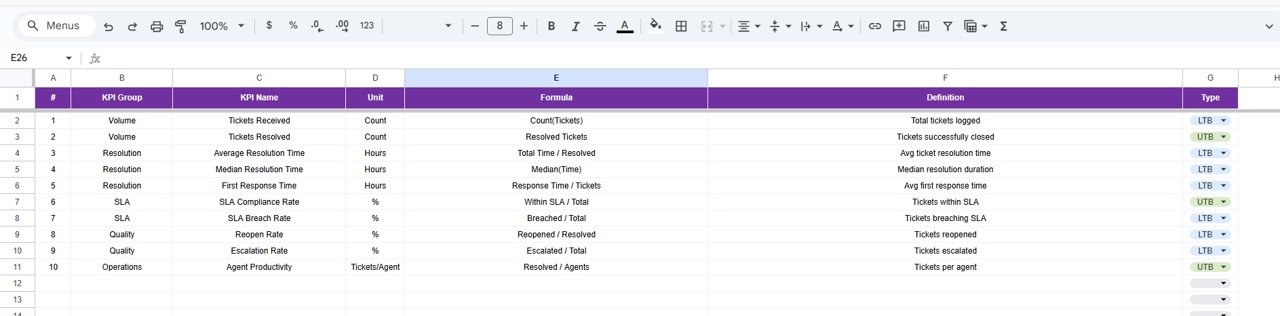
📘 KPI Definition Sheet Tab
This is the governance layer of the dashboard.
It contains:
-
KPI Name
-
KPI Group
-
Unit
-
Formula
-
KPI Definition
-
KPI Type (UTB / LTB)
This ensures consistent KPI interpretation and audit readiness.
🎯 Who Can Benefit from This Ticket Resolution Time KPI Dashboard
🛠️ IT Support & Helpdesk Teams
Track response and resolution efficiency clearly.
🎧 Customer Service Teams
Improve SLA compliance and customer satisfaction.
📊 Service Managers
Identify backlog risks and productivity gaps early.
🏢 Leadership & Executives
Gain visibility into service quality and operational efficiency.
🚀 Organizations of Any Size
Improve ticket resolution performance without complex tools.
### Click here to read the Detailed blog post
Watch the step-by-step video tutorial:


Reviews
There are no reviews yet.