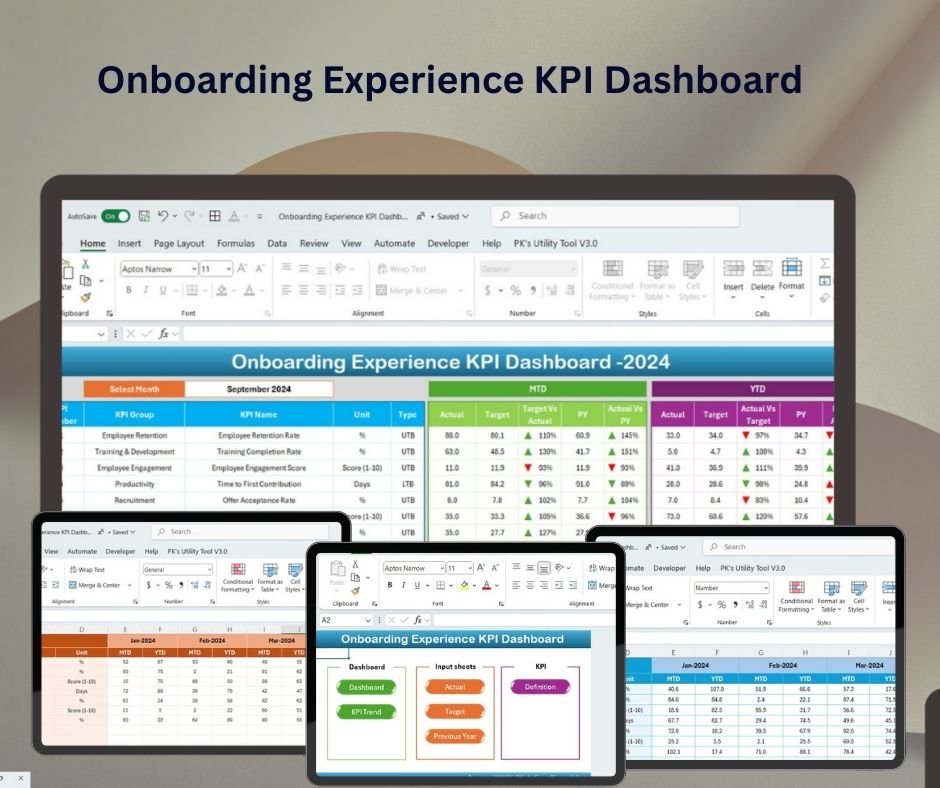
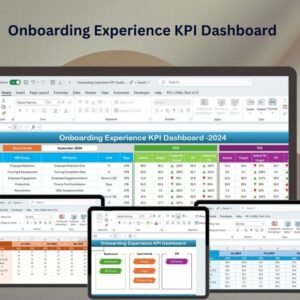
The Onboarding Experience KPI Dashboard is an innovative Excel dashboard designed to help HR teams and business leaders track and analyze key performance indicators (KPIs) related to the employee onboarding process. This interactive and visually appealing dashboard helps you monitor various aspects of your onboarding experience, ensuring a smooth and effective transition for new hires.
With the ability to track metrics such as completion rates, time-to-productivity, employee satisfaction, and more, this dashboard provides actionable insights to optimize the onboarding process. It is an essential tool for HR professionals aiming to improve the experience of new employees while ensuring that all necessary tasks are completed on time and effectively.
Key Features of the Onboarding Experience KPI Dashboard
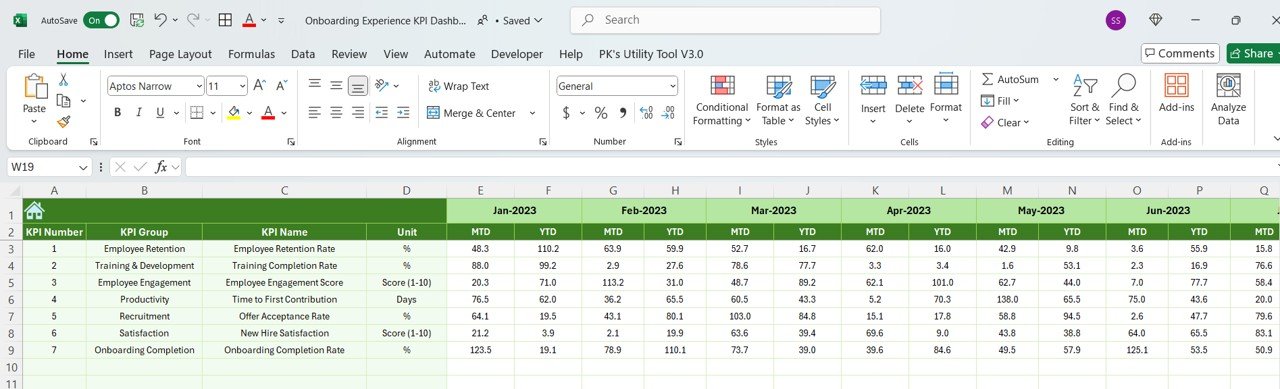
📊 KPI Tracking: Monitor crucial onboarding metrics such as training completion, engagement scores, and time-to-productivity.
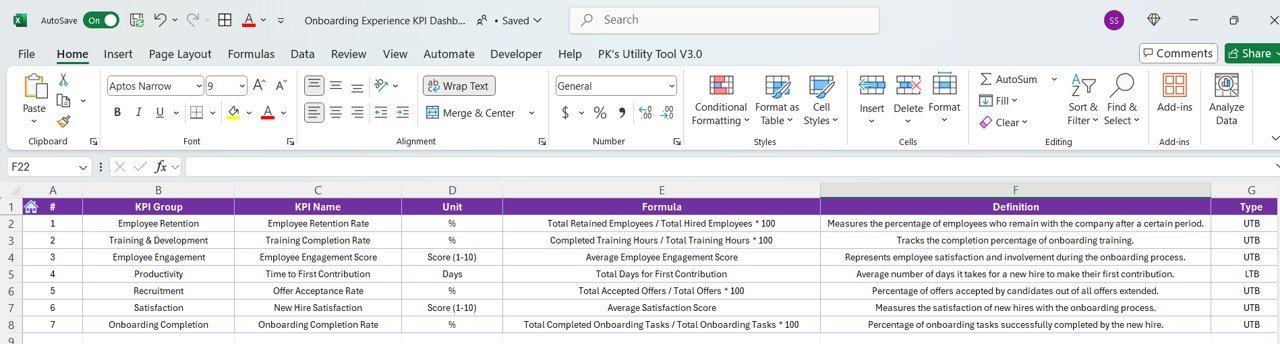
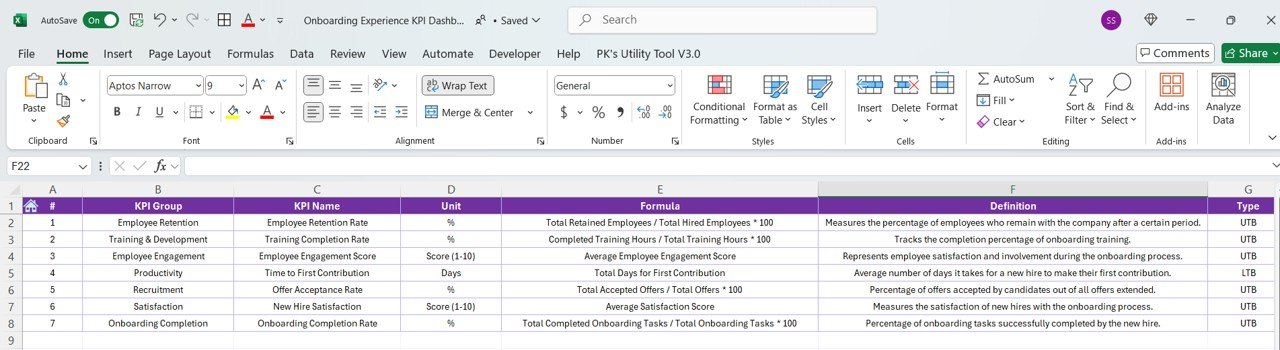
⚙️ Customizable Metrics: Adjust the dashboard to track specific onboarding KPIs relevant to your organization’s needs.
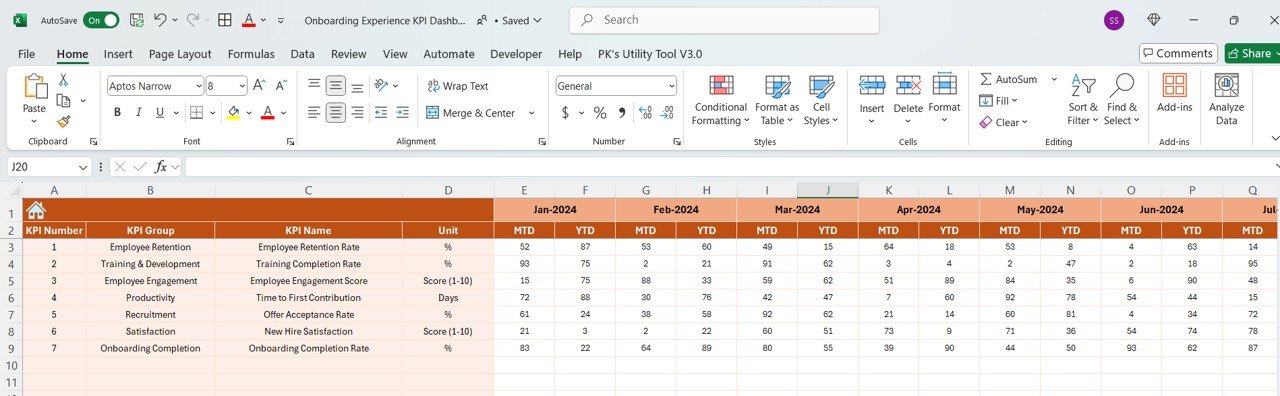
📅 Time-Based Analysis: Analyze onboarding progress over time, from day one to full integration.
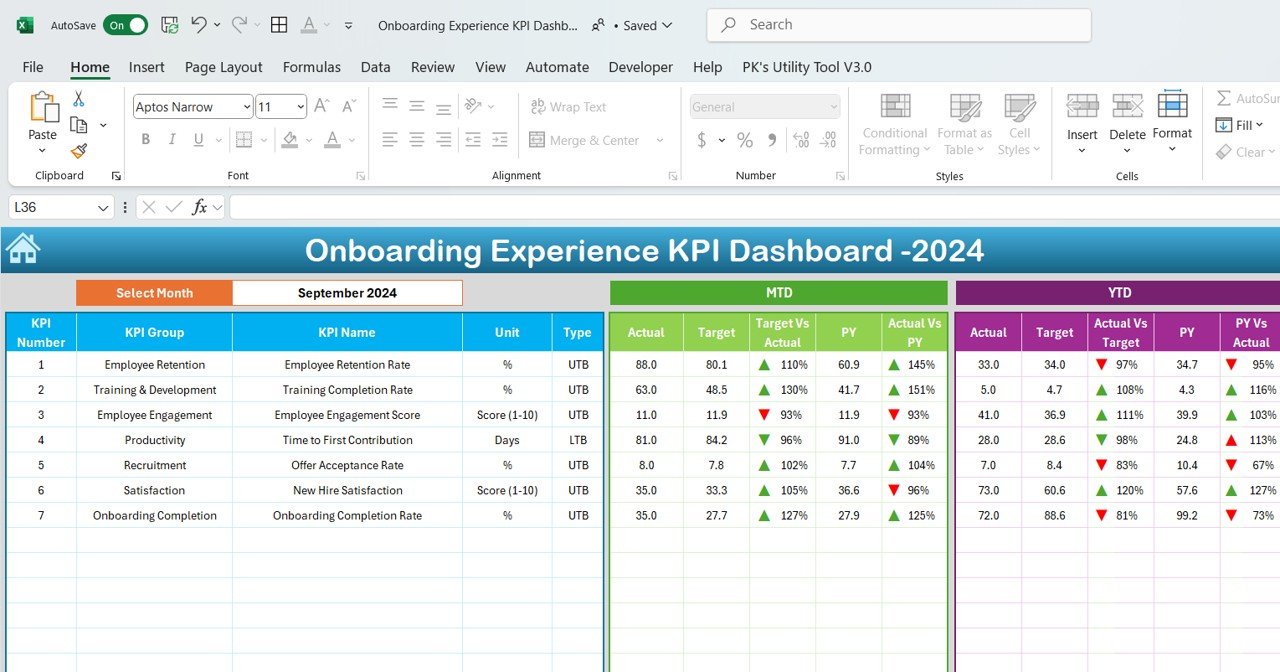
📈 Visual Data Representation: Utilize dynamic charts and graphs to visualize key performance indicators in an easily digestible format.
🧑💼 Employee Satisfaction Scores: Track satisfaction levels of new hires throughout the onboarding journey to identify areas for improvement.
💼 Task Completion Tracking: Keep track of essential tasks like document submission, training, and system access to ensure timely onboarding.
Why You’ll Love the Onboarding Experience KPI Dashboard
✅ Streamlines Onboarding: Get a complete overview of the entire onboarding process in one place.
✅ Actionable Insights: Identify bottlenecks, areas for improvement, and opportunities to enhance the new hire experience.
✅ Real-Time Updates: Track real-time data to ensure all onboarding activities are progressing smoothly.
✅ Customizable for Your Needs: Tailor the dashboard to track the KPIs most relevant to your specific organizational goals.
✅ Improves Employee Experience: Ensure new hires are supported from day one and make the onboarding process as smooth as possible.
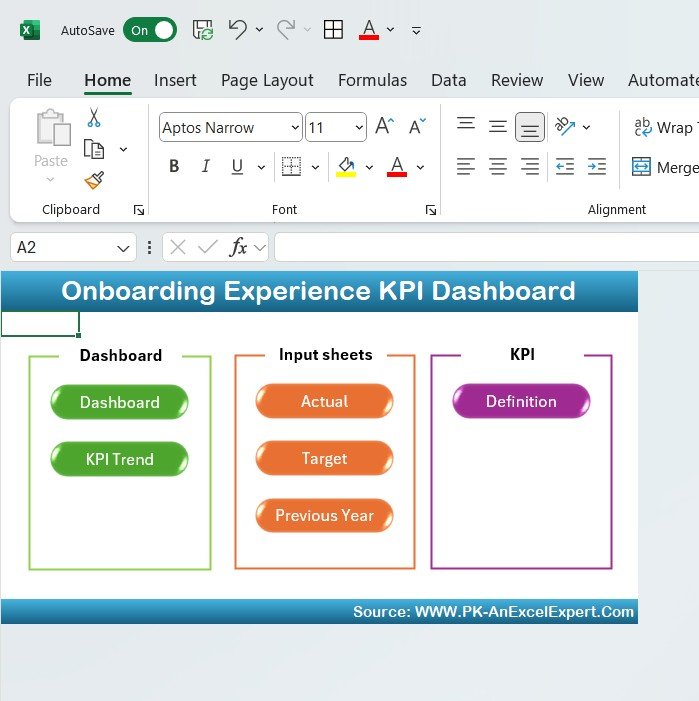
What’s Inside the Onboarding Experience KPI Dashboard?
📊 Onboarding KPIs: Track and visualize key metrics like training completion, satisfaction, and engagement.
⚙️ Customizable Inputs: Adjust KPIs to reflect the unique needs and goals of your organization.
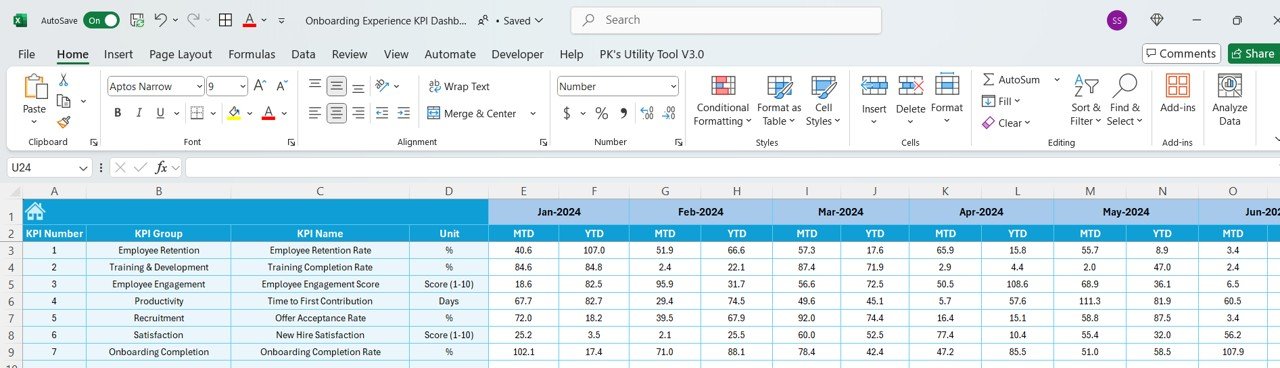
📈 Trend Analysis: Monitor onboarding progress over time and assess improvements or challenges.
🧑💼 Employee Satisfaction Tracking: Evaluate new hire satisfaction levels at different stages of the onboarding process.
💼 Task Completion Monitoring: Ensure that all onboarding tasks are completed on time with an easy-to-read progress tracker.
How to Use the Onboarding Experience KPI Dashboard
1️⃣ Download the Template – Get immediate access to the pre-built onboarding dashboard.
2️⃣ Customize Your Metrics: Adjust KPIs to align with your specific organizational needs.
3️⃣ Track Progress: Enter data to monitor real-time progress and performance metrics.
4️⃣ Analyze Results: Use visual charts and graphs to evaluate the success of your onboarding program.
5️⃣ Make Improvements: Identify areas of improvement in your onboarding process based on the dashboard insights.
Who Can Benefit from the Onboarding Experience KPI Dashboard?
🔹 HR Managers
🔹 Onboarding Coordinators
🔹 Business Leaders
🔹 Team Managers
🔹 Employee Experience Professionals
🔹 Talent Acquisition Teams
Optimize your onboarding process and ensure a seamless experience for new hires with the Onboarding Experience KPI Dashboard. Track and analyze crucial metrics that improve employee engagement, retention, and overall success.
Click here to read the detailed blog post
Visit our YouTube channel to learn step-by-step video tutorials


Reviews
There are no reviews yet.