Water scarcity is no longer a future risk—it is a current operational challenge for cities, industries, institutions, and communities. When water harvesting data stays in manual registers or scattered spreadsheets, teams lose visibility, accountability, and the ability to act on time.
That is exactly why the Water Harvesting KPI Dashboard in Excel is a smart and practical solution 🚀.
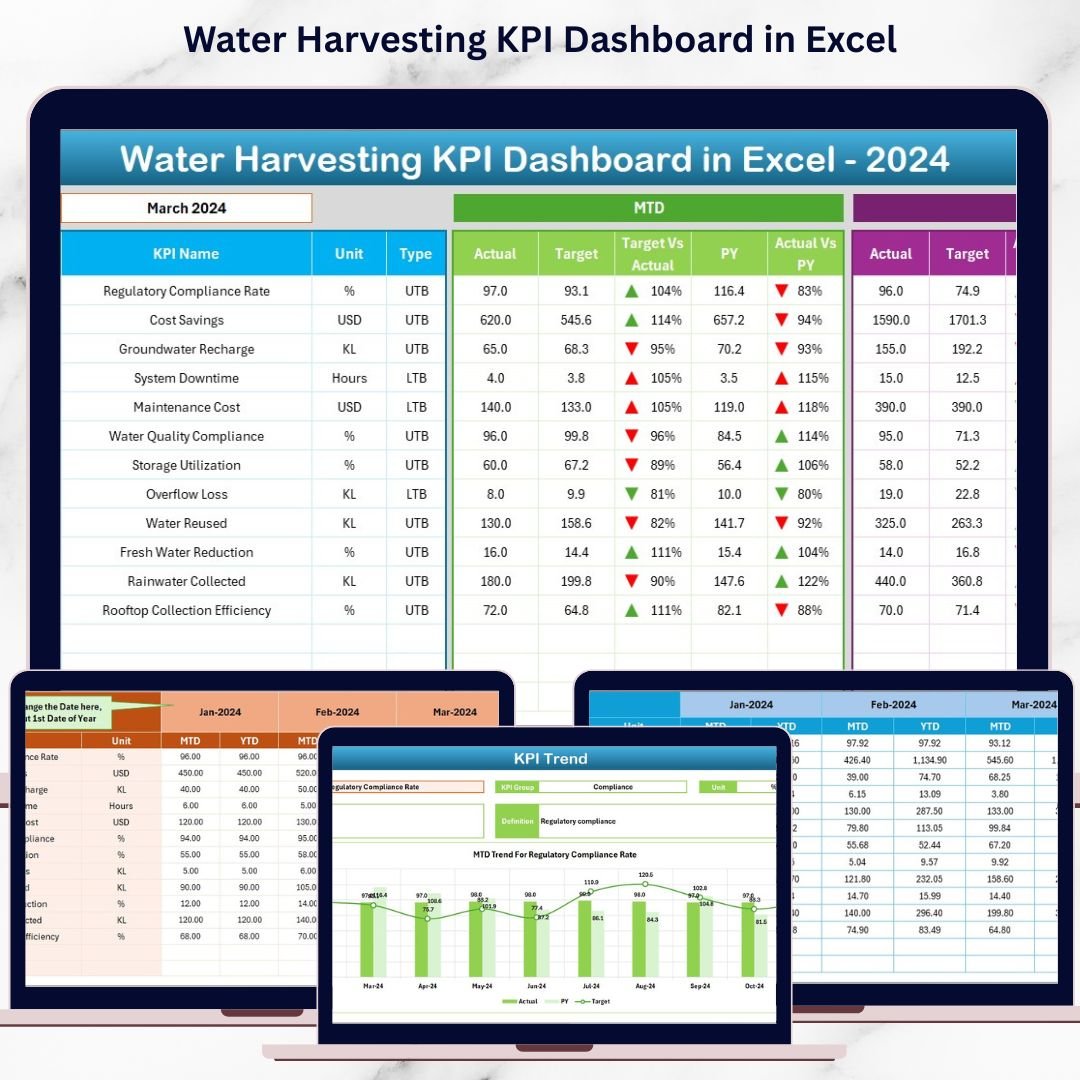
This ready-to-use Excel dashboard transforms raw water harvesting data into clear KPIs, instant comparisons, and actionable trends, helping organizations manage water resources responsibly and efficiently.
Designed for sustainability teams, facility managers, municipalities, and industries, this dashboard enables you to track MTD and YTD performance, compare targets with actuals, analyze trends, and demonstrate measurable impact—all within Excel, without complex tools.
🔑 Key Features of Water Harvesting KPI Dashboard in Excel
📊 Centralized Water Performance Tracking
Monitor all water harvesting KPIs in one structured and interactive dashboard.
📅 Dynamic Month Selection
Select any month from a drop-down and instantly view updated MTD and YTD results.
🎯 Target vs Actual Comparison
Clearly see whether water harvesting goals are met or missed.
📈 MTD & YTD Performance Monitoring
Track short-term results while keeping long-term sustainability goals in focus.
🔁 Current Year vs Previous Year Analysis
Understand growth, decline, and seasonal water availability patterns.
📉 KPI-Wise Trend Analysis
Analyze performance trends using MTD and YTD charts for each KPI.
📘 Clear KPI Definitions
Ensure consistency with built-in KPI units, formulas, and definitions.
⚡ 100% Excel-Based Solution
Easy to use, easy to maintain, and ideal for teams of all sizes.
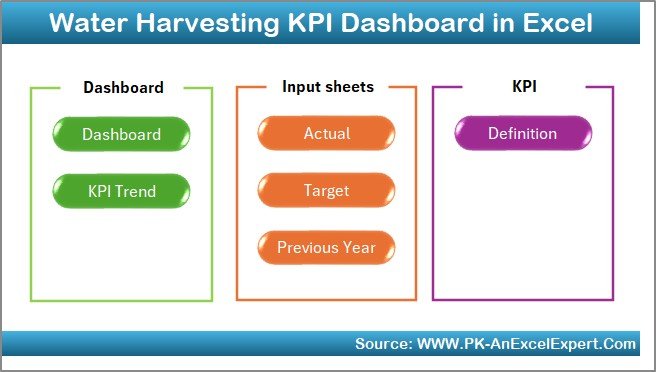
📂 What’s Inside the Water Harvesting KPI Dashboard in Excel
🏠 Home Sheet
A clean index page with navigation buttons for quick, one-click access to all worksheets.
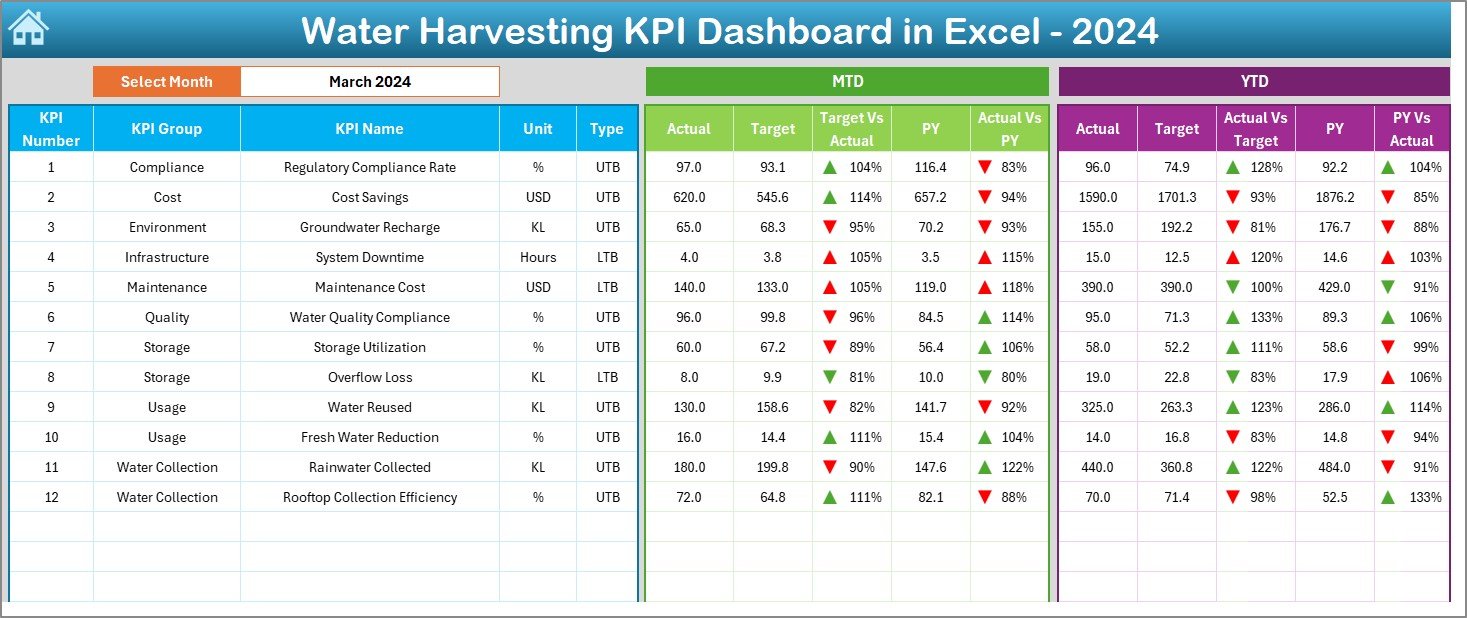
📊 Dashboard Sheet
The main performance page showing MTD and YTD actuals, targets, previous year values, percentages, and visual indicators.
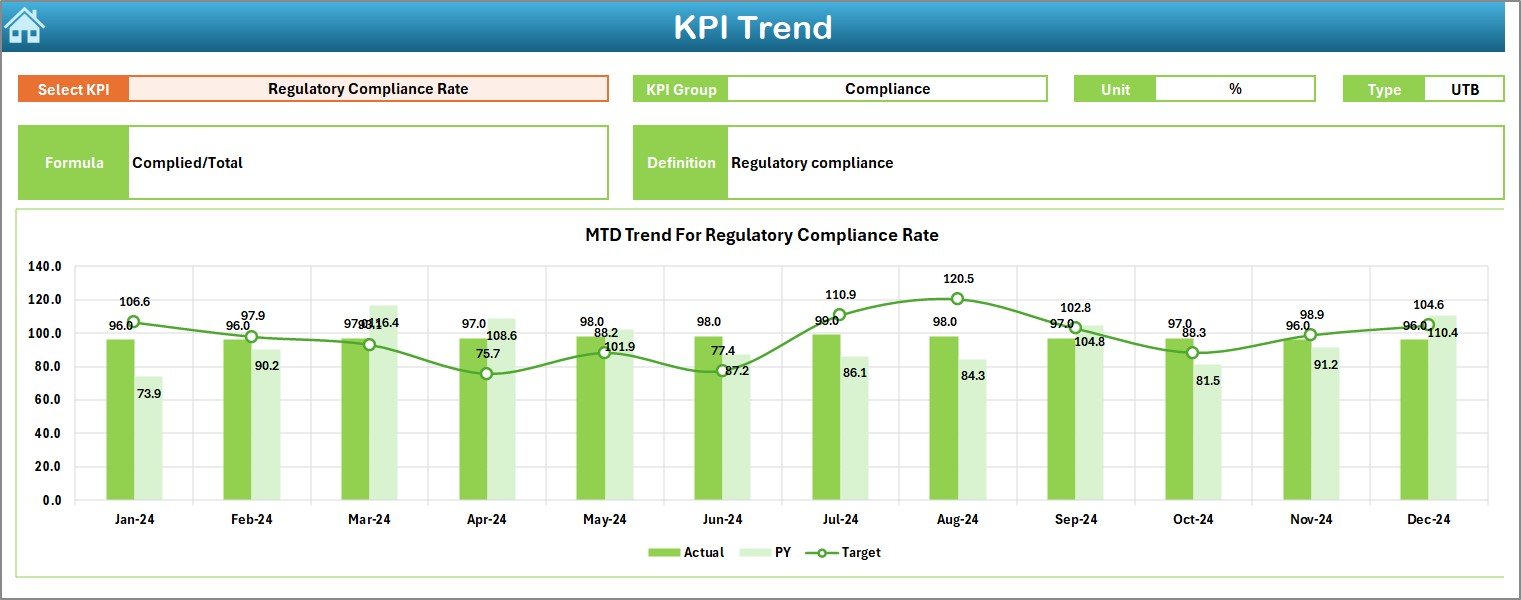
📈 KPI Trend Sheet
Select any KPI and instantly view its MTD and YTD trends along with KPI details.
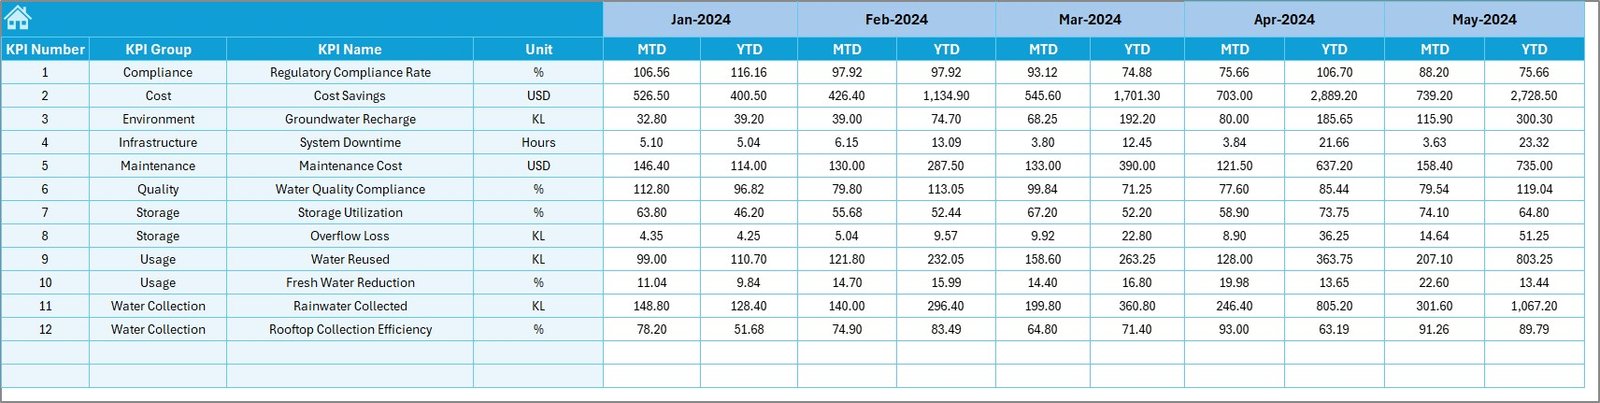
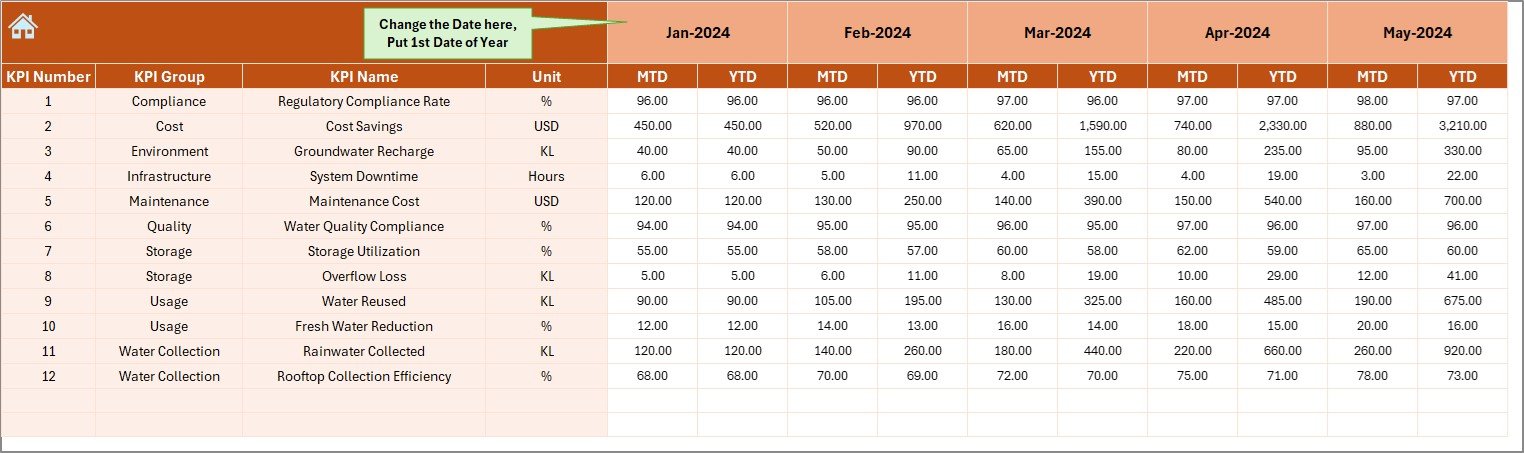
📥 Actual Numbers Input Sheet
Enter real water harvesting data in a structured and controlled format.
🎯 Target Sheet
Define monthly and yearly water harvesting targets for accurate comparison.
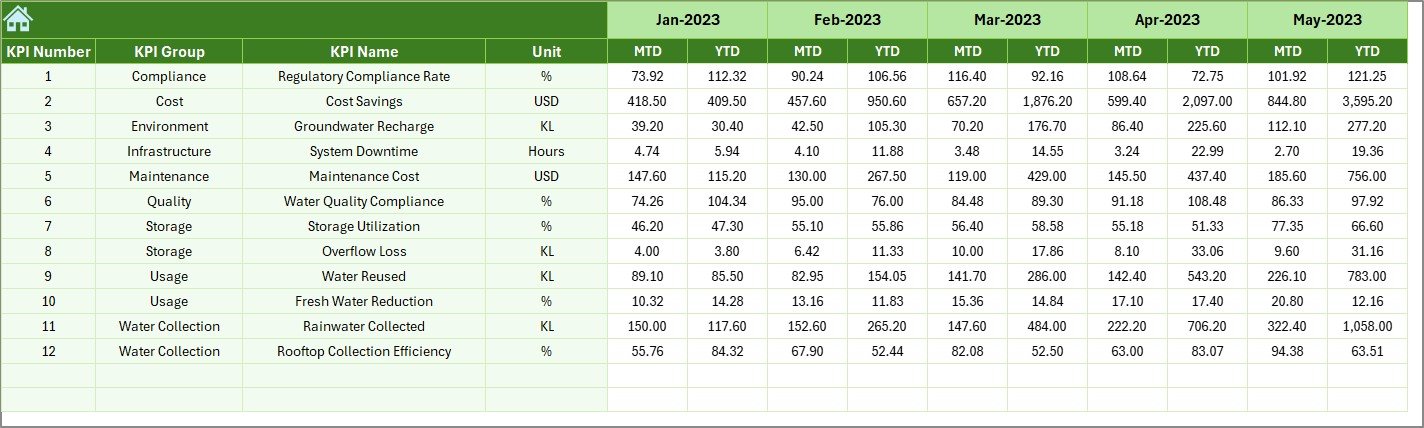
📅 Previous Year Number Sheet
Store last year’s data to support meaningful year-over-year analysis.
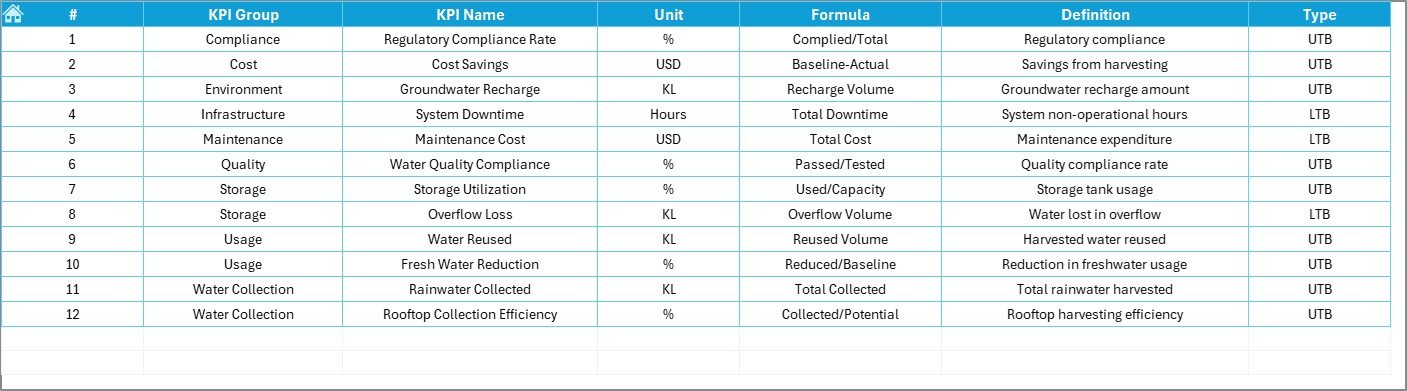
📘 KPI Definition Sheet
Maintain KPI name, group, unit, formula, and definition in one place.
⚙️ How to Use the Water Harvesting KPI Dashboard in Excel
📝 Step 1: Enter Data
Update actual values, targets, and previous year numbers in the respective sheets.
📅 Step 2: Select Month
Choose a month from cell D3 to analyze MTD and YTD performance instantly.
📊 Step 3: Review Dashboard
Use arrows, percentages, and comparisons to identify underperforming KPIs.
📈 Step 4: Analyze Trends
Study seasonal patterns and long-term performance using trend charts.
🎯 Step 5: Take Action
Optimize water harvesting systems and improve efficiency using data-backed insights.
👥 Who Can Benefit from This Water Harvesting KPI Dashboard in Excel
🏙️ Municipal Corporations – Monitor city-level water harvesting performance
🏭 Industrial Facilities – Track compliance and water efficiency
🏢 Facility & Estate Managers – Improve operational water planning
🌱 Sustainability Officers – Measure and report conservation impact
🌍 Environmental Consultants – Support audits and sustainability projects
🏫 Institutions & Campuses – Track water harvesting initiatives clearly
🔍 Click here to read the Detailed blog post
📺 Visit our YouTube channel to learn step-by-step video tutorials
👉 Youtube.com/@PKAnExcelExpert


Reviews
There are no reviews yet.