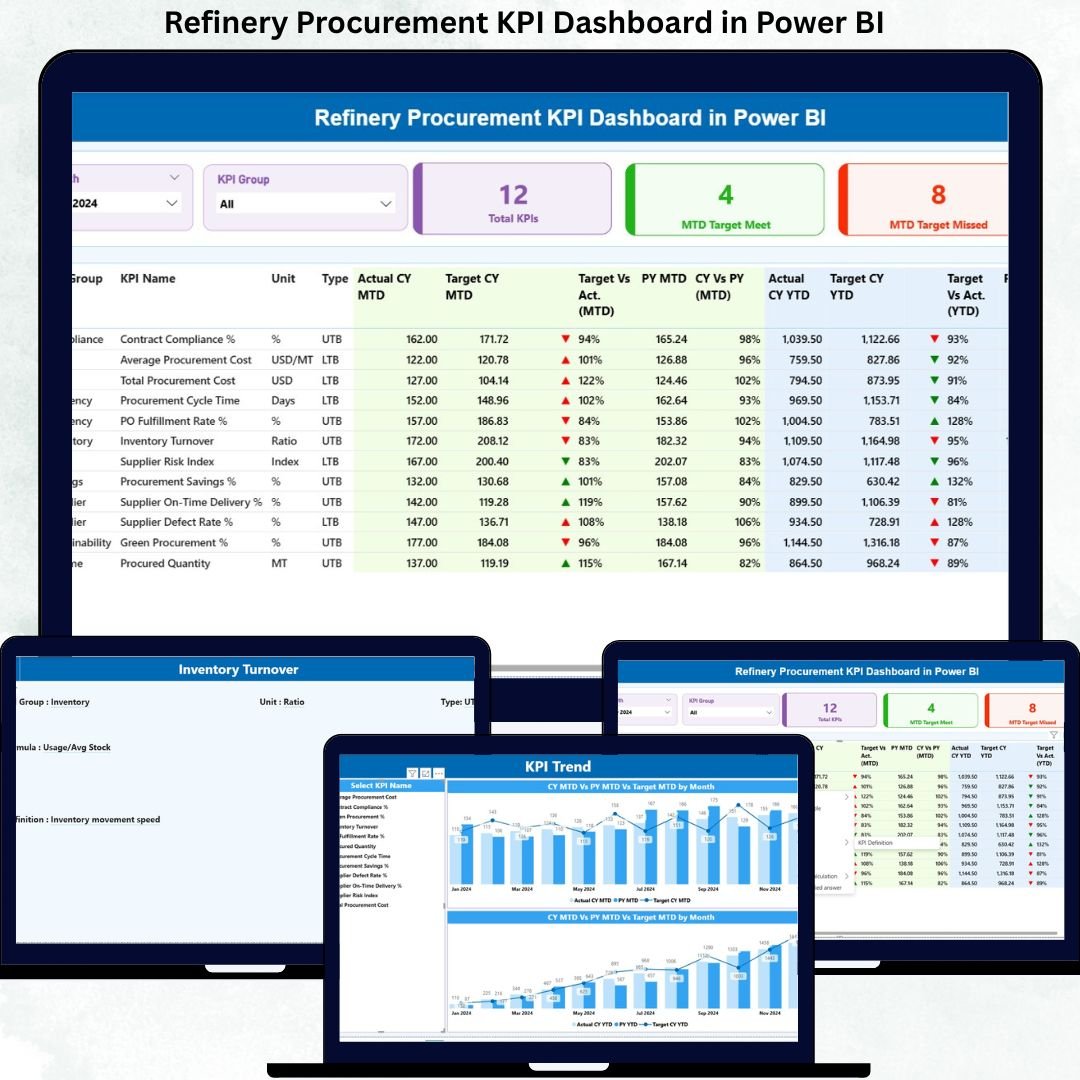
Managing procurement in oil & gas refineries is complex, time-critical, and cost-sensitive. A single delay, deviation, or missed target can impact production continuity, compliance, and profitability. That is exactly why the Refinery Procurement KPI Dashboard in Power BI becomes a must-have decision-making tool.
This ready-to-use, interactive Power BI dashboard transforms raw procurement data into clear KPIs, visual indicators, and actionable insights. Instead of struggling with multiple Excel files and manual reports, procurement teams gain one centralized, decision-ready dashboard to monitor performance with confidence.
Built using Power BI with Excel as the backend, this dashboard remains simple to update, highly scalable, and easy to maintain—without requiring technical expertise.
🚀 Key Features of Refinery Procurement KPI Dashboard in Power BI
📊 Centralized Procurement Performance View
Track all refinery procurement KPIs in one unified Power BI dashboard instead of fragmented reports.
📅 MTD & YTD KPI Tracking
Monitor Month-to-Date and Year-to-Date performance to balance short-term execution and long-term strategy.
🎯 Actual vs Target Comparisons
Instantly identify whether procurement KPIs are meeting or missing targets using clear calculations and visuals.
📈 Current Year vs Previous Year Analysis
Analyze year-over-year trends to spot improvement areas, risks, and performance patterns.
🔴🟢 Visual Status Indicators
Green ▲ and Red ▼ icons instantly highlight KPIs that need urgent attention—no manual analysis required.
🎛️ Interactive Slicers
Filter data by Month and KPI Group to focus on specific procurement categories or time periods.
📂 Excel-Based Data Entry
Update actuals, targets, and definitions directly in Excel—then refresh Power BI with one click.
📦 What’s Inside the Refinery Procurement KPI Dashboard
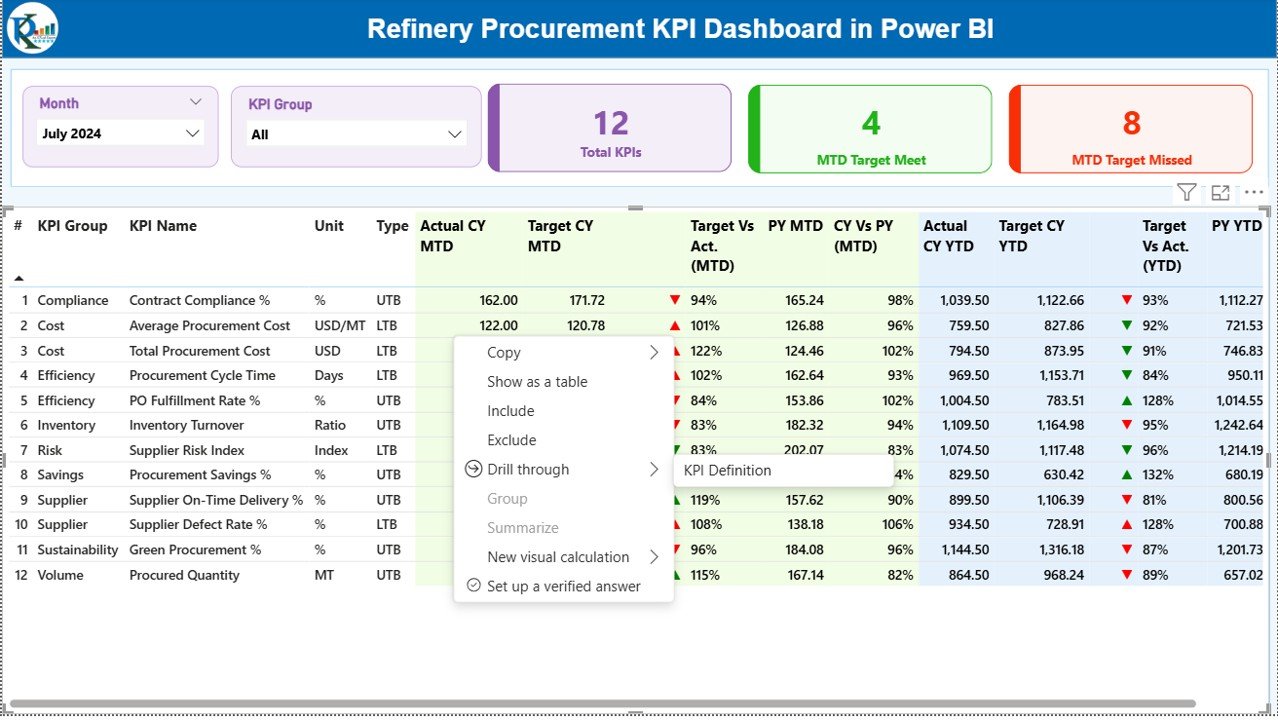
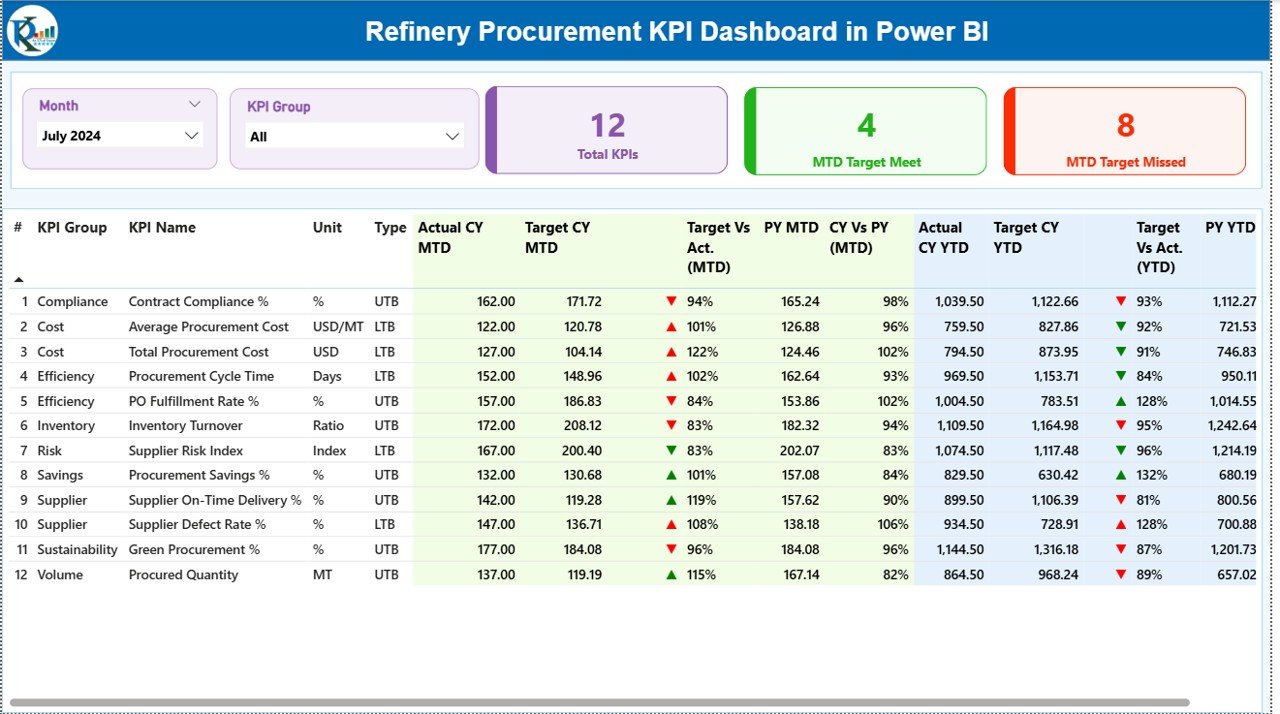
📌 Summary Page (Main Control Center)
-
Month and KPI Group slicers
-
KPI cards showing Total KPIs, Target Met, and Target Missed
-
Detailed KPI table with MTD & YTD performance metrics
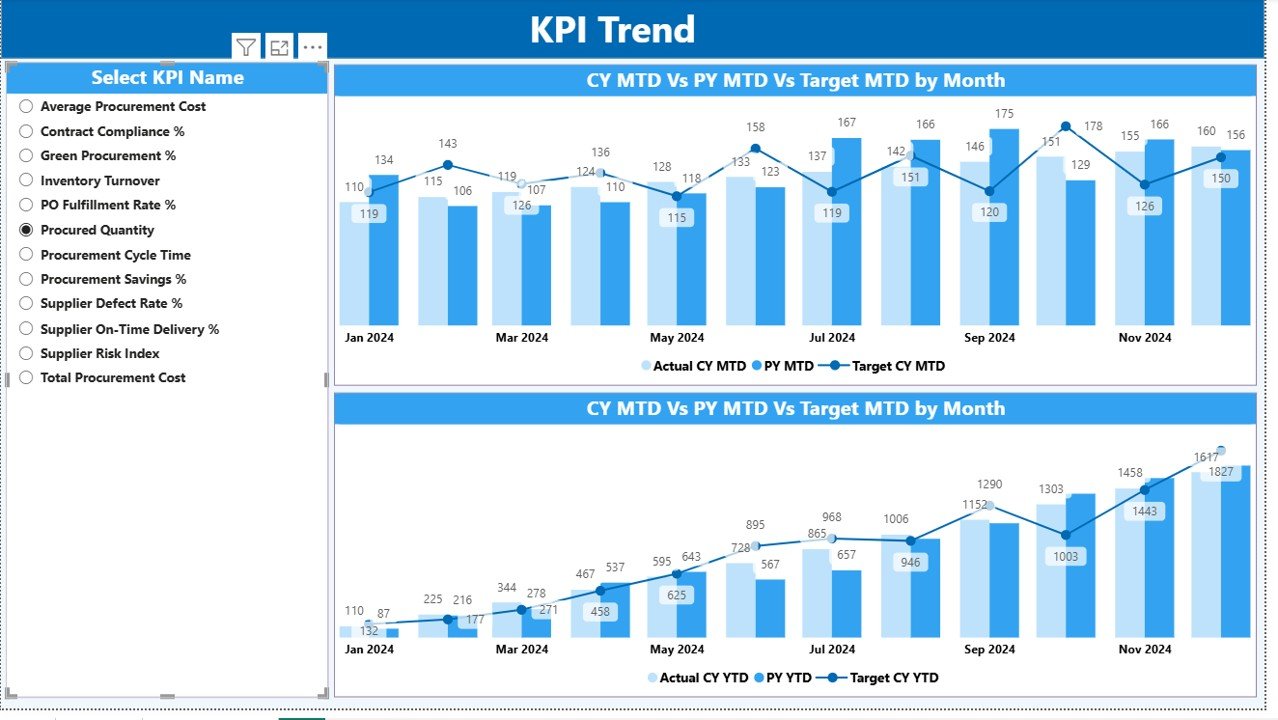
📌 KPI Trend Page
-
MTD Combo Chart
-
YTD Combo Chart
-
KPI selection slicer for focused trend analysis
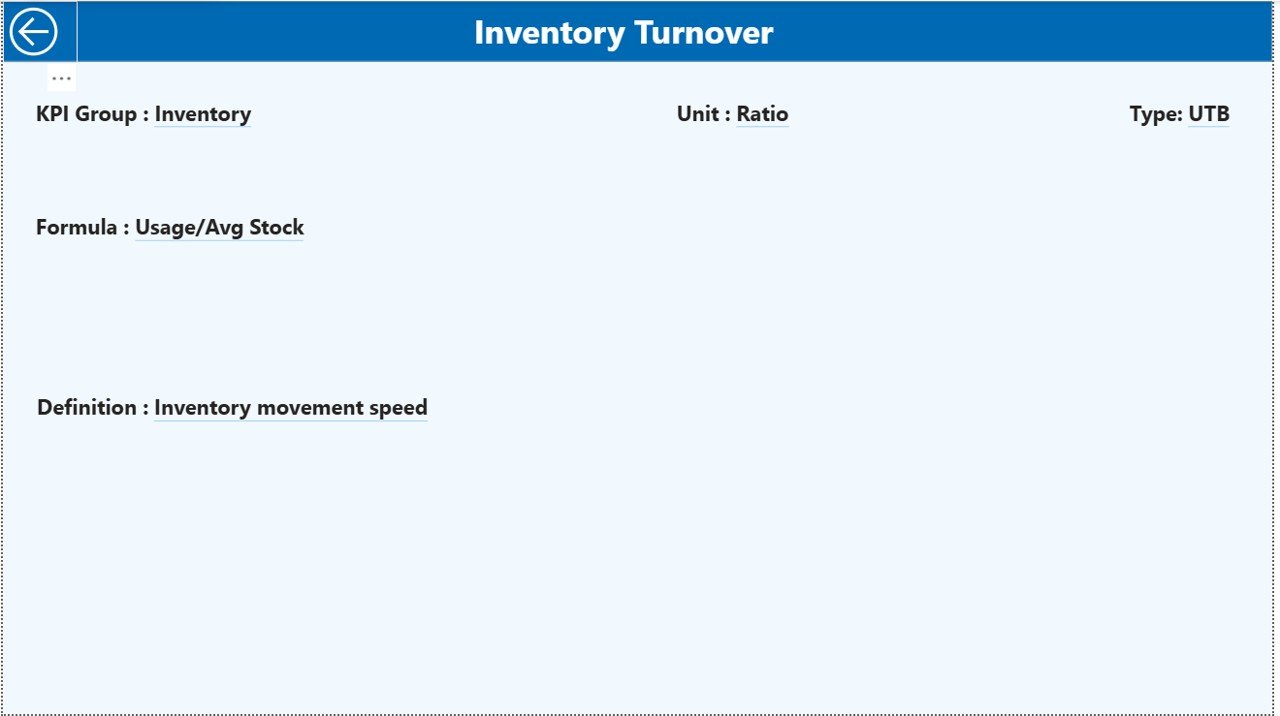
📌 KPI Definition Page (Drill-Through)
-
KPI Number, Name, Group, Unit
-
Formula and definition
-
KPI type (UTB / LTB) for governance and clarity
📌 Excel Data Model
-
Input_Actual sheet
-
Input_Target sheet
-
KPI Definition sheet
Each component works together to deliver accuracy, transparency, and control.
🛠️ How to Use the Refinery Procurement KPI Dashboard
📝 Step 1: Enter actual procurement values in the Excel Input_Actual sheet
🎯 Step 2: Enter target values in the Input_Target sheet
📘 Step 3: Maintain standardized KPIs in the KPI Definition sheet
🔄 Step 4: Refresh Power BI visuals
📊 Step 5: Analyze insights using slicers, icons, and trend charts
Because Power BI handles all calculations automatically, users focus only on analysis and decisions—not manual work.
👥 Who Can Benefit from This Refinery Procurement KPI Dashboard
👷 Procurement Managers – Monitor targets, deviations, and efficiency
🚚 Supply Chain Leaders – Improve vendor and material planning
🏭 Operations Heads – Ensure uninterrupted production support
💰 Finance Teams – Track procurement cost performance
📊 Plant Management – Gain executive-level visibility
📐 Strategy & Planning Teams – Support data-driven procurement decisions
Both technical and non-technical users can use this dashboard with ease.


Reviews
There are no reviews yet.