Managing clinic projects without structured performance tracking often results in missed deadlines, budget overruns, and unclear accountability. Modern clinics simultaneously manage infrastructure upgrades, IT implementations, equipment installations, accreditation initiatives, and expansion projects. Therefore, relying on manual reports or scattered Excel files is no longer effective.
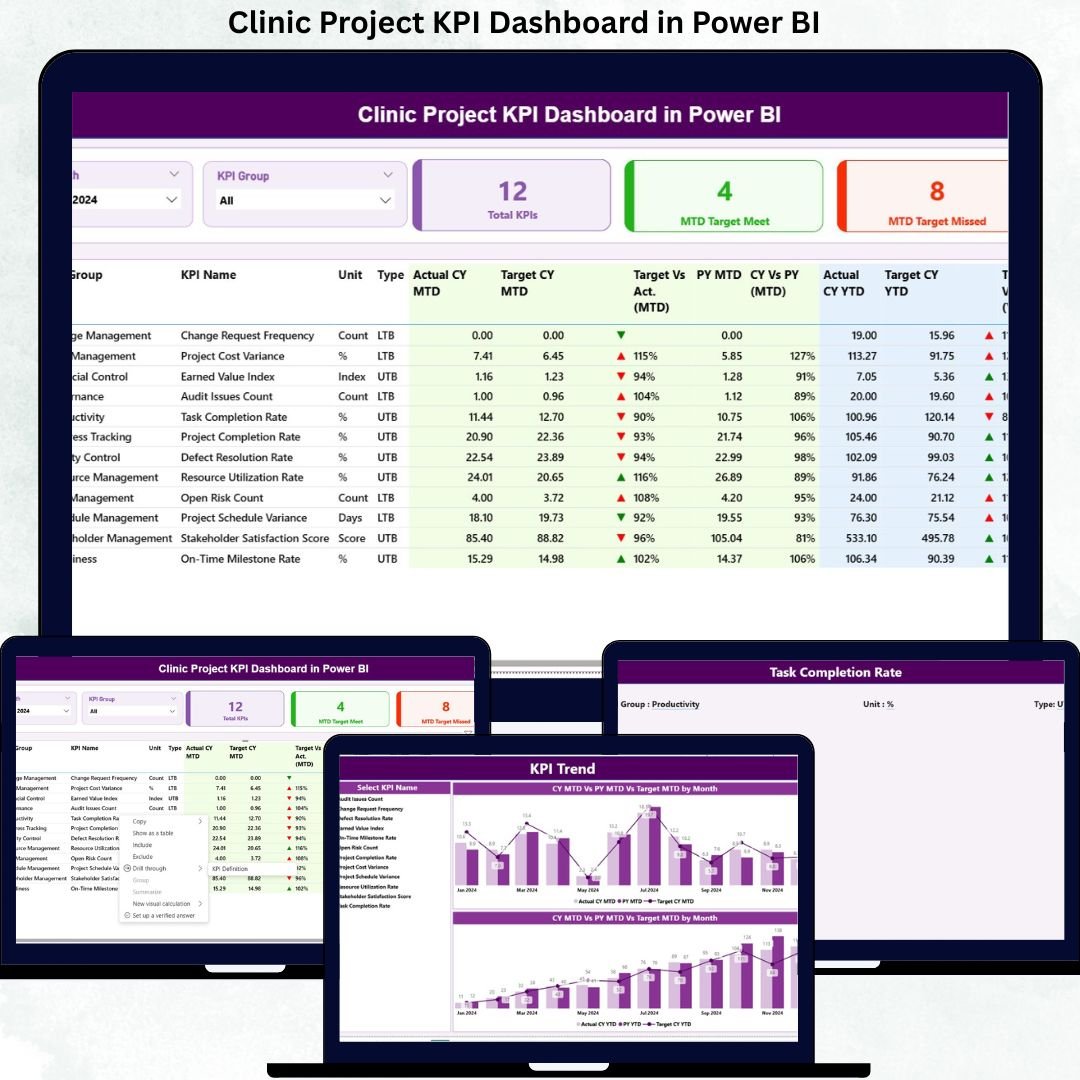
That is exactly where the Clinic Project KPI Dashboard in Power BI becomes a powerful and practical solution. This ready-to-use dashboard transforms raw project data into meaningful KPIs, visual indicators, and actionable insights—helping clinic leaders monitor performance in real time and take confident, data-driven decisions.
Built using Power BI with Excel as the data source, this dashboard offers the perfect balance of flexibility, simplicity, and advanced analytics. As a result, clinics gain complete visibility into project execution without complex system integrations.
🔑 Key Features of Clinic Project KPI Dashboard in Power BI
📊 Centralized Project Performance Monitoring
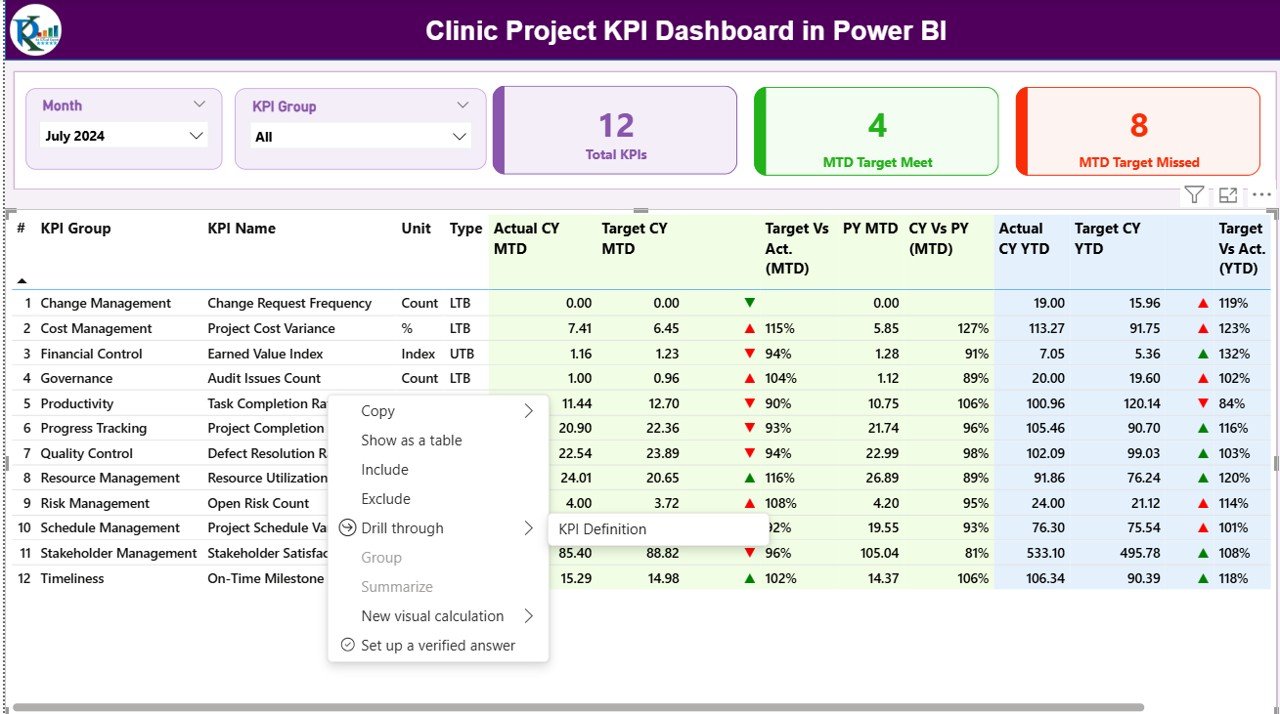
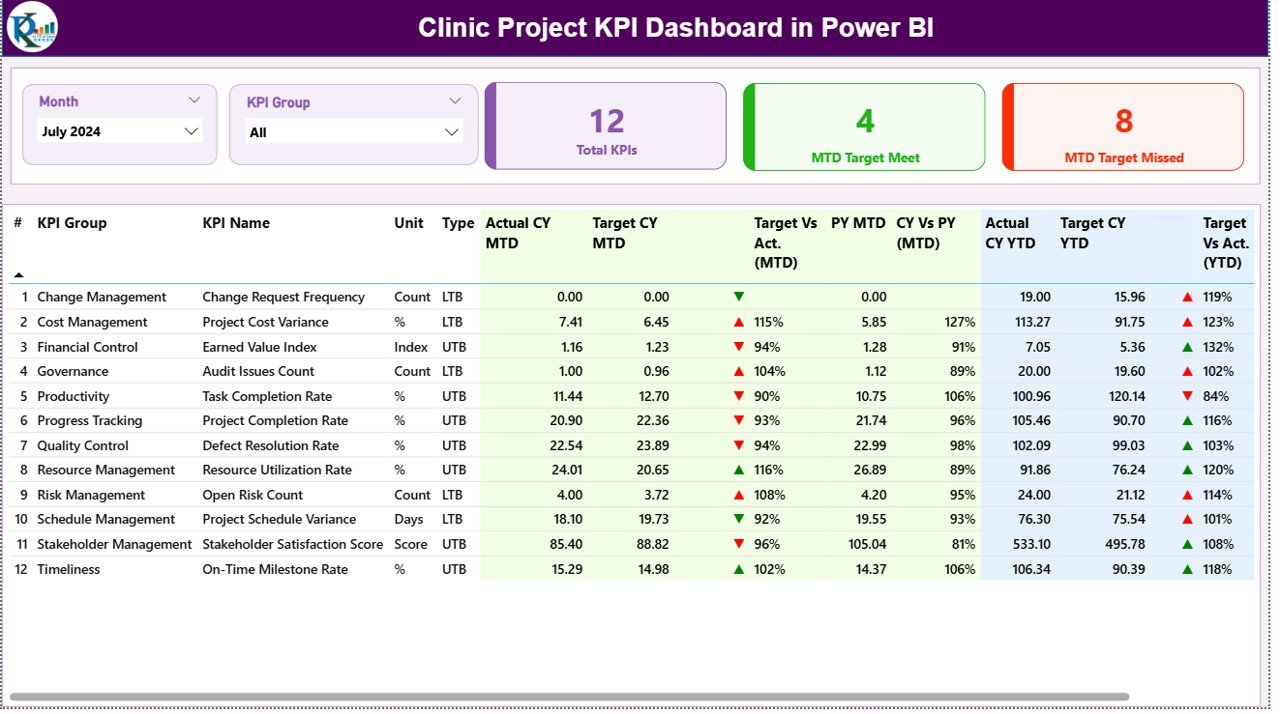
Track all clinic project KPIs from a single interactive dashboard instead of managing multiple files.
📅 Dynamic Month & KPI Group Slicers
Filter project KPIs instantly by reporting month or project category for focused analysis.
🎯 MTD & YTD Target vs Actual Tracking
Monitor Month-to-Date and Year-to-Date performance with automated calculations.
🚦 Visual Status Indicators (LTB & UTB Logic)
Instantly identify overperforming and underperforming KPIs using color-coded arrows.
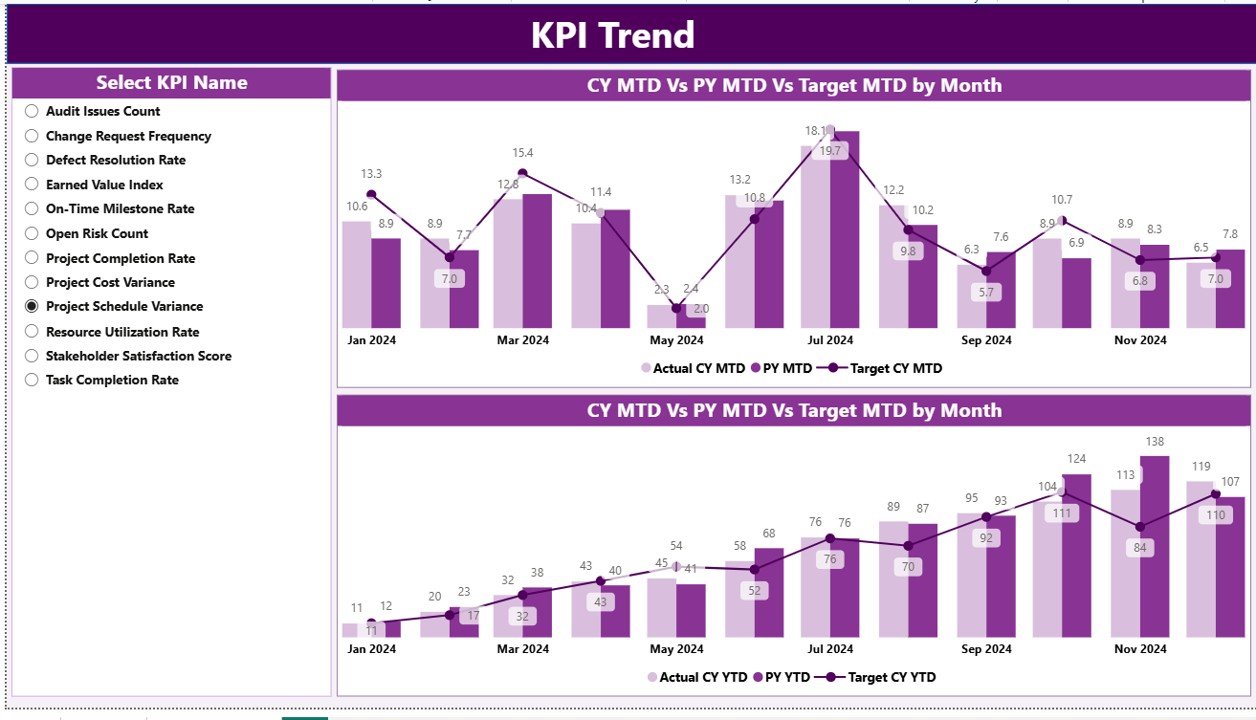
📈 Trend Analysis with Combo Charts
Analyze KPI performance over time with Current Year, Previous Year, and Target comparisons.
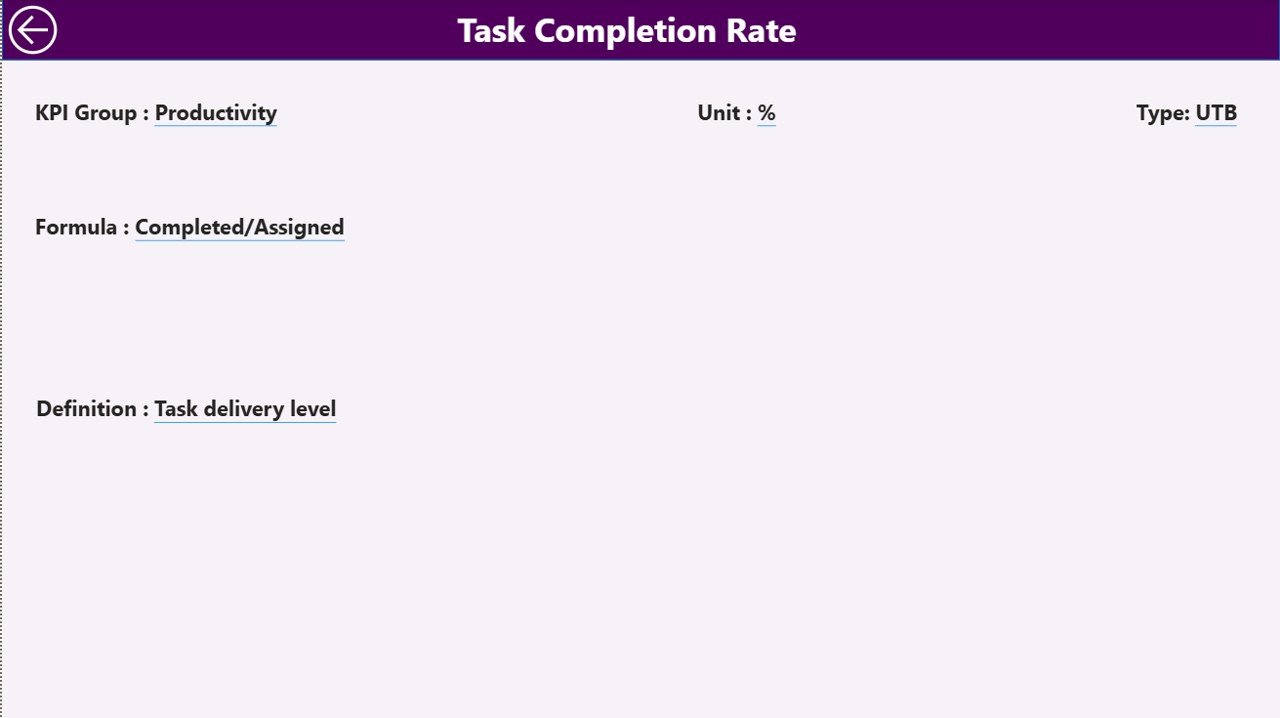
📘 KPI Definition & Governance Page
Maintain consistency with a dedicated KPI definition page showing formulas, units, and logic.
📂 Excel-Based Data Input
Update actuals and targets easily using structured Excel sheets—no technical skills required.
⚡ Ready-to-Use Power BI Model
Deploy quickly without complex setup or data modeling.
📦 What’s Inside the Clinic Project KPI Dashboard
This digital product includes a professionally designed Power BI (.pbix) file and a structured Excel input template.
Power BI Pages Included:
-
Summary Page – KPI cards, slicers, and detailed KPI table
-
KPI Trend Page – MTD & YTD trend analysis with combo charts
-
KPI Definition Page – Drill-through governance and reference page
Excel Worksheets Included:
-
Input_Actual – Enter actual MTD and YTD values
-
Input_Target – Enter target MTD and YTD values
-
KPI Definition – Define KPI metadata, formula, and logic
This structure ensures clean data modeling, accurate calculations, and smooth dashboard performance.
🛠️ How to Use the Clinic Project KPI Dashboard
1️⃣ Enter actual project data in the Input_Actual Excel sheet
2️⃣ Update targets in the Input_Target sheet
3️⃣ Maintain KPI definitions in the KPI Definition sheet
4️⃣ Refresh the Power BI report
5️⃣ Use slicers to analyze KPIs by month and group
6️⃣ Review MTD & YTD performance, trends, and status indicators
7️⃣ Drill through to KPI definitions during review meetings
That’s it—no complex configuration required.
👥 Who Can Benefit from This Clinic Project KPI Dashboard
🏥 Clinic Administrators – Gain high-level visibility into project performance
📋 Project Managers – Track timelines, targets, and risks effectively
⚙️ Operations Teams – Monitor execution efficiency across projects
💰 Finance & Planning Teams – Control budgets and performance alignment
📊 Senior Management – Support strategic, data-driven decisions
✅ Quality & Compliance Teams – Improve transparency and governance
Click here to read the Detailed Blog Post
Watch the step-by-step video tutorial:


Reviews
There are no reviews yet.