
Smart city projects demand clarity, speed, and accountability. However, when teams rely on scattered spreadsheets, delayed reports, and manual tracking, decision-making becomes slow and risky. That is exactly why the Smart Cities Project KPI Dashboard in Excel is designed—to give you instant visibility, structured monitoring, and confident control over complex smart city initiatives.
This professionally built Excel dashboard converts raw project data into clear, visual, and actionable insights. Moreover, it helps project teams track timelines, budgets, targets, and performance trends—without expensive BI tools or technical complexity. If you manage smart city projects and want transparency with speed, this dashboard is built for you.
🚀 Key Features of Smart Cities Project KPI Dashboard in Excel
📊 Centralized KPI Monitoring
Track all smart city project KPIs in a single Excel file instead of managing multiple disconnected reports.
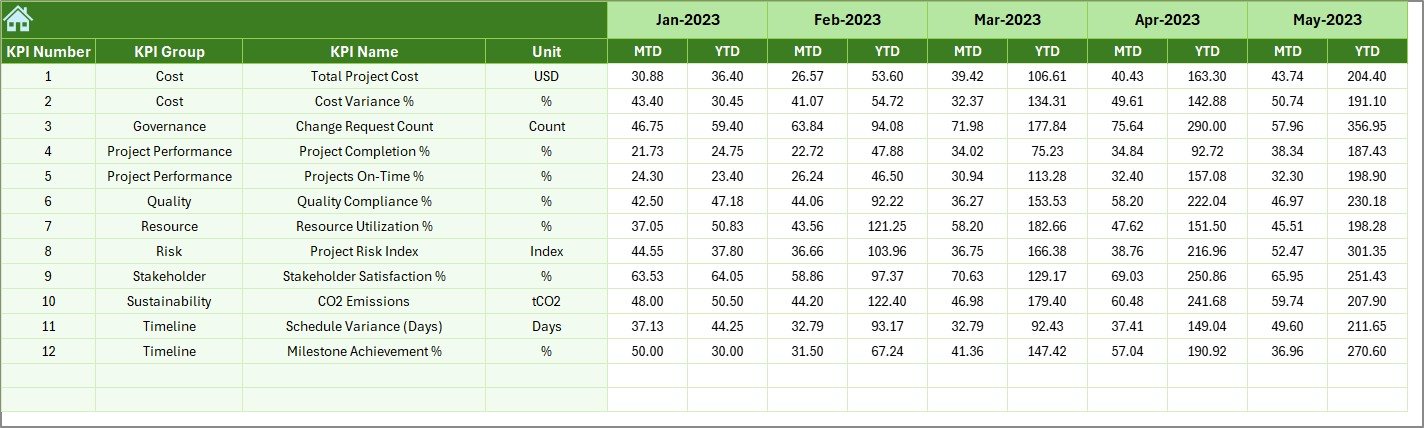
📅 MTD & YTD Performance Tracking
Analyze Month-to-Date and Year-to-Date Actuals, Targets, and Previous Year values in one unified dashboard view.
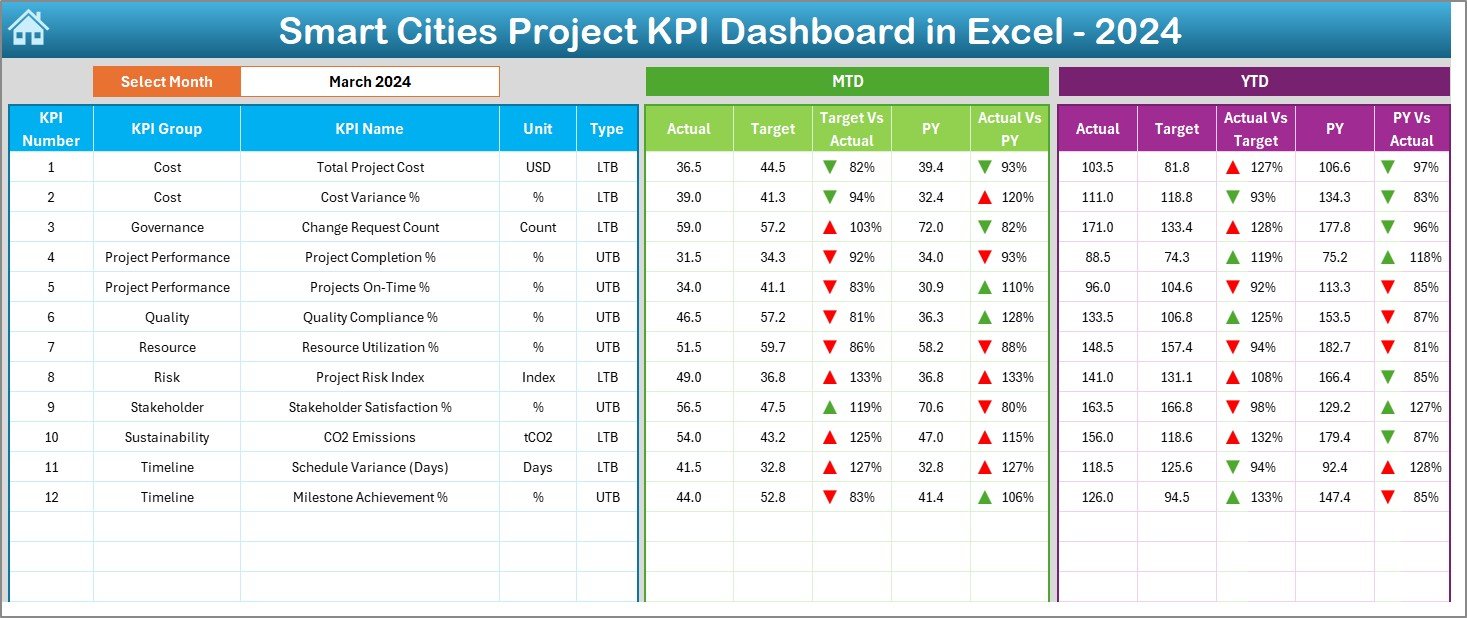
🎯 Target vs Actual Analysis
Automatically calculate variances and instantly identify performance gaps using visual indicators.
📉 Previous Year Comparison
Compare current project performance with historical data to evaluate progress and long-term trends.
📈 Interactive Trend Analysis
Dynamic trend charts help you identify patterns, risks, and improvement opportunities early.
🧭 User-Friendly Navigation
A dedicated summary page allows instant navigation across dashboard sections for faster insights.
💡 Excel-Powered Automation
Built using formulas, pivot tables, and conditional formatting—no coding or BI tools required.
📂 What’s Inside the Smart Cities Project KPI Dashboard in Excel
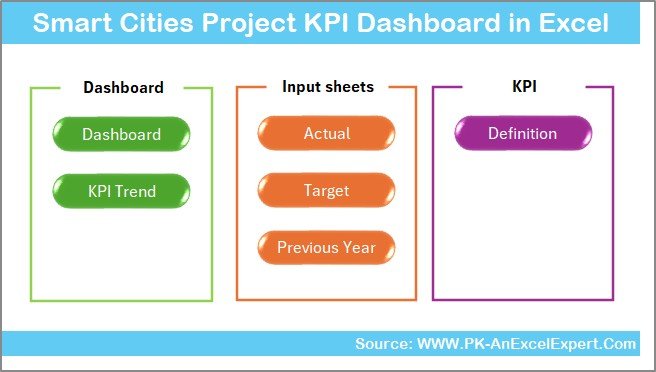
This dashboard includes 7 structured worksheets, each designed for a specific analytical purpose:
📌 Summary Page – Acts as the landing page with navigation buttons for smooth movement across the dashboard.
📌 Dashboard Sheet – Displays all KPIs with dynamic month selection (Cell D3), showing MTD & YTD performance.
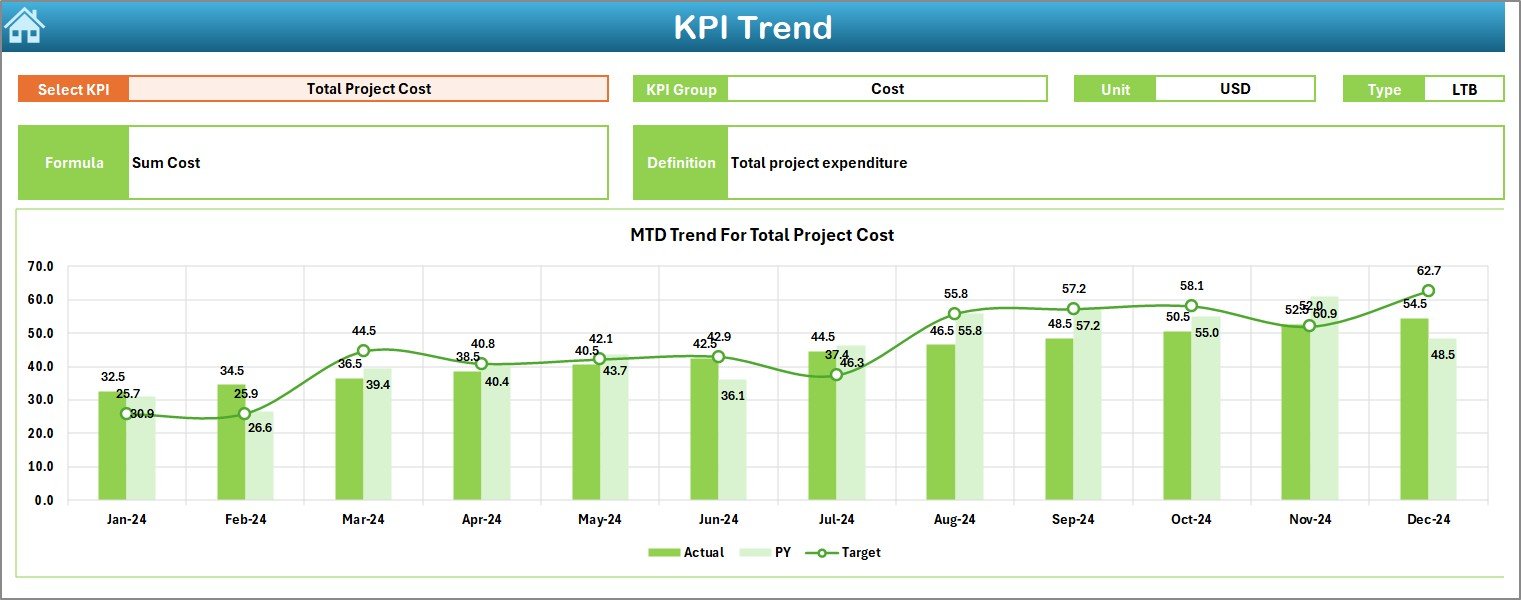
📌 Trend Sheet – Provides KPI-level analysis with dropdown selection and MTD/YTD trend charts.
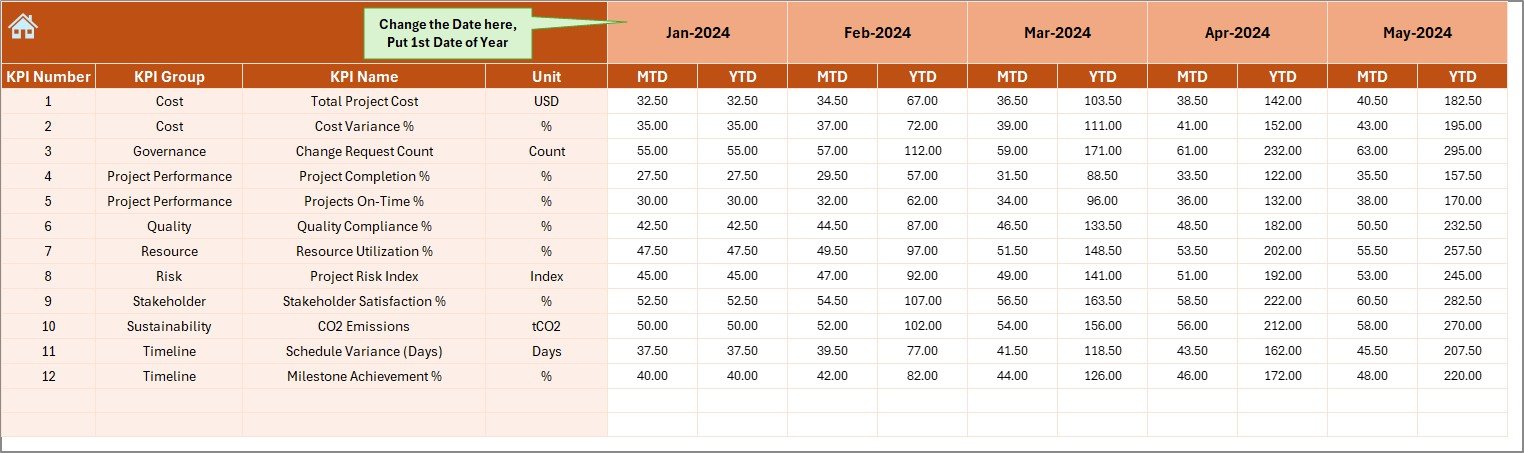
📌 Actual Numbers Input Sheet – Structured data entry for actual performance values with month-based control.
📌 Target Sheet – Enables KPI-wise monthly and YTD target planning.
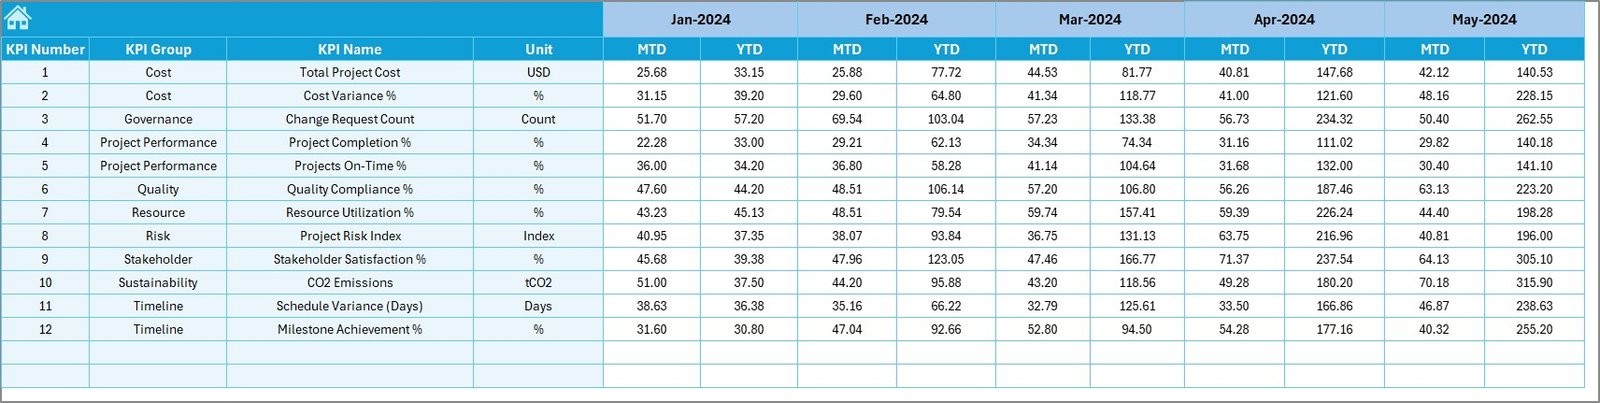
📌 Previous Year Numbers Sheet – Supports year-over-year comparison and benchmarking.
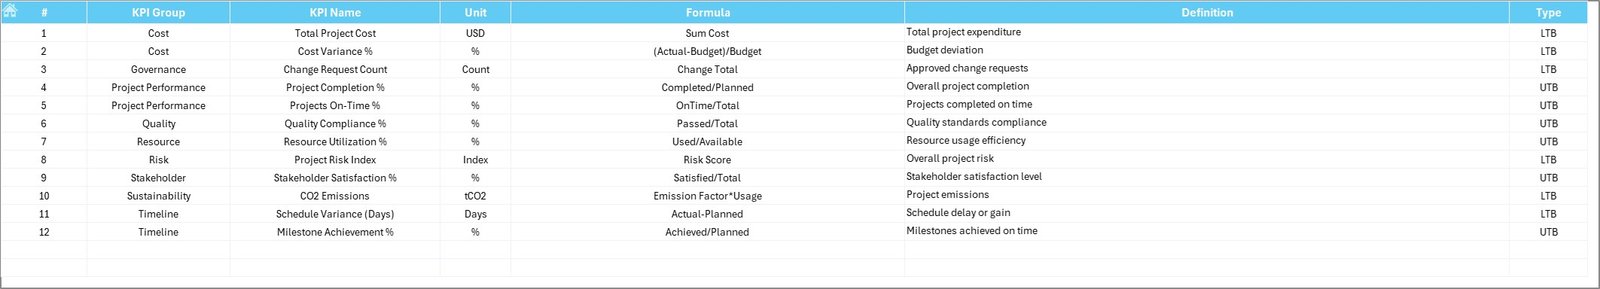
📌 KPI Definition Sheet – Clearly defines KPI names, formulas, units, and interpretations for consistency.
Together, these sheets create a complete performance management system for smart city projects.
🛠️ How to Use the Smart Cities Project KPI Dashboard in Excel
Using this dashboard is simple and intuitive:
1️⃣ Define KPIs clearly in the KPI Definition Sheet
2️⃣ Enter monthly actual data in the Actual Numbers Input Sheet
3️⃣ Set targets in the Target Sheet
4️⃣ Add previous year values for comparison
5️⃣ Select the desired month from the dropdown
6️⃣ Instantly view updated KPIs, trends, and variances
As a result, decision-makers get real-time insights without manual calculations.
👥 Who Can Benefit from This Smart Cities Project KPI Dashboard
This dashboard is ideal for professionals involved in smart city execution and governance:
🏛️ Smart City Project Managers
🏙️ Urban Development Authorities
📊 Program Management Offices (PMOs)
🏗️ Infrastructure & Utility Consultants
🌱 Sustainability & Mobility Teams
🧾 Government Planning Departments
Whether you manage a single project or multiple initiatives, this dashboard adapts to your needs.
Click here to read the Detailed blog post
Watch the step-by-step video tutorial:
👉 Visit our YouTube channel to learn step-by-step video tutorials


Reviews
There are no reviews yet.