
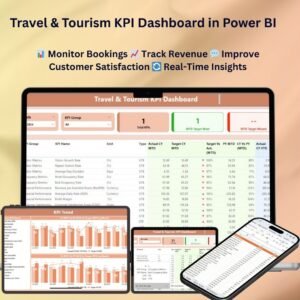
The Travel & Tourism KPI Dashboard in Power BI is a powerful tool designed for travel agencies, tourism boards, and tour operators to track, analyze, and visualize key performance indicators (KPIs) related to bookings, customer satisfaction, revenue, and operational efficiency. This interactive and customizable dashboard allows you to monitor essential business metrics in real time and make data-driven decisions to improve your services and maximize profits.
Whether you’re tracking the number of bookings, analyzing travel trends, or evaluating customer feedback, this Power BI dashboard provides a comprehensive and easy-to-understand overview of your business performance.

Key Features of the Travel & Tourism KPI Dashboard in Power BI
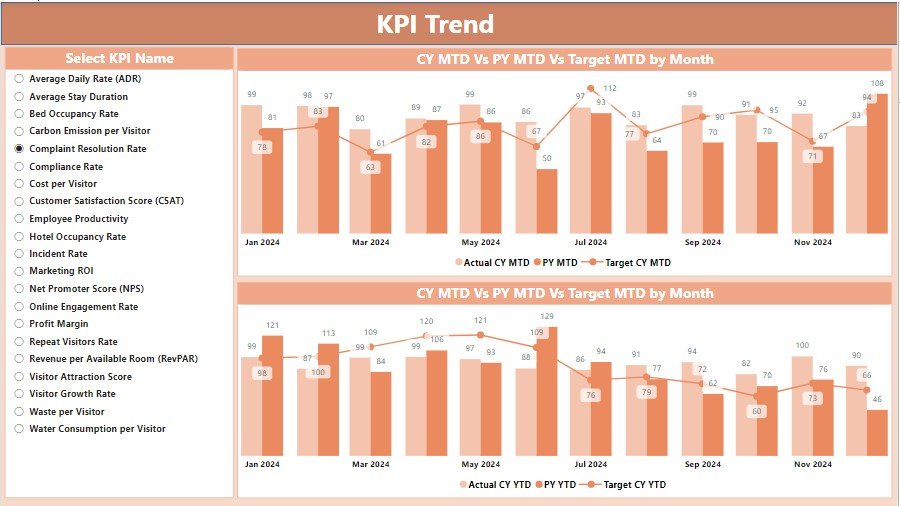
📊 Real-Time Data Visualization: Track KPIs such as booking trends, customer satisfaction, and revenue in real time.
⚙️ Customizable KPIs: Tailor the dashboard to track the most relevant metrics specific to your travel and tourism business, including booking types, destinations, and seasonal trends.
📈 Revenue and Profit Tracking: Monitor revenue generation, profit margins, and booking performance to optimize pricing strategies.
📅 Time-Based Insights: Track trends over different time periods, such as weekly, monthly, or yearly, to assess long-term performance.
📉 Customer Satisfaction Monitoring: Track feedback, ratings, and customer reviews to improve service offerings and enhance customer experience.
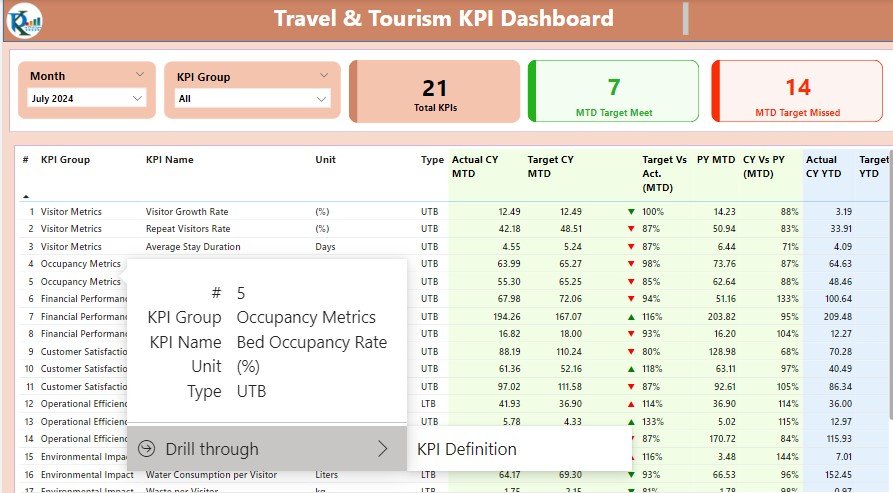
🔄 Interactive Dashboard: Drill down into specific KPIs to get a detailed analysis of performance metrics and uncover actionable insights.
🧑💼 User-Friendly Interface: A simple and intuitive layout that makes it easy to navigate and understand key business metrics.
Why You’ll Love the Travel & Tourism KPI Dashboard in Power BI
✅ Streamlines Performance Tracking: Monitor the health of your travel and tourism business by tracking key metrics from bookings to customer feedback.
✅ Data-Driven Decisions: Make better decisions based on real-time data, helping you adapt to changing trends and market demands.
✅ Improves Operational Efficiency: Track customer trends, booking volumes, and seasonal patterns to optimize business operations.
✅ Customizable for Your Business: Adapt the dashboard to meet the unique needs of your business, whether you’re focused on leisure travel, corporate bookings, or event management.
✅ Real-Time Customer Insights: Monitor customer satisfaction and feedback to enhance your offerings and improve guest experience.
What’s Inside the Travel & Tourism KPI Dashboard in Power BI?
📊 Booking Trends: Track the number of bookings, cancellations, and average booking values.
📈 Revenue and Profit Metrics: Visualize revenue generation, booking profitability, and revenue growth over time.
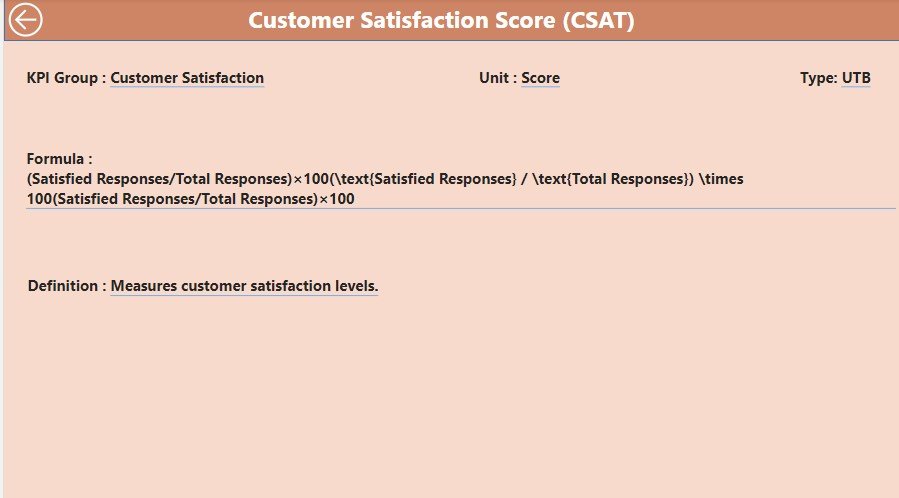
⚙️ Customer Feedback Tracking: Analyze ratings, reviews, and customer satisfaction to gauge service quality.
📉 Seasonal Trends: Monitor seasonal booking patterns and customer behavior to optimize marketing strategies.
🔄 Interactive Features: Drill down into detailed data points for deeper insights into customer behavior and business performance.
How to Use the Travel & Tourism KPI Dashboard in Power BI
1️⃣ Download the Dashboard Template – Get immediate access to the Power BI file.
2️⃣ Customize KPIs: Tailor the dashboard to track metrics specific to your travel and tourism services.
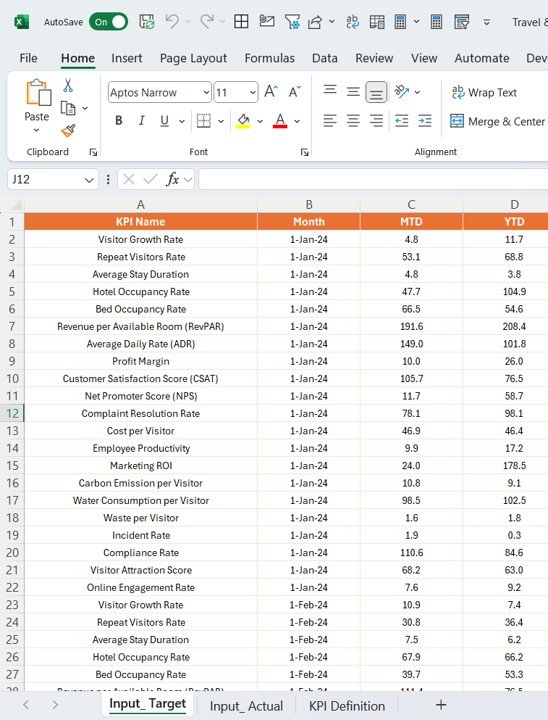
3️⃣ Connect Your Data: Link your travel booking and customer data to Power BI for real-time updates.
4️⃣ Monitor and Analyze: Use the dashboard to track performance, uncover trends, and analyze customer behavior.
5️⃣ Generate Reports: Produce detailed reports for leadership and decision-makers to review key findings and insights.
Who Can Benefit from the Travel & Tourism KPI Dashboard in Power BI?
🔹 Travel Agencies
🔹 Tour Operators
🔹 Destination Management Organizations
🔹 Event Planners
🔹 Tourism Boards
🔹 Marketing Teams in Travel Industry
🔹 Customer Service Managers
Optimize bookings, customer satisfaction, and overall performance with this customizable and data-driven Power BI dashboard.
Click here to read the detailed blog post
Visit our YouTube channel to learn step-by-step video tutorials


Reviews
There are no reviews yet.