

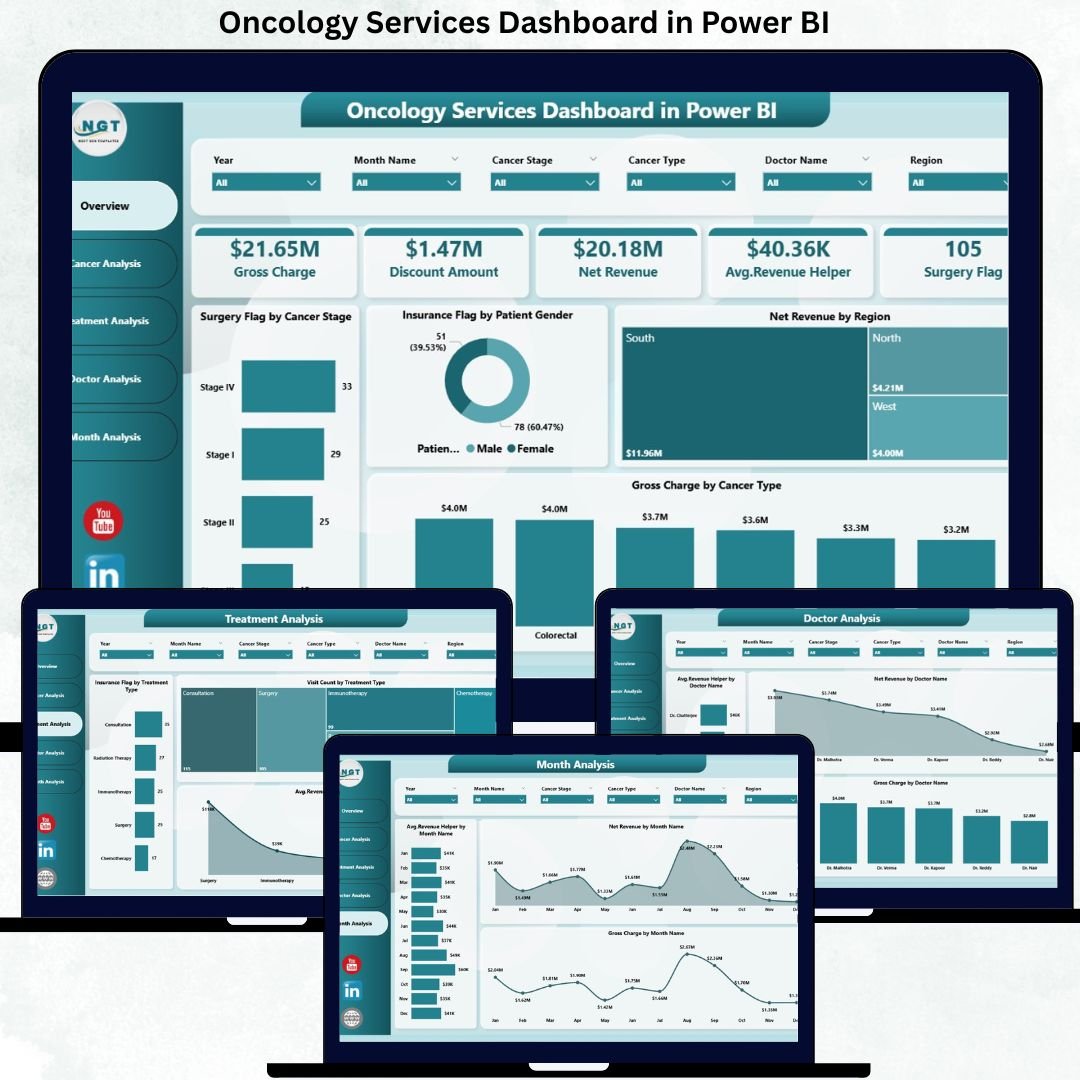

Modern Oncology Services Dashboard operate in one of the most complex areas of healthcare. Cancer treatment involves multiple care pathways, advanced procedures, high treatment costs, strict regulations, and detailed financial tracking. However, many hospitals and cancer centers still depend on static Excel reports and fragmented data sources. As a result, leadership teams struggle to gain timely insights, doctors lack performance visibility, and finance teams face challenges in tracking revenue accurately. That is exactly why the Oncology Services Dashboard in Power BI has become an essential digital solution for oncology-driven organizations.
This ready-to-use Power BI dashboard transforms raw oncology data into a centralized, interactive, and visually powerful reporting system. Instead of reviewing multiple reports, stakeholders can analyze cancer performance, treatments, doctor contribution, patient demographics, and revenue trends in one unified dashboard. As a result, decisions become faster, clearer, and fully data-driven.
Because this dashboard is built using Power BI, it offers dynamic filtering, drill-down analysis, and real-time visual updates. Users can explore data by cancer type, treatment method, doctor, region, gender, and time period without relying on manual calculations. Consequently, oncology departments gain operational efficiency while finance teams improve revenue visibility and control.
🔑 Key Features of Oncology Services Dashboard in Power BI
🧬 Centralized Oncology Performance View – Monitor cancer services, treatments, doctors, revenue, and trends in one interactive dashboard.
📊 Executive KPI Cards & Visuals – Instantly understand performance using high-impact cards and charts.
🎛️ Dynamic Slicers – Filter insights by cancer type, treatment type, doctor, region, gender, and month.
📈 Multi-Dimensional Analysis – Analyze oncology data across clinical, operational, and financial dimensions.
⚡ Automated & Real-Time Insights – Reduce manual reporting and improve decision speed with Power BI automation.
📂 What’s Inside the Oncology Services Dashboard in Power BI
This professionally designed dashboard includes five structured and insight-driven pages, each focused on a specific analysis area:
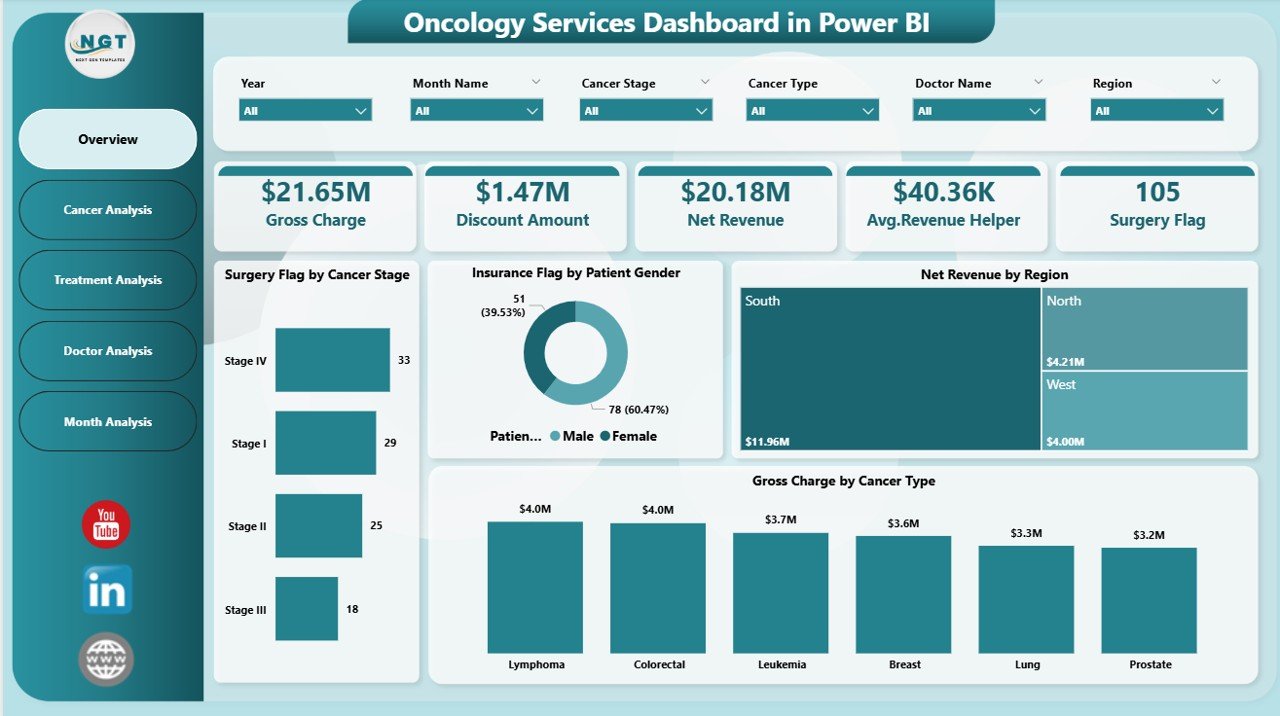
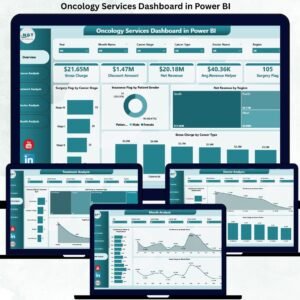
📊 Overview Page – A high-level snapshot with KPI cards and visuals such as Surgery Flag by Cancer Stage, Insurance Flag by Patient Gender, Net Revenue by Region, and Gross Charge by Cancer Type.
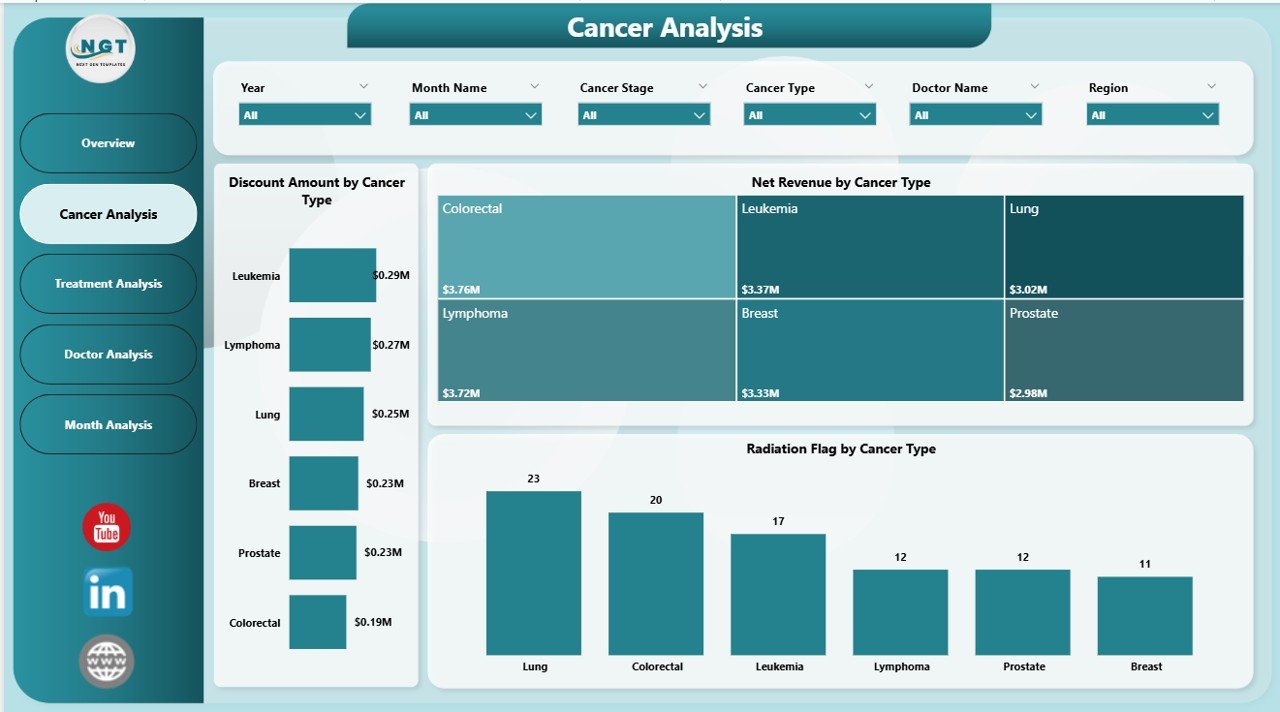
🧪 Cancer Analysis Page – Deep dive into cancer-wise performance using Discount Amount, Net Revenue, and Radiation Flag by Cancer Type.
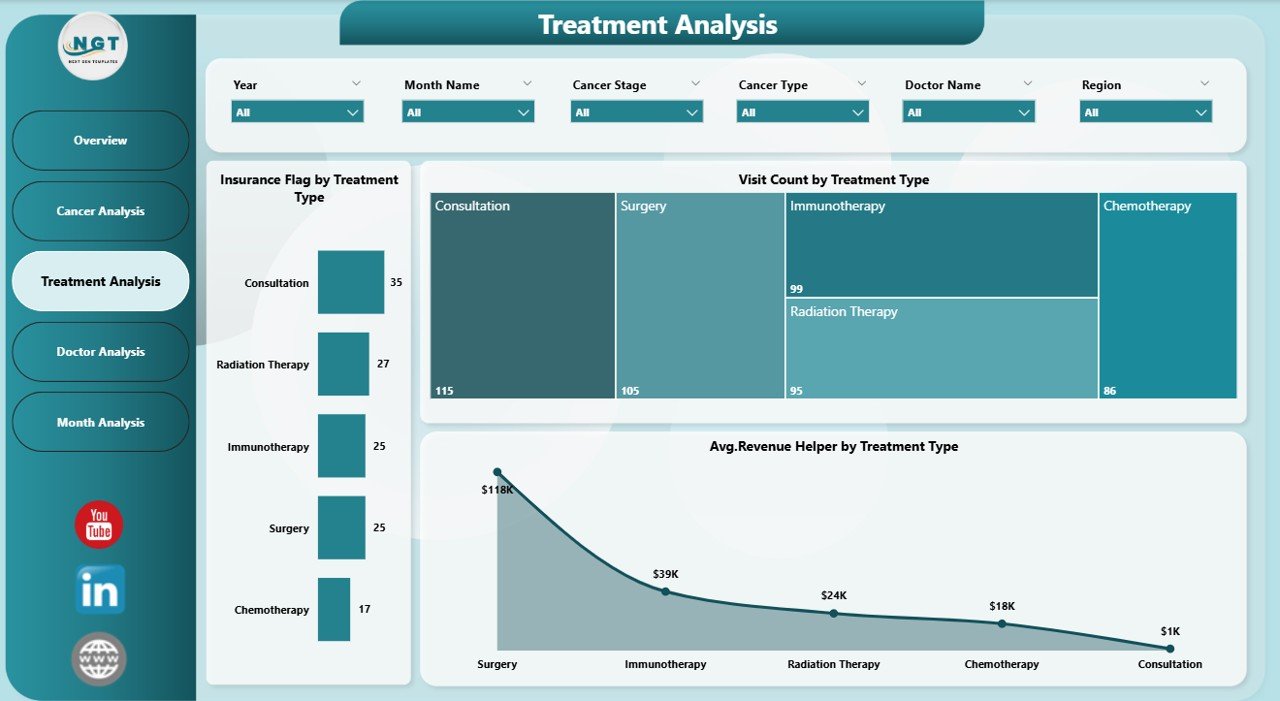
💊 Treatment Analysis Page – Analyze treatment-level metrics including Insurance Flag, Visit Count, and Average Revenue by Treatment Type.
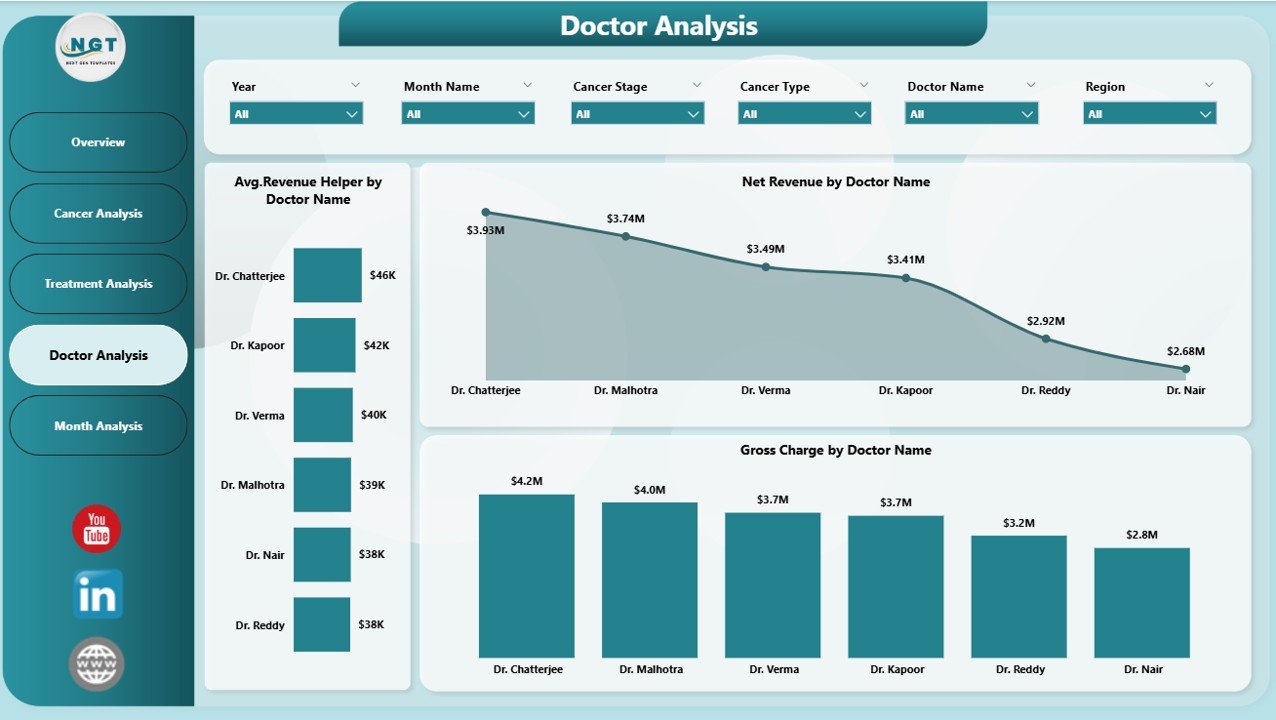
👨⚕️ Doctor Analysis Page – Evaluate physician contribution with Average Revenue, Net Revenue, and Gross Charge by Doctor Name.
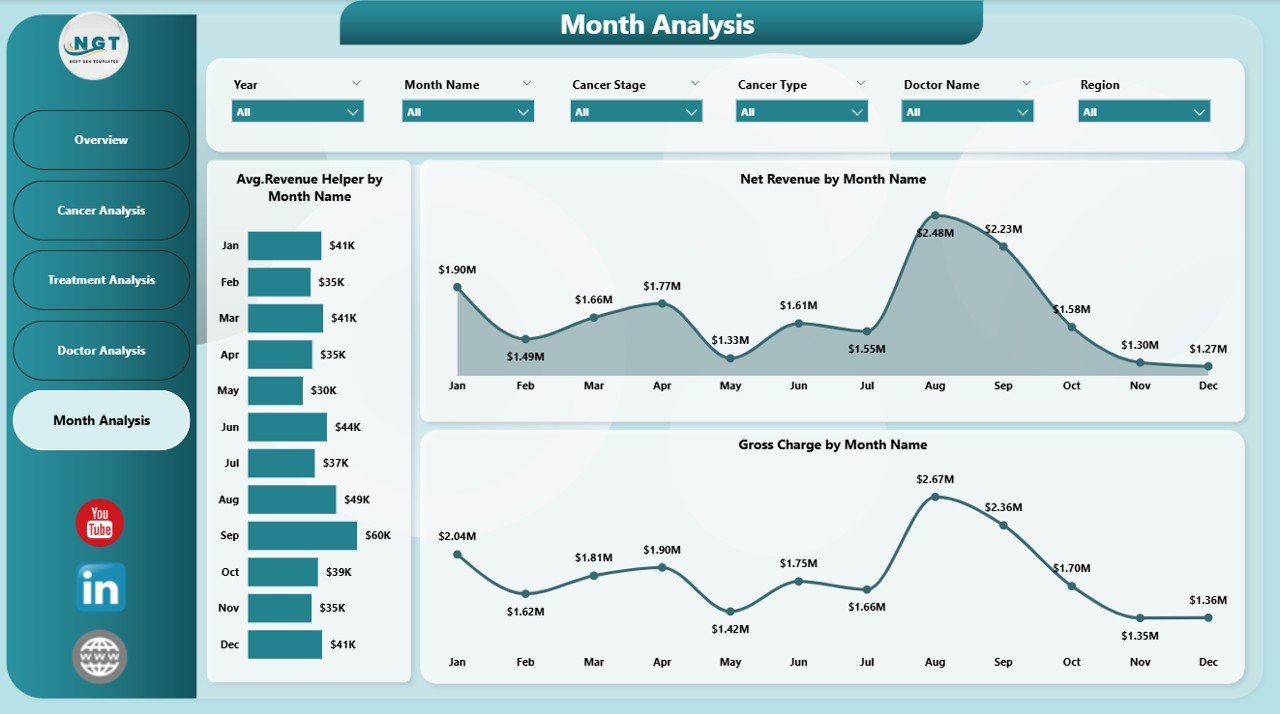
📅 Monthly Trends Page – Identify time-based patterns using Average Revenue, Net Revenue, and Gross Charge by Month.
Each page responds instantly to slicer selections, allowing users to move from high-level insights to detailed analysis seamlessly.
▶️ How to Use the Oncology Services Dashboard in Power BI
Using this dashboard is simple and practical:
1️⃣ Connect your oncology data from Excel or hospital systems.
2️⃣ Refresh the Power BI report to load updated data.
3️⃣ Use slicers to filter performance by cancer type, treatment, doctor, or month.
4️⃣ Analyze KPIs, charts, and trends to identify gaps and opportunities.
5️⃣ Use insights to improve care planning, revenue management, and operational efficiency.
No advanced Power BI expertise is required for end users.
👥 Who Can Benefit from This Oncology Services Dashboard in Power BI
This dashboard is ideal for:
🏥 Hospital Leadership & Administrators
🧬 Oncology Department Heads
👨⚕️ Doctors & Care Coordinators
💰 Finance & Billing Teams
📊 Operations & Strategy Teams
Each stakeholder gains transparency, control, and confidence in decision-making.
### 👉 Click here to read the Detailed Blog Post
Visit our YouTube channel to learn step-by-step video tutorials.
Watch the step-by-step video tutorial:
Compatibility and Requirements
- Works in Power BI Desktop, which is free. Get it from Get Power BI Desktop.
- Data can come from Excel or hospital systems. Refresh the report to load updated data.
- Slicers filter by cancer type, treatment type, doctor, region, gender and month.
Frequently Asked Questions
How many pages does the dashboard have?
Five pages: Overview, Cancer Analysis, Treatment Analysis, Doctor Analysis and Monthly Trends.
Which filters can I use?
Slicers filter the report by cancer type, treatment type, doctor, region, gender and month. Every page responds to the slicer selections.
Where does the data come from?
You connect your oncology data from Excel or hospital systems, then refresh the Power BI report to load it.
Do I need advanced Power BI skills to use it?
No. End users filter with slicers and read the KPI cards and charts. No advanced Power BI expertise is required.
Is there an Excel version?
Yes. See the Oncology Services Dashboard in Excel.
Related Oncology and Healthcare Templates
- Oncology Services Dashboard in Excel: the same topic in Excel
- Oncology Services KPI Dashboard in Power BI: a KPI-focused Power BI view
- Oncology Services KPI Dashboard in Excel: KPI tracking in Excel
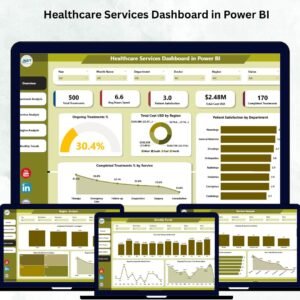
- Healthcare Services Dashboard in Power BI: a wider healthcare services view
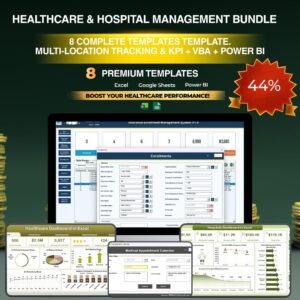
- Healthcare & Hospital Management Bundle: 8 healthcare templates in one download
Browse all Power BI dashboards.



Reviews
There are no reviews yet.