
Managing libraries and archives today is more complex than ever. Institutions must balance physical and digital collections, optimize limited budgets, improve user engagement, and demonstrate measurable impact to stakeholders. That is exactly why the Libraries & Archives KPI Dashboard in Excel becomes an essential performance management tool.
This ready-to-use Excel dashboard helps libraries and archival institutions track, analyze, and visualize key performance indicators (KPIs) in one centralized system. Instead of relying on scattered spreadsheets and manual reports, this dashboard transforms raw operational data into clear, actionable insights. As a result, librarians, archivists, and administrators gain full control over performance monitoring—without needing expensive BI software.
Because the dashboard is built entirely in Microsoft Excel, it remains simple, flexible, cost-effective, and widely accessible, even for teams with basic Excel skills.
⭐ Key Features of Libraries & Archives KPI Dashboard in Excel
📊 Centralized KPI Monitoring
Track all operational, service, and resource KPIs in one structured Excel workbook, eliminating data silos and confusion.
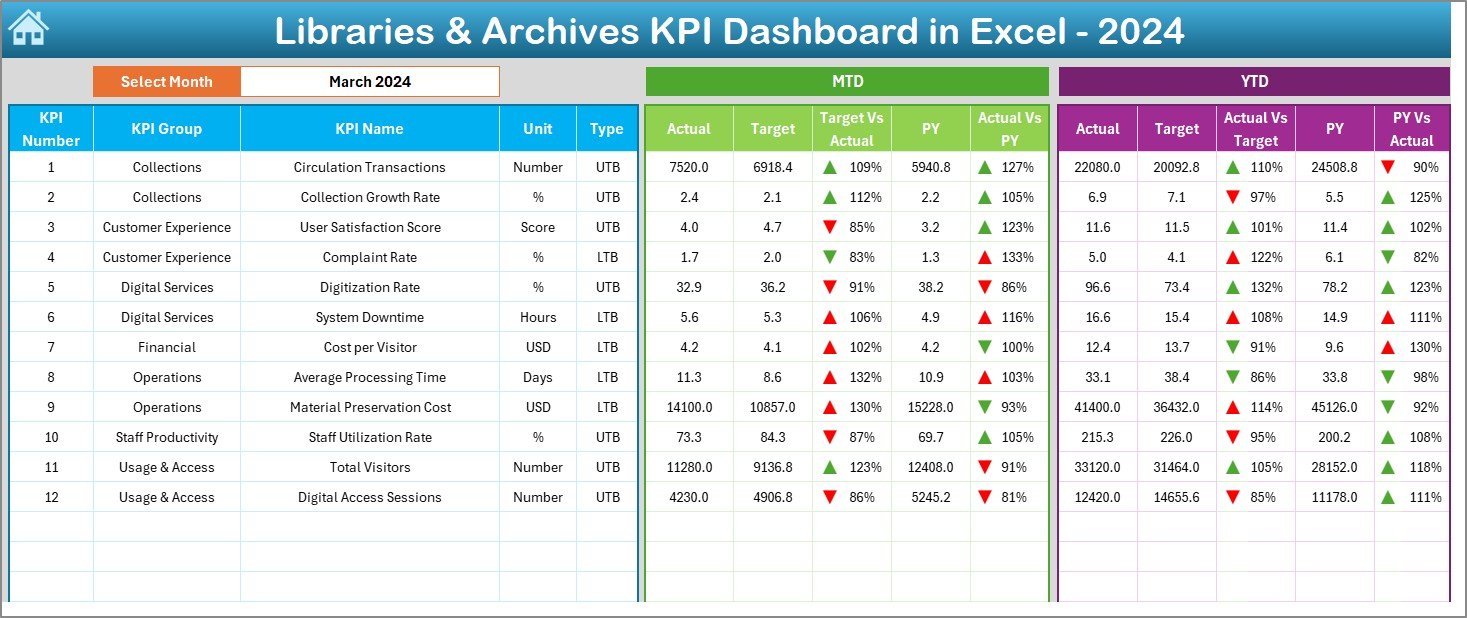
📅 Dynamic Month Selection
Select the month from a dropdown, and the entire dashboard updates automatically with fresh MTD and YTD insights.
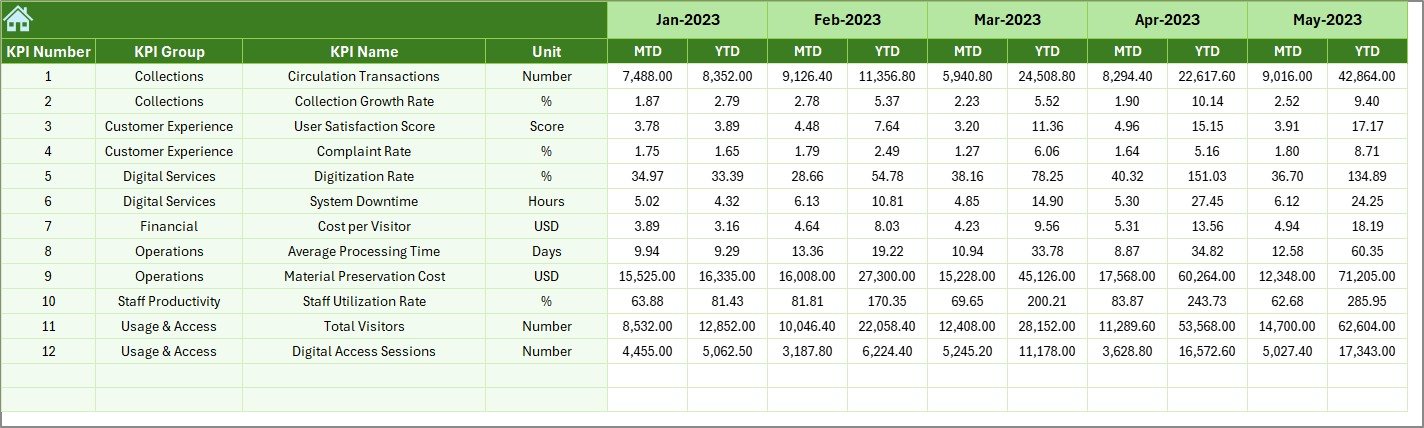
📈 MTD & YTD Performance Tracking
Monitor Month-to-Date and Year-to-Date Actuals, Targets, and Previous Year values side by side for better comparisons.
🔄 Target vs Actual & Year-over-Year Analysis
Instantly identify performance gaps using automated variance calculations.
🚦 Visual Performance Indicators
Conditional formatting with up/down arrows highlights KPI status at a glance.
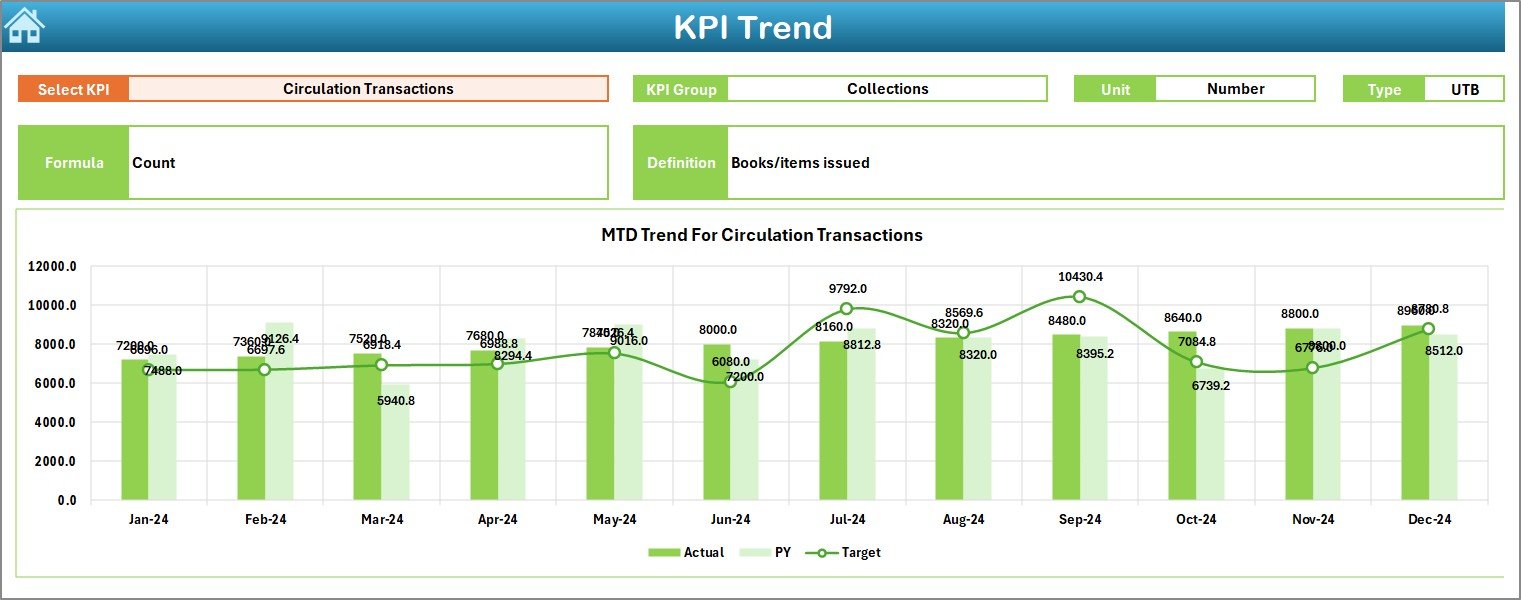
📉 KPI Trend Analysis
Analyze historical performance trends using dynamic charts instead of static reports.
🧭 Easy Navigation
A dedicated Summary Page allows one-click navigation across all sheets, making the dashboard user-friendly for everyone.
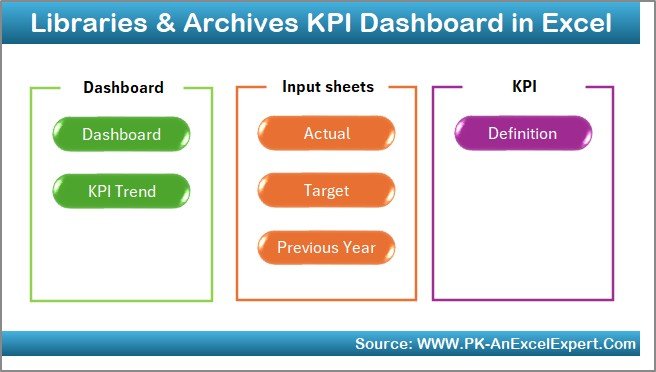
📂 What’s Inside the Libraries & Archives KPI Dashboard
📌 Summary Page
Acts as an index with navigation buttons to quickly access each worksheet.
📌 Dashboard Sheet
The main performance view displaying all KPIs, including MTD, YTD, targets, previous year values, and variances.
📌 Trend Sheet
Deep-dive analysis for individual KPIs with trend charts and detailed KPI information such as unit, type, formula, and definition.
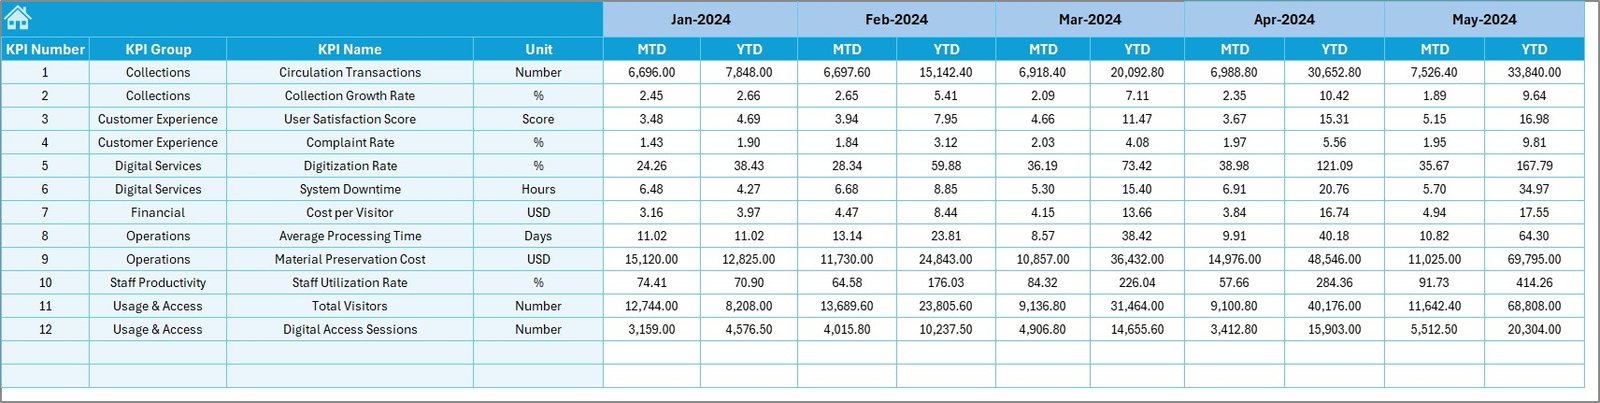
📌 Actual Numbers Input Sheet
Simple data entry area for monthly and yearly actual performance values.
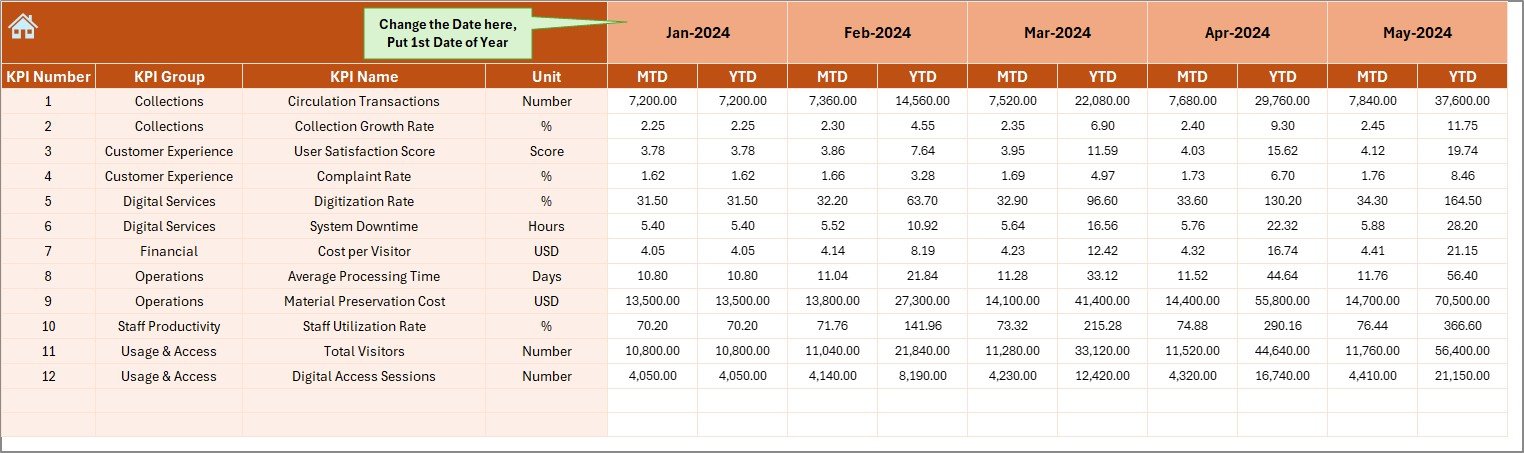
📌 Target Sheet
Stores planned MTD and YTD targets for accurate benchmarking.
📌 Previous Year Numbers Sheet
Captures historical data for year-over-year performance comparisons.
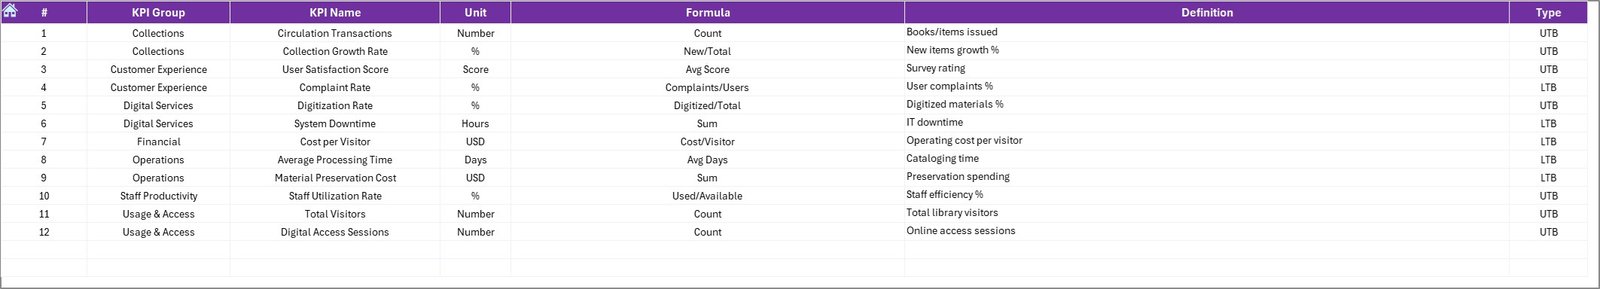
📌 KPI Definition Sheet
Defines every KPI clearly to ensure consistency, clarity, and easy onboarding for new users.
🛠️ How to Use the Libraries & Archives KPI Dashboard
1️⃣ Define your KPIs clearly in the KPI Definition Sheet
2️⃣ Enter actual performance data in the Actual Numbers Input Sheet
3️⃣ Set planned targets in the Target Sheet
4️⃣ Add previous-year values for historical comparison
5️⃣ Select the desired month from the dropdown
6️⃣ Review performance instantly on the Dashboard and Trend Sheets
Because all calculations and visuals are automated, users spend less time on reporting and more time on decision-making.
🎯 Who Can Benefit from This Libraries & Archives KPI Dashboard?
📚 Public Libraries
🏫 Academic & University Libraries
🏛️ National & Government Archives
🖼️ Museum & Cultural Archives
🔬 Research Institutions
🏢 Corporate & Private Libraries
🌐 Digital & Hybrid Libraries
Whether you manage a small community library or a large archival institution, this dashboard adapts easily to your needs.
Click here to read the Detailed blog post
Watch the step-by-step video tutorial:


Reviews
There are no reviews yet.