Lead Nurturing KPI Dashboard is no longer just about sending emails or running campaigns. In today’s competitive market, businesses must track how leads engage, progress, and convert across every stage of the funnel. However, when lead data remains scattered across Excel sheets, CRM exports, and manual reports, teams lose visibility and miss revenue opportunities. That is exactly why the Lead Nurturing KPI Dashboard in Power BI is a powerful and revenue-driven solution for modern sales and marketing teams.
This ready-to-use Power BI dashboard transforms raw lead data into a centralized, interactive, and highly visual performance system. Instead of guessing which campaigns work or where leads drop off, teams can track key lead nurturing KPIs with absolute clarity. As a result, organizations improve conversion rates, optimize campaigns, and align sales and marketing teams around shared goals.
Because the dashboard uses Excel as the data source and Power BI for visualization, it remains both flexible and easy to use. You simply update the Excel input sheets, refresh the dashboard, and instantly access updated insights.
🔑 Key Features of Lead Nurturing KPI Dashboard in Power BI
🎯 Centralized KPI Tracking – Monitor all lead nurturing KPIs in one professional Power BI dashboard.
📊 MTD & YTD Performance Monitoring – Track both short-term and long-term performance easily.
📉 Target vs Actual Analysis – Instantly identify underperforming KPIs using visual indicators.
📈 CY vs PY Comparison – Compare current performance with previous year trends.
🎛️ Interactive Slicers – Filter performance by Month and KPI Group dynamically.
📂 What’s Inside the Lead Nurturing KPI Dashboard in Power BI
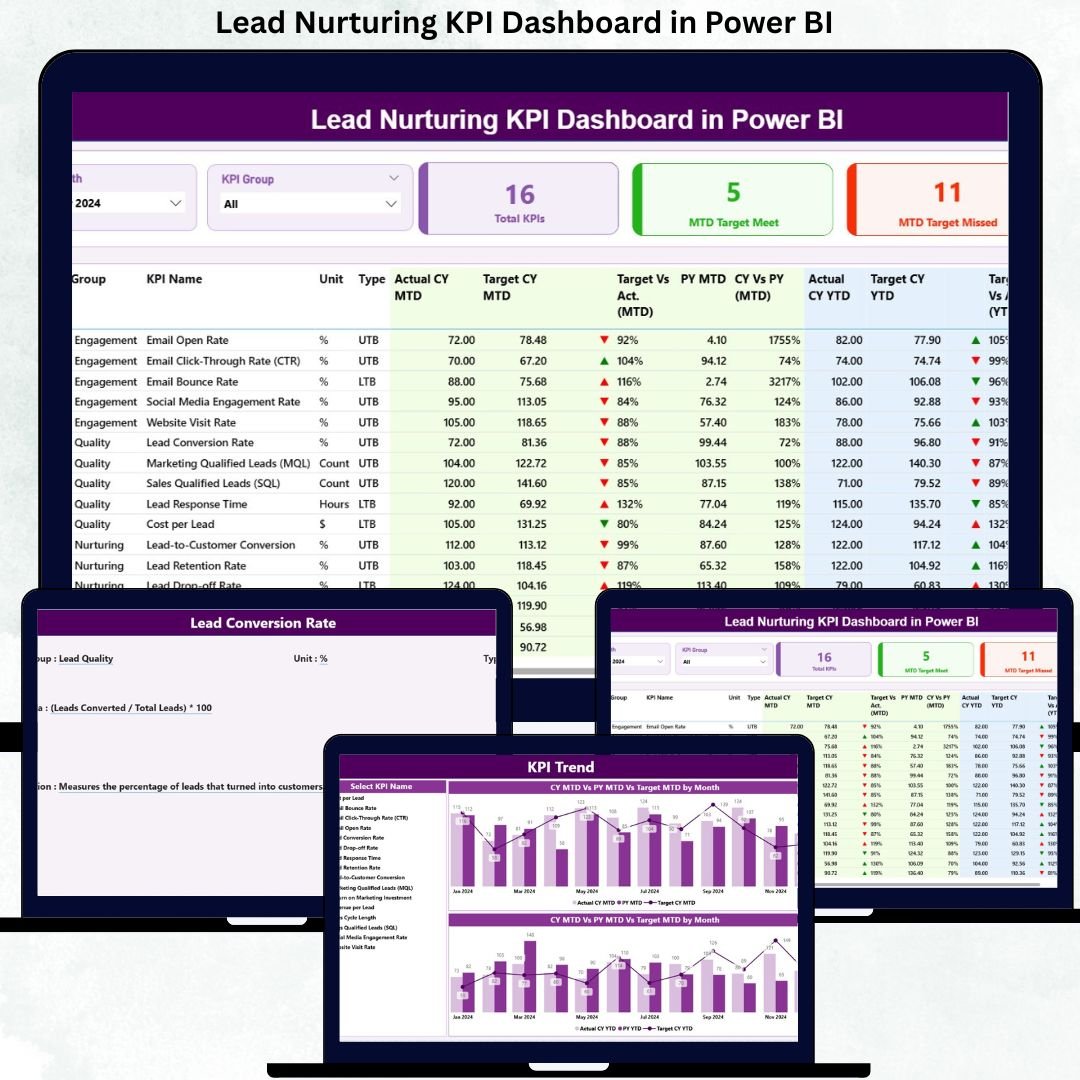
This dashboard is designed with three structured and purpose-built pages:
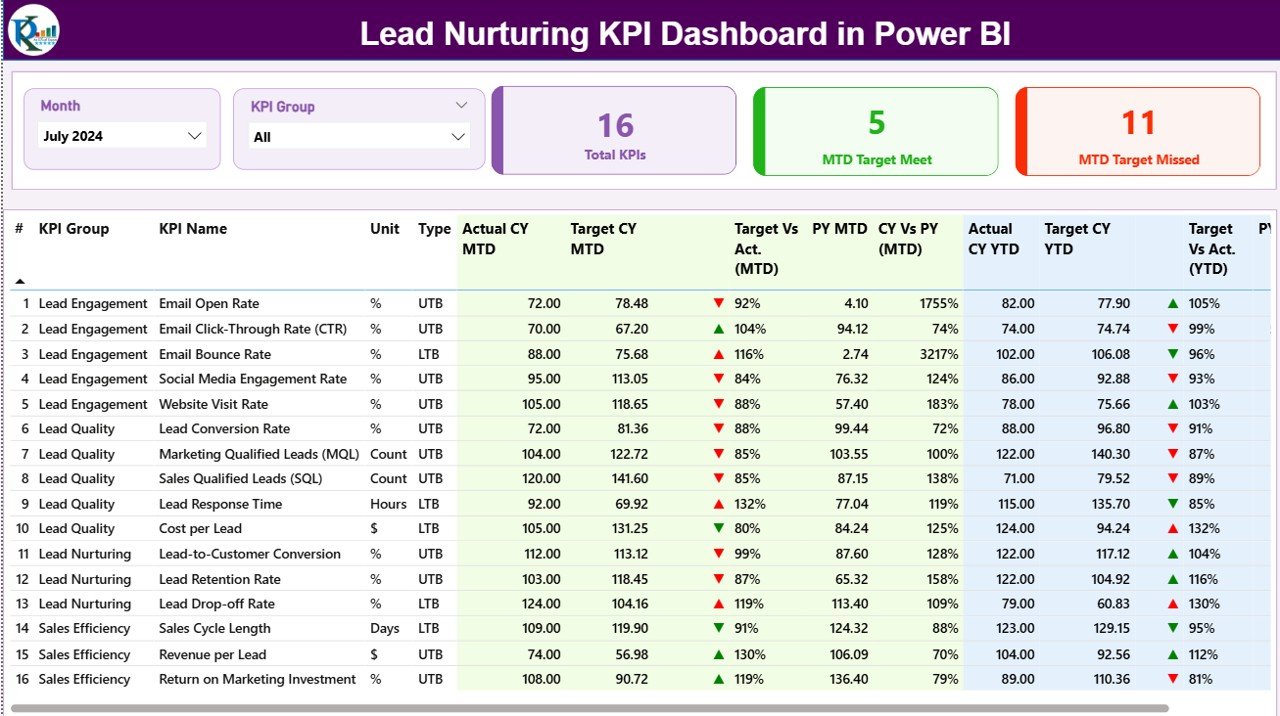
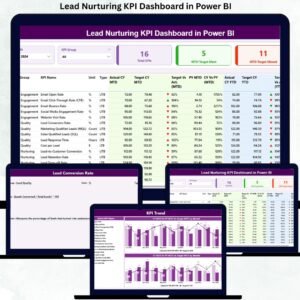
📌 Summary Page – The main control panel with Month and KPI Group slicers, three executive KPI cards, and a detailed KPI performance table showing MTD and YTD metrics, target comparisons, and trend indicators.
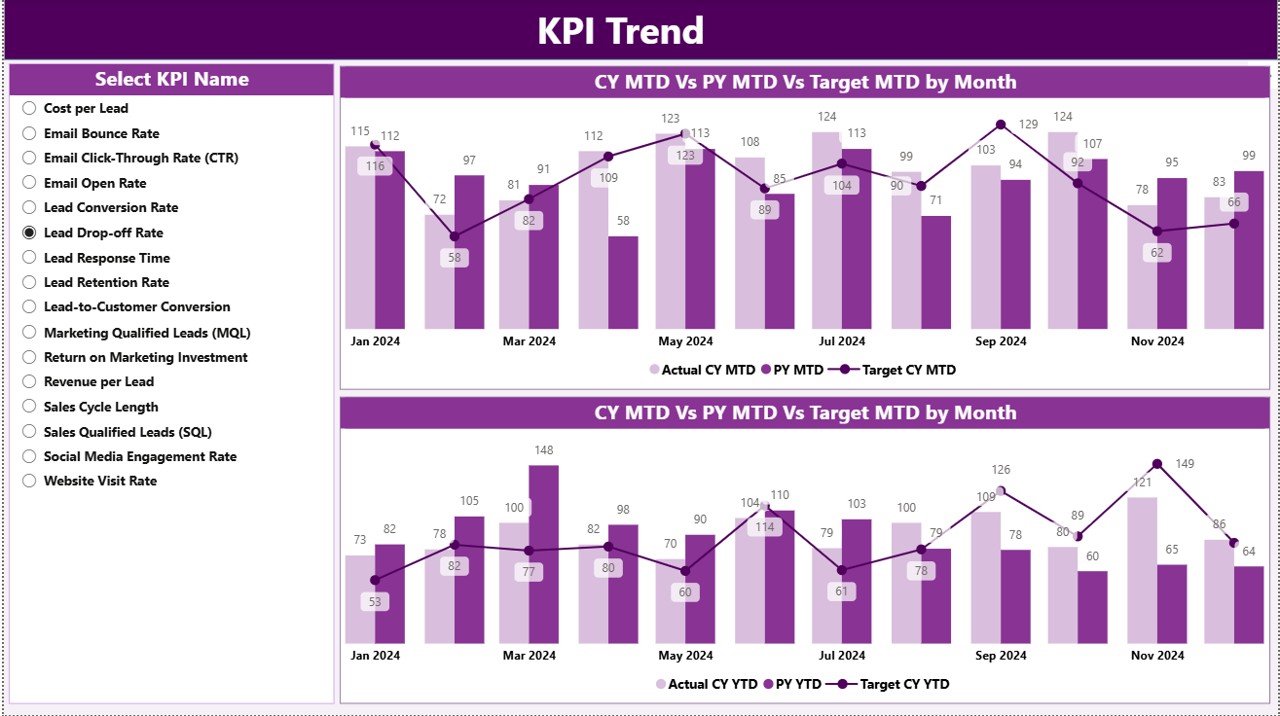
📈 KPI Trend Page – Analyze performance over time using combo charts that display Actual CY, PY, and Target for both MTD and YTD.
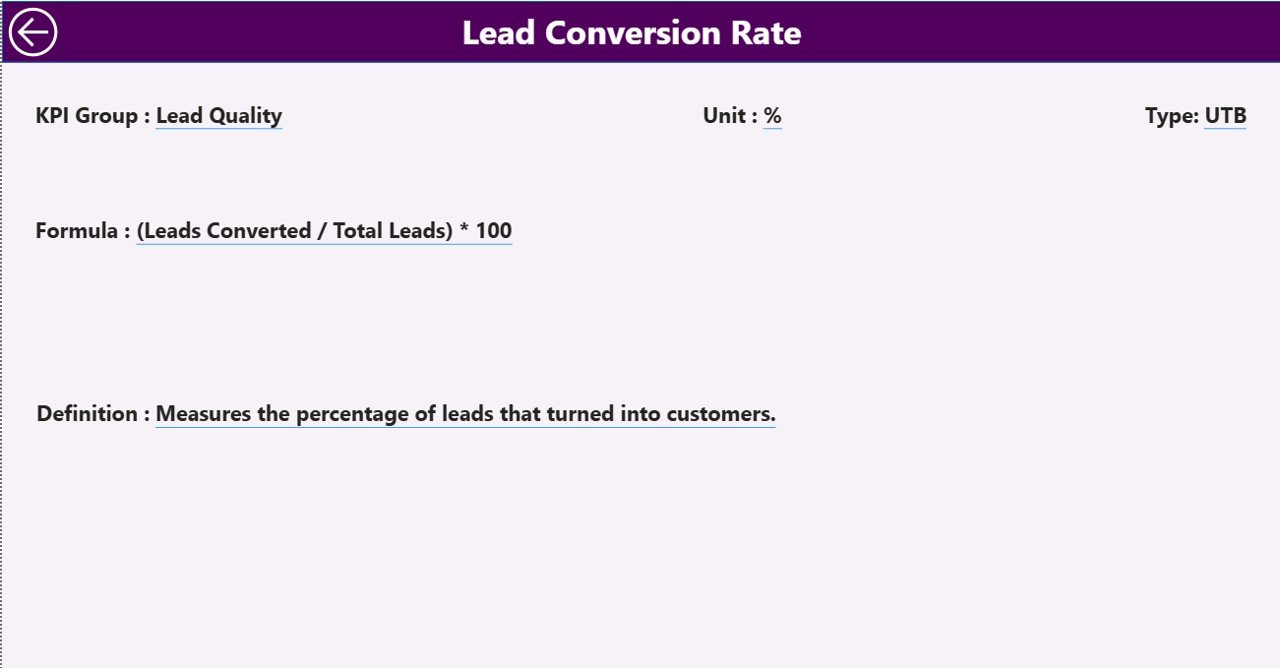
📘 KPI Definition Page – A drill-through page that documents KPI Number, Group, Name, Unit, Formula, Definition, and Type (LTB/UTB) for clarity and governance.
In addition, the dashboard connects to an Excel data file containing:
📄 Input_Actual Sheet – Stores actual MTD and YTD performance data.
🎯 Input_Target Sheet – Holds target values for accurate comparisons.
📚 KPI Definition Sheet – Acts as the KPI master for consistency and transparency.
▶️ How to Use the Lead Nurturing KPI Dashboard in Power BI
Using this dashboard is simple and business-friendly:
1️⃣ Enter actual performance values in the Input_Actual Excel sheet.
2️⃣ Update target values in the Input_Target sheet.
3️⃣ Maintain KPI details in the KPI Definition sheet.
4️⃣ Refresh the Power BI report to load updated data.
5️⃣ Use slicers, tables, and charts to analyze performance instantly.
No advanced Power BI skills are required for end users.
👥 Who Can Benefit from This Lead Nurturing KPI Dashboard in Power BI
This dashboard is ideal for:
📢 Marketing Managers
💼 Sales Leaders
📊 Business Analysts
🚀 Growth & Demand Generation Teams
🏢 Business Owners & Founders
📈 Revenue Operations Teams
Each stakeholder gains visibility, alignment, and actionable insights.
### 👉 Click here to read the Detailed Blog Post
Visit our YouTube channel to learn step-by-step video tutorials.


Reviews
There are no reviews yet.