
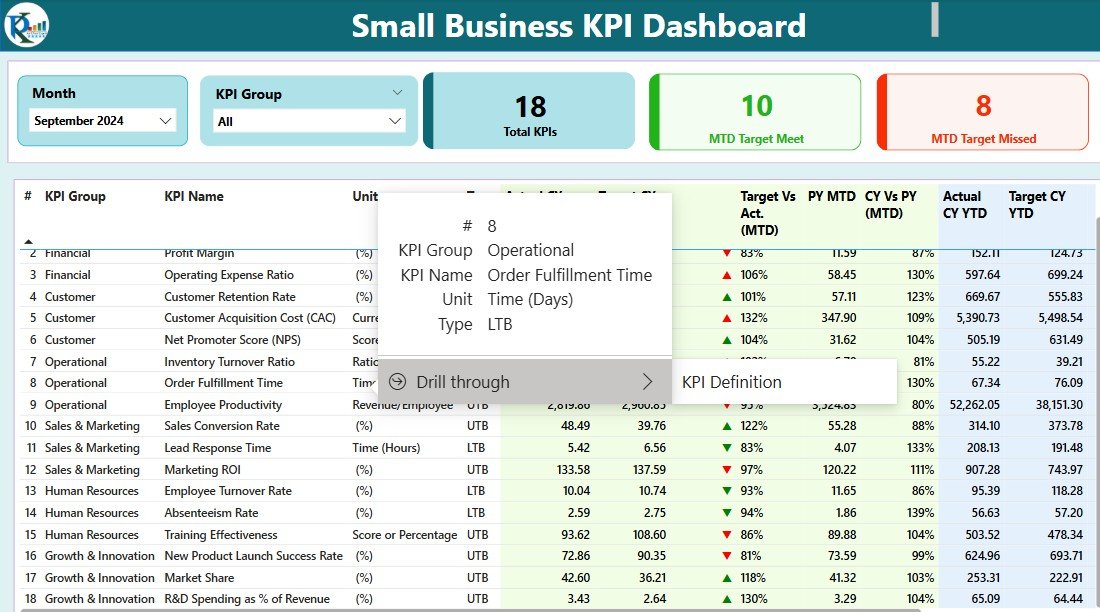


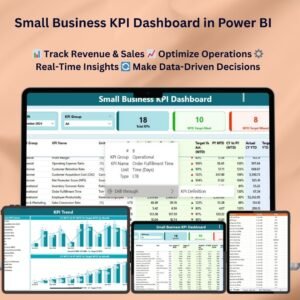
The Small Business KPI Dashboard in Power BI is an essential tool designed for small businesses to monitor, analyze, and visualize key performance indicators (KPIs) in real time. This interactive dashboard is perfect for business owners, managers, and stakeholders who need to make data-driven decisions to improve overall business performance.
From revenue and sales growth to customer acquisition and operational costs, this customizable dashboard allows you to track important business metrics in a clear, concise, and visually appealing way. With Power BI’s powerful data visualization capabilities, you can dive deeper into your business performance and uncover trends that drive success.

Key Features of the Small Business KPI Dashboard in Power BI
📊 Real-Time Data Visualization: Monitor KPIs such as revenue, sales, profit margins, and operational costs in real time.
⚙️ Customizable KPIs: Adapt the dashboard to track metrics that matter most to your business, whether it’s sales, customer acquisition, or cost management.
📈 Performance Insights: Analyze your business performance, identify trends, and make data-driven decisions to improve operational efficiency.
📅 Time-Based Analysis: Track and compare data over time (daily, weekly, monthly, yearly) to monitor long-term performance.
📉 Comparative Data: Compare KPIs across different departments, teams, or time periods to identify strengths and weaknesses.
🔄 Interactive Dashboard: Drill down into specific metrics and KPIs for a detailed analysis of your business performance.
🧑💼 User-Friendly Interface: A simple, intuitive design makes it easy to navigate and use, even for those with little technical expertise.
Why You’ll Love the Small Business KPI Dashboard in Power BI
✅ Optimizes Decision Making: Quickly identify key business trends and areas for improvement using real-time data.
✅ Customizable for Your Business: Modify the dashboard to track specific KPIs that are relevant to your business goals.
✅ Data-Driven Insights: Gain valuable insights into business performance and make informed decisions to increase profitability.
✅ Real-Time Updates: Monitor your business metrics in real time, ensuring you stay on top of performance at all times.
✅ Improves Operational Efficiency: Identify bottlenecks, streamline processes, and reduce operational costs.
What’s Inside the Small Business KPI Dashboard in Power BI?
📊 Financial Metrics: Track revenue, profit margins, sales, and expenses to monitor financial performance.
📈 Customer Insights: Analyze customer acquisition, retention, and satisfaction to improve marketing strategies.
⚙️ Operational Efficiency: Monitor key operational metrics, such as cost management and process efficiency.
📅 Time-Based Performance Tracking: Track performance trends across different time periods for better decision-making.
🔄 Interactive Visuals: Use interactive charts and filters to explore your data in more detail.
How to Use the Small Business KPI Dashboard in Power BI
1️⃣ Download the Dashboard Template – Get instant access to the Power BI file upon purchase.
2️⃣ Customize Your KPIs: Modify the dashboard to track the most relevant business metrics.
3️⃣ Connect Your Data: Link your data sources to Power BI to start tracking business performance.
4️⃣ Monitor and Analyze: Use the dashboard to monitor real-time performance and analyze trends.
5️⃣ Generate Reports: Produce custom reports for stakeholders and decision-makers.
Who Can Benefit from the Small Business KPI Dashboard in Power BI?
🔹 Small Business Owners
🔹 Entrepreneurs
🔹 Operations Managers
🔹 Financial Analysts
🔹 Sales and Marketing Teams
🔹 Executive Leadership
Make smarter business decisions, optimize performance, and track growth with this customizable and easy-to-use Power BI dashboard.
Click here to read the detailed blog post
Visit our YouTube channel to learn step-by-step video tutorials
Also check our Expense Tracking Dashboard in Power BI


Reviews
There are no reviews yet.