Understanding how much value a customer brings to your business over time is essential for sustainable growth. However, many organizations still rely on fragmented data sources to analyze customer profitability. Customer revenue, acquisition cost, retention, and churn metrics often remain scattered across spreadsheets, CRM systems, and finance tools. As a result, leadership teams make strategic decisions based on assumptions rather than accurate insights.
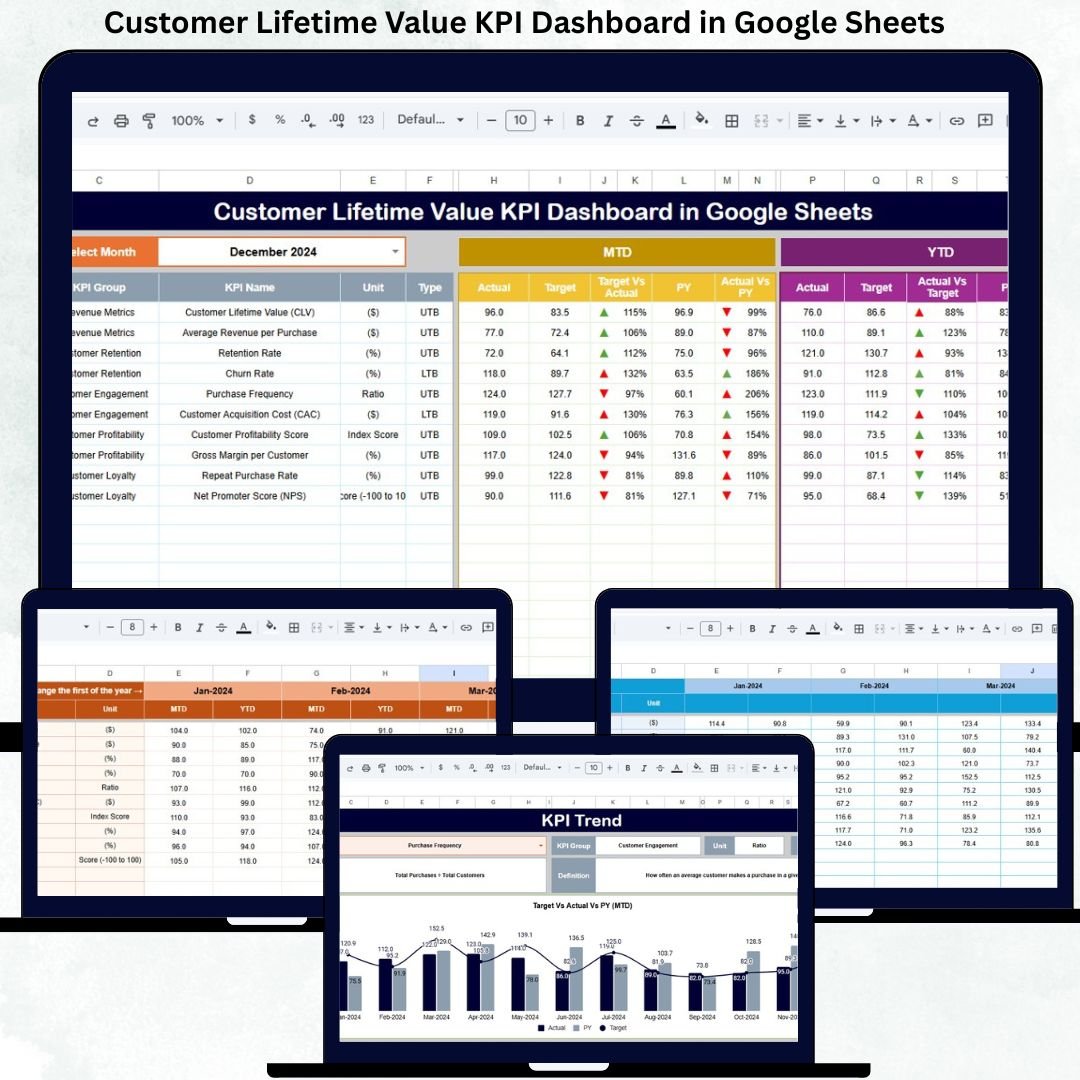
The Customer Lifetime Value KPI Dashboard in Google Sheets solves this challenge by providing a centralized, structured, and data-driven system to track long-term customer value. This ready-to-use dashboard helps organizations measure customer profitability, retention efficiency, acquisition effectiveness, and revenue contribution using clearly defined KPIs and automated calculations.
Because the dashboard is built entirely in Google Sheets, it remains easy to use, highly collaborative, and cost-effective. Teams can update data in real time, share insights across departments, and monitor performance without investing in complex BI platforms.
🚀 Key Features of the Customer Lifetime Value KPI Dashboard
📊 Comprehensive CLV Tracking
Measure customer lifetime value consistently across months and years.
🎯 MTD, YTD & YoY Comparison
Track Month-to-Date, Year-to-Date, Target, and Previous Year performance in one view.
📈 KPI Trend Analysis
Understand how customer value evolves over time and identify long-term patterns.
💰 Profitability & Retention Visibility
Analyze how retention, churn, and acquisition costs impact CLV.
🧩 Central KPI Definition Control
Maintain consistent KPI definitions, formulas, and measurement logic.
🔄 Automatic Dashboard Updates
All visuals refresh instantly when data is updated.
📦 What’s Inside the Customer Lifetime Value KPI Dashboard
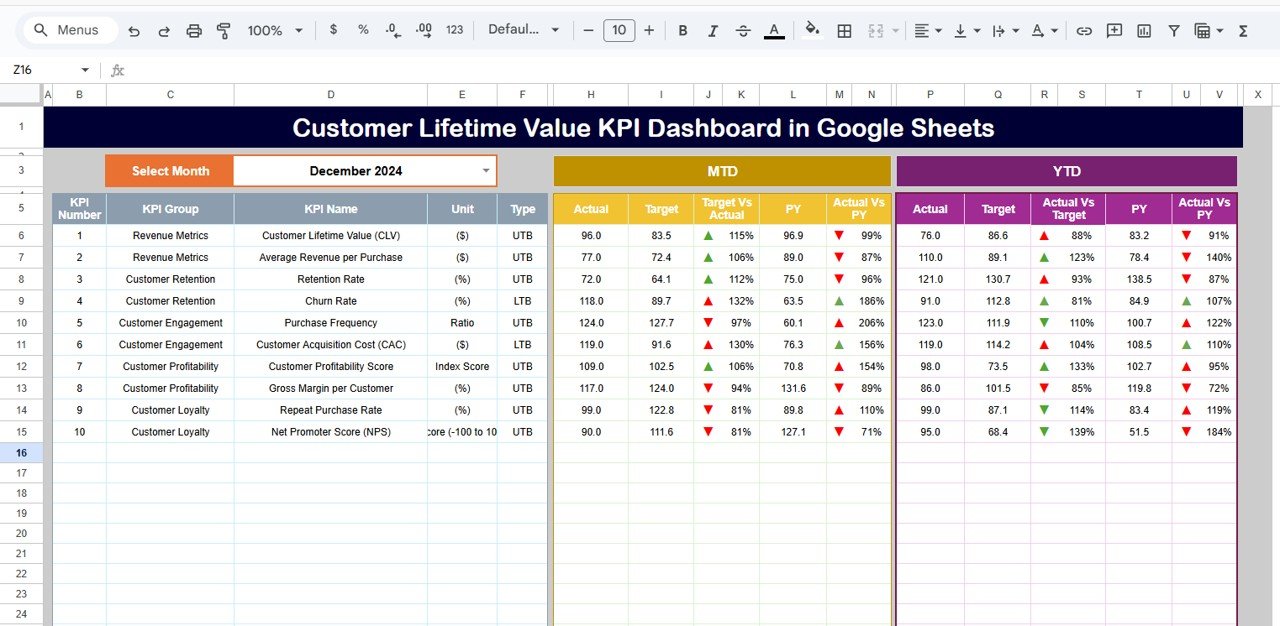
📊 Dashboard Sheet – Main Performance View
This sheet provides a complete snapshot of CLV performance.
Month Selector
-
Located in cell D3
-
Selecting a month updates all KPIs automatically
KPI Metrics Displayed
MTD (Month-to-Date):
-
Actual
-
Target
-
Previous Year
-
Target vs Actual
-
Previous Year vs Actual
YTD (Year-to-Date):
-
Actual
-
Target
-
Previous Year
-
Target vs Actual
-
Previous Year vs Actual
Visual Indicators
-
🟢 Green arrow → Improvement
-
🔴 Red arrow → Decline
-
⚪ Neutral → Stable
This allows management to evaluate customer value instantly.
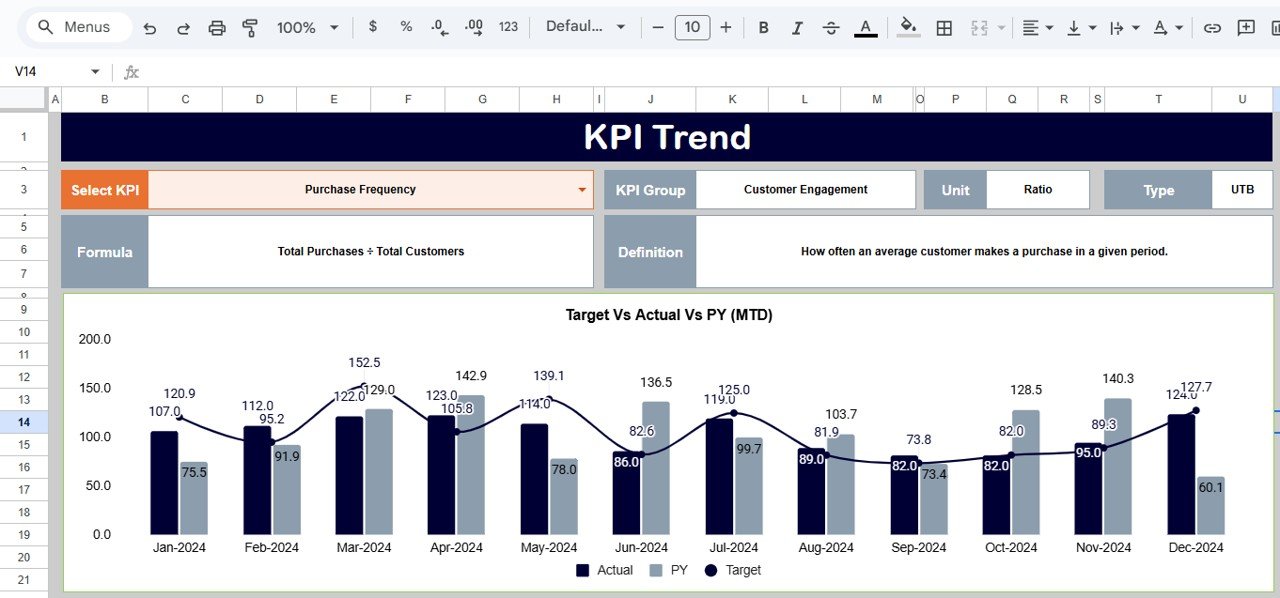
📈 KPI Trend Sheet
This sheet provides deep analysis for individual KPIs.
Features
-
KPI selection dropdown in cell C3
-
Displays:
-
KPI Group
-
Unit
-
KPI Type (UTB / LTB)
-
Formula
-
Definition
-
-
Monthly trend visualization
This sheet is ideal for understanding retention impact and CLV fluctuations.
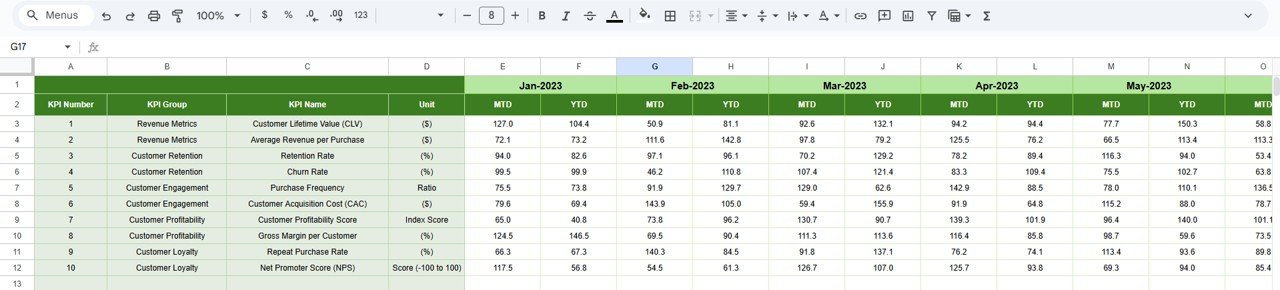
🧮 Actual Number Sheet
The primary data entry sheet.
How It Works
-
Select the first month of the year in cell E1
-
Enter MTD and YTD actual values
-
All dashboards update automatically
Ensures structured and accurate reporting.
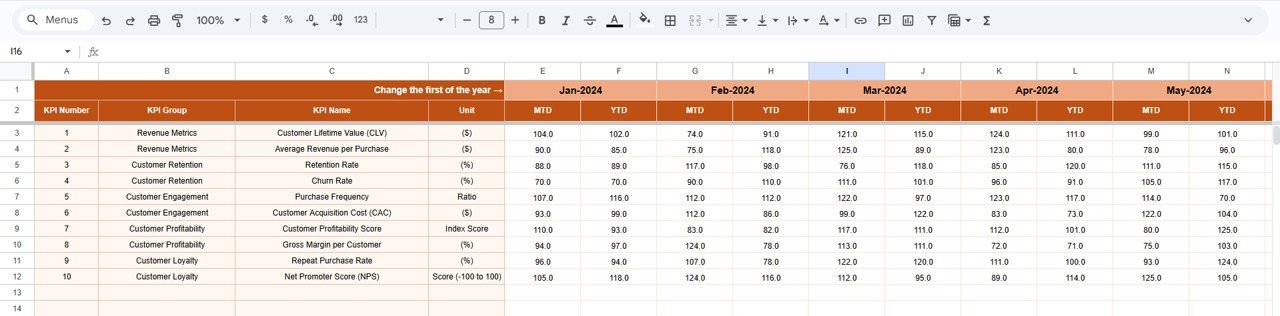
🎯 Target Sheet
Stores benchmark CLV targets.
Purpose
-
Define monthly and annual goals
-
Compare planned vs actual CLV
-
Support forecasting and budgeting
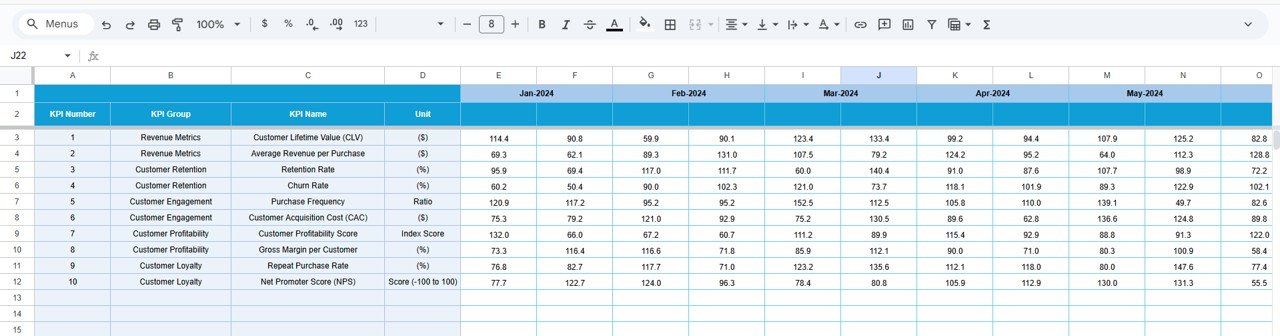
📅 Previous Year Number Sheet
Contains historical KPI values.
Benefits
-
Enables year-over-year comparison
-
Highlights long-term CLV improvement
-
Measures impact of retention strategies
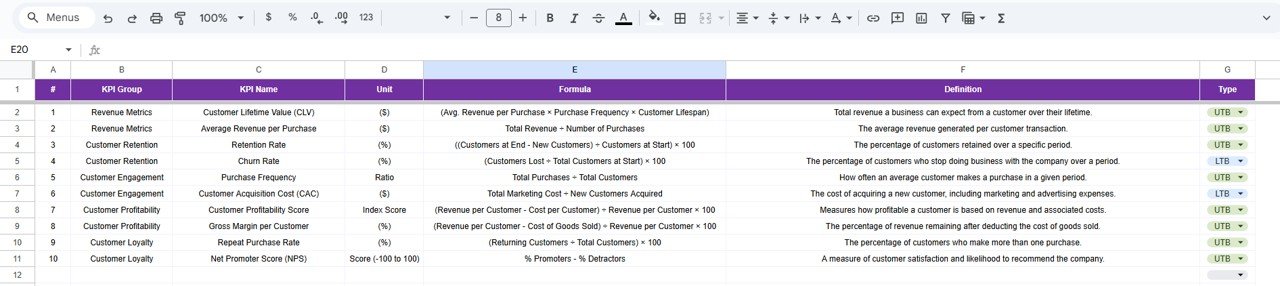
📘 KPI Definition Sheet
The backbone of the dashboard.
Includes:
-
KPI Name
-
KPI Group
-
Unit
-
Formula
-
Definition
-
KPI Type (LTB / UTB)
Ensures consistency across all reports.
🛠️ How to Use the Customer Lifetime Value KPI Dashboard
1️⃣ Define KPIs in the KPI Definition sheet
2️⃣ Enter actual performance data monthly
3️⃣ Set realistic CLV targets
4️⃣ Review MTD, YTD, and YoY comparisons
5️⃣ Analyze KPI trends
6️⃣ Improve retention and acquisition strategies
👥 Who Can Benefit from This Dashboard
-
📣 Marketing Teams
-
🤝 Sales Teams
-
💼 Finance Teams
-
📊 Business Analysts
-
🧑💼 Senior Management & Leadership
### Click here to read the Detailed blog post
Watch the step-by-step video tutorial:


Reviews
There are no reviews yet.