
Reinsurance operations deal with high-value risks, complex treaties, long-term exposures, and detailed financial tracking. Premiums, claims, recoveries, loss ratios, and profitability must be monitored continuously to ensure financial stability and effective risk transfer. However, when this information is scattered across multiple systems or tracked manually, insights become slow, inconsistent, and unreliable.
The Reinsurance KPI Dashboard in Google Sheets is designed to eliminate this complexity. It provides a centralized, ready-to-use performance management solution that transforms raw reinsurance data into clear KPIs, comparisons, and trends. With this dashboard, reinsurance teams gain instant visibility into financial performance, risk exposure, and operational efficiency—all from a single Google Sheets file.
Because the dashboard runs entirely on Google Sheets, it is cloud-based, collaborative, and cost-effective. Teams can update numbers in real time, review performance together, and make faster, data-driven decisions without relying on expensive BI or actuarial tools.
🚀 Key Features of the Reinsurance KPI Dashboard in Google Sheets
📊 MTD & YTD Performance Tracking
Track Month-to-Date and Year-to-Date performance for all critical reinsurance KPIs.
🎯 Target vs Actual Comparison
Compare actual performance against defined targets to identify gaps early.
📅 Previous Year Benchmarking
Measure current performance against last year’s numbers to spot long-term trends.
📈 KPI Trend Analysis
Analyze month-wise KPI trends to understand risk movement and profitability patterns.
🧮 Automated Calculations
Built-in formulas calculate ratios, variances, and comparisons automatically.
🧾 Centralized KPI Definitions
Maintain consistent KPI names, formulas, and definitions across teams.
📦 What’s Inside the Reinsurance KPI Dashboard
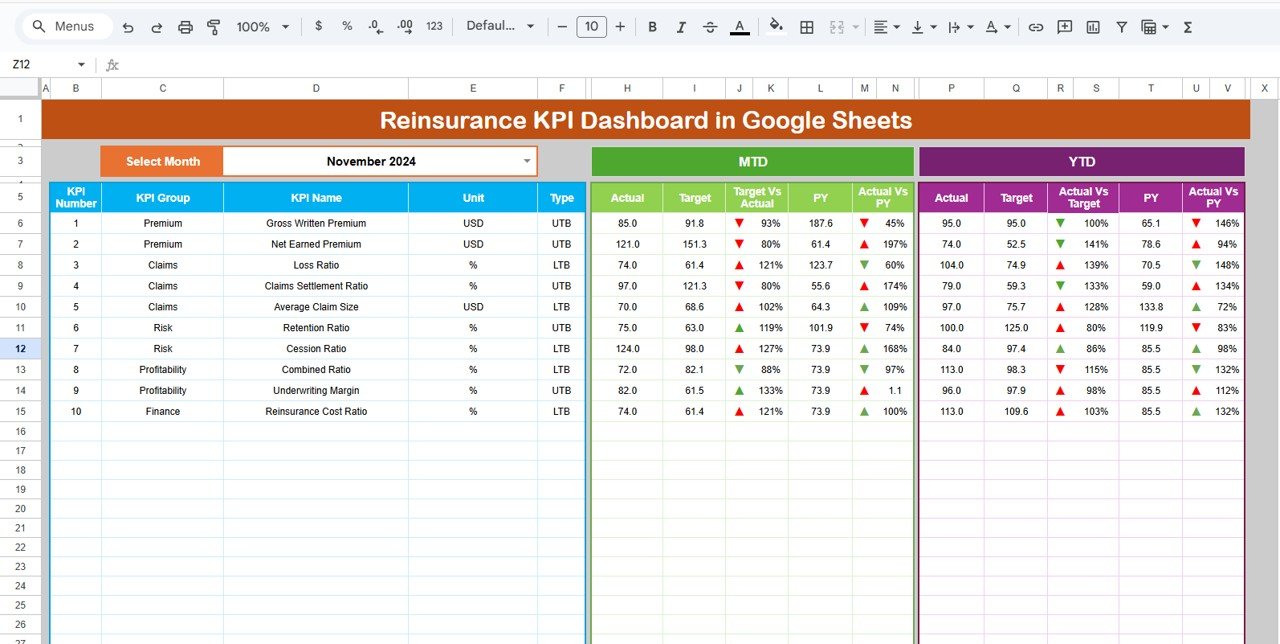
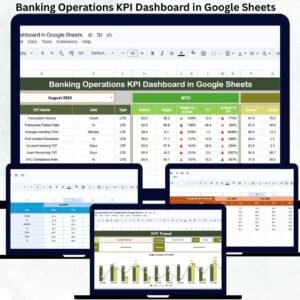
🖥️ Dashboard Sheet – Executive Performance Snapshot
This is the main summary page designed for leadership and performance reviews.
How It Works:
-
Select the month from a dropdown (Cell D3)
-
All KPIs update instantly
KPIs Displayed:
-
MTD Actual, Target & Previous Year
-
MTD Target vs Actual
-
MTD PY vs Actual
-
YTD Actual, Target & Previous Year
-
YTD Target vs Actual
-
YTD PY vs Actual
Conditional formatting with arrows highlights performance:
-
🟢 Green Arrow – Favorable movement
-
🔴 Red Arrow – Unfavorable movement
This page allows executives to understand reinsurance performance in seconds.
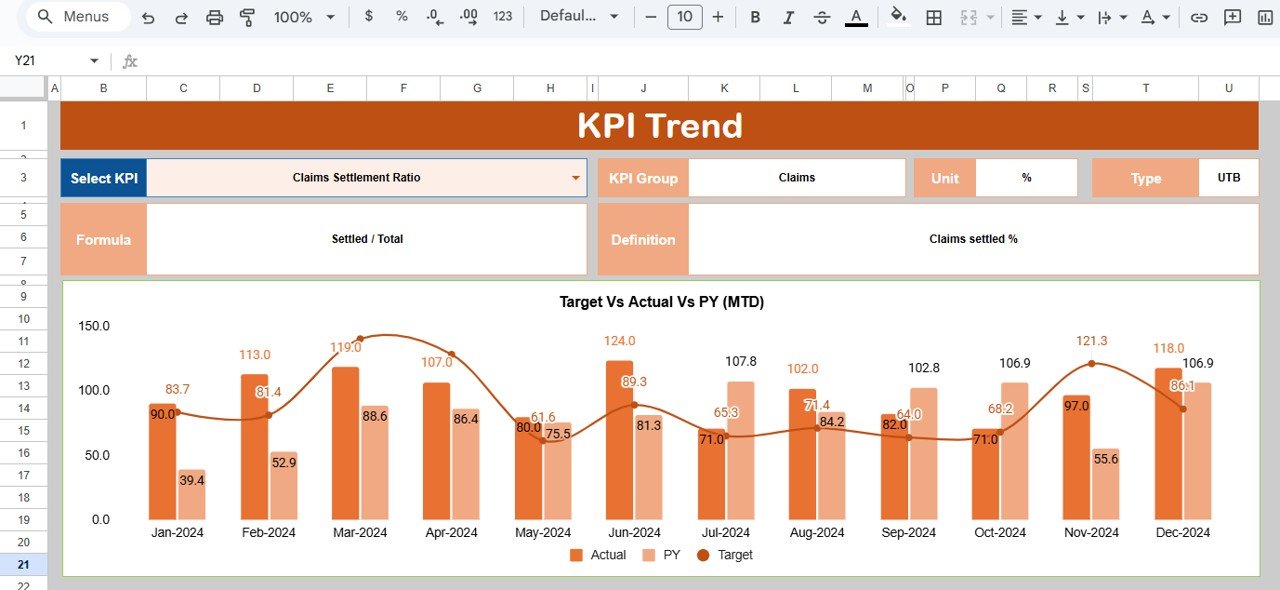
📈 KPI Trend Sheet – Deep-Dive Analysis
This sheet helps teams analyze individual KPIs in detail.
Features:
-
Select any KPI from a dropdown (Cell C3)
-
View KPI Group, Unit, Type (LTB / UTB)
-
Review Formula and Definition
-
Analyze month-wise trends visually
It is ideal for identifying loss ratio spikes, recovery patterns, or premium growth trends.
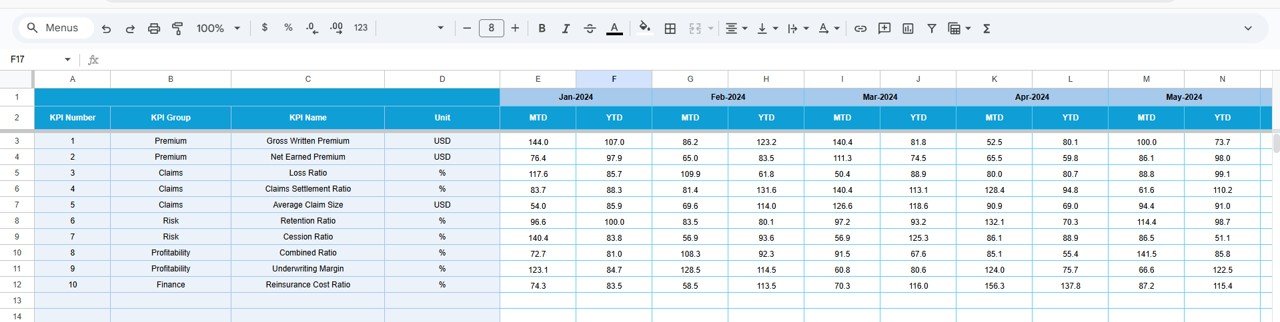
🧾 Actual Number Sheet
This sheet captures actual reinsurance performance data.
Key Functions:
-
Enter MTD and YTD actual values
-
Select the first month of the year (Cell E1)
-
Automatic alignment for the entire year
This sheet acts as the core data input layer.
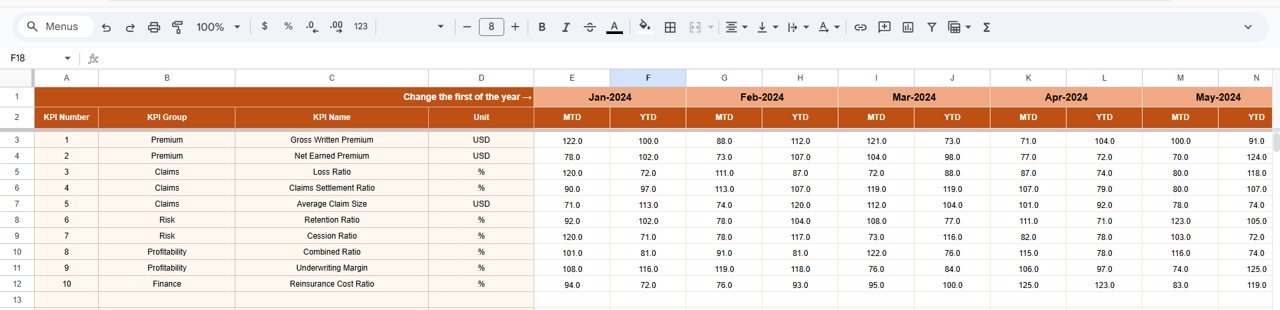
🎯 Target Sheet
This sheet stores KPI targets for both MTD and YTD.
Purpose:
-
Define expected performance levels
-
Track underwriting and profitability goals
-
Support strategic planning and control
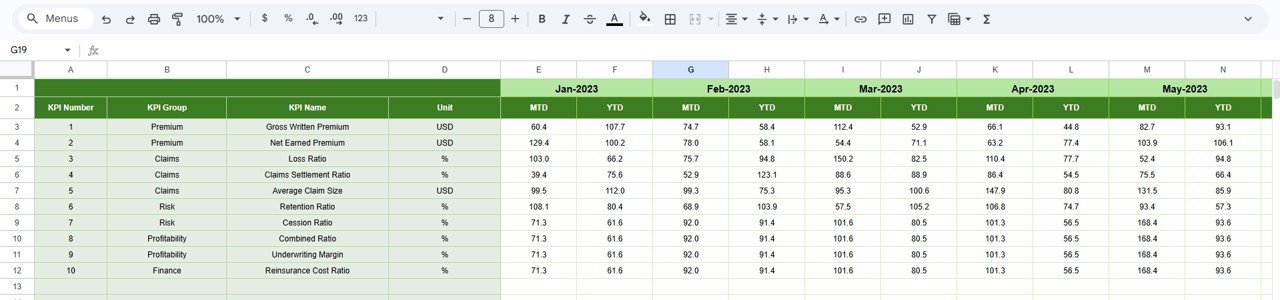
📅 Previous Year Number Sheet
This sheet stores last year’s KPI values.
Benefits:
-
Year-on-year comparison
-
Long-term performance evaluation
-
Trend benchmarking for strategic reviews
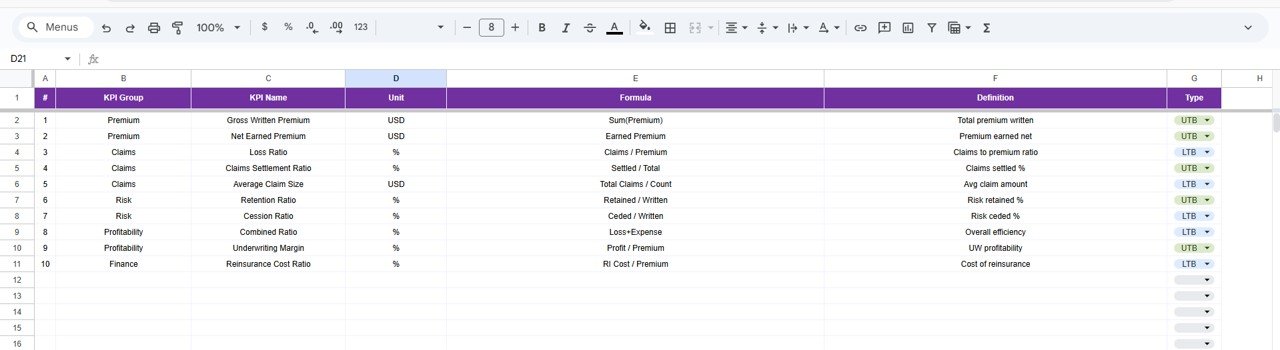
📚 KPI Definition Sheet
This is the control center of the dashboard.
It includes:
-
KPI Name
-
KPI Group
-
Unit
-
Formula
-
Definition
-
KPI Type (LTB / UTB)
This ensures clarity, consistency, and audit-ready reporting.
🛠️ How to Use the Reinsurance KPI Dashboard
1️⃣ Enter actual performance data monthly
2️⃣ Define realistic KPI targets
3️⃣ Select the reporting month
4️⃣ Review MTD, YTD, and YoY comparisons
5️⃣ Analyze trends and take corrective action
👥 Who Can Benefit from This Dashboard
-
🏦 Reinsurance Companies
-
🧮 Actuaries & Risk Analysts
-
📊 Finance & Accounting Teams
-
📉 Underwriting Teams
-
👨💼 Senior Management & Leadership
Click here to read the Detailed blog post
Watch the step-by-step video tutorial:


Reviews
There are no reviews yet.