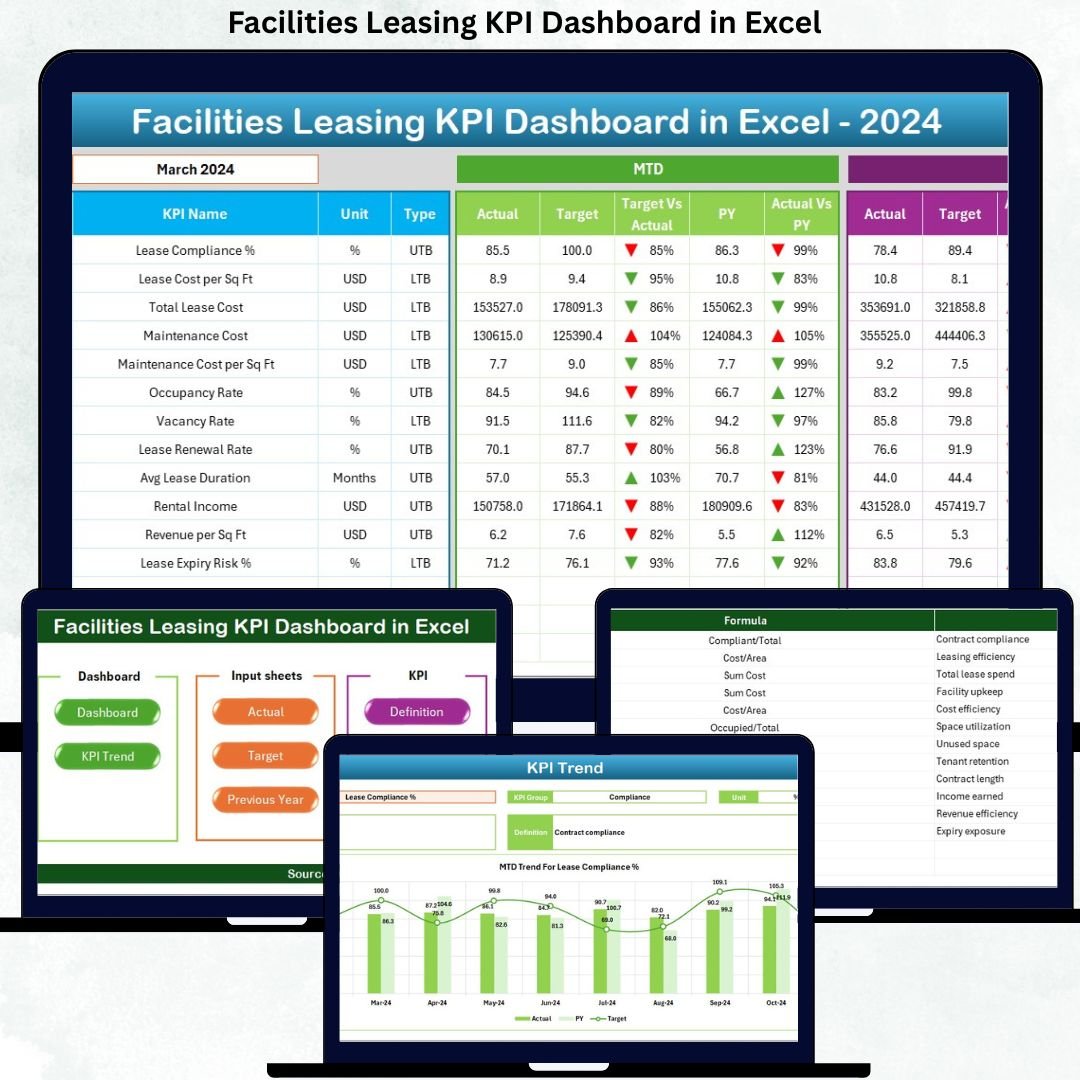
Managing facilities leasing without clear performance visibility often results in revenue loss, vacant spaces, and missed optimization opportunities. That is exactly why the Facilities Leasing KPI Dashboard in Excel is designed—to give you complete control, clarity, and confidence over your leasing operations from a single, powerful Excel dashboard.
This ready-to-use Excel dashboard transforms raw leasing data into actionable insights, helping you track occupancy, revenue, lease performance, targets, and trends without relying on complex or expensive BI tools. Whether you manage corporate offices, commercial buildings, business parks, or leased facilities, this dashboard becomes your daily decision-making companion.
Built entirely in Microsoft Excel, it is cost-effective, flexible, scalable, and easy to customize, even for non-technical users.
Key Features of Facilities Leasing KPI Dashboard in Excel
📊 Centralized KPI Monitoring – Track all critical facilities leasing KPIs in one structured dashboard.
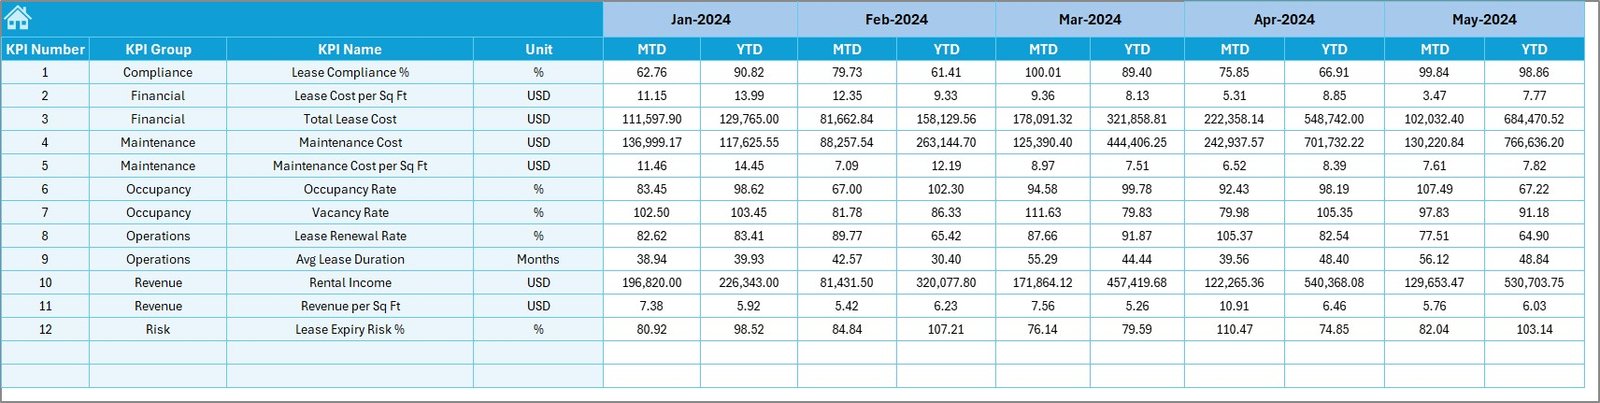
📅 MTD & YTD Performance Tracking – Monitor both monthly and cumulative performance effortlessly.
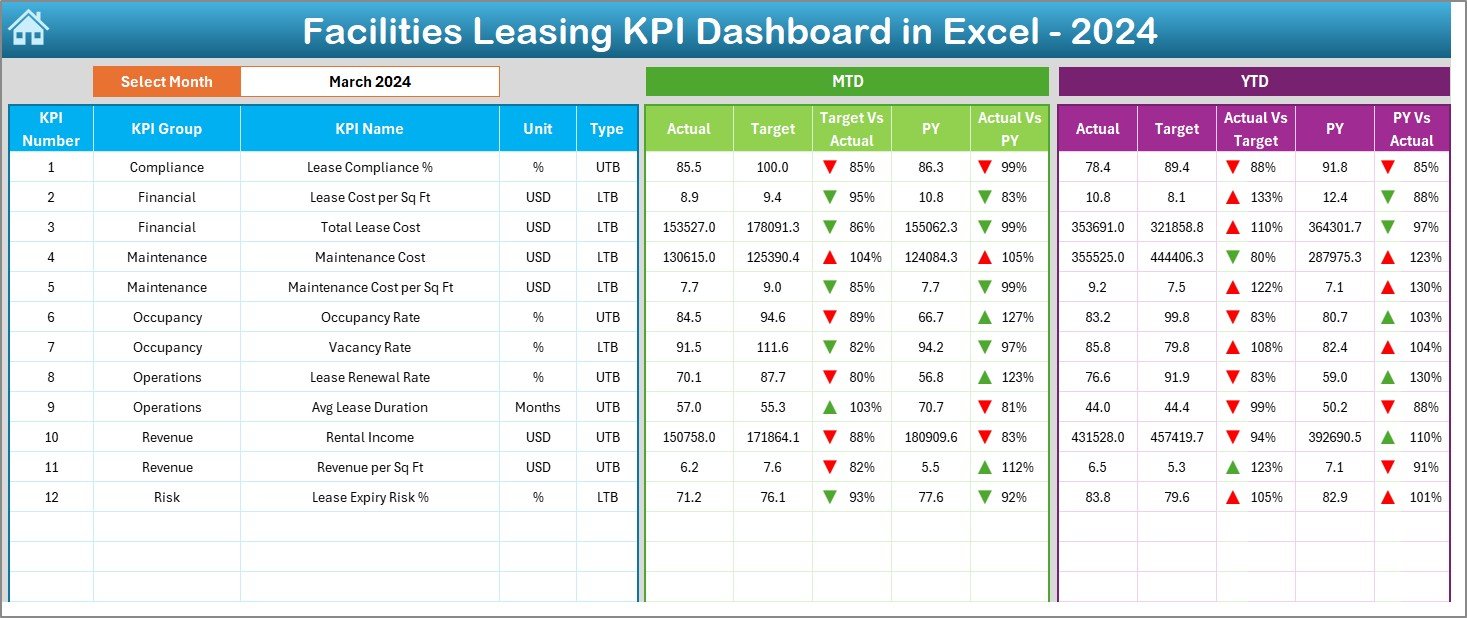
🎯 Target vs Actual Comparison – Instantly identify gaps between planned and actual leasing results.
📈 Previous Year Comparison – Analyze year-over-year growth, decline, and long-term trends.
🚦 Conditional Formatting Indicators – Visual arrows and indicators highlight performance instantly.
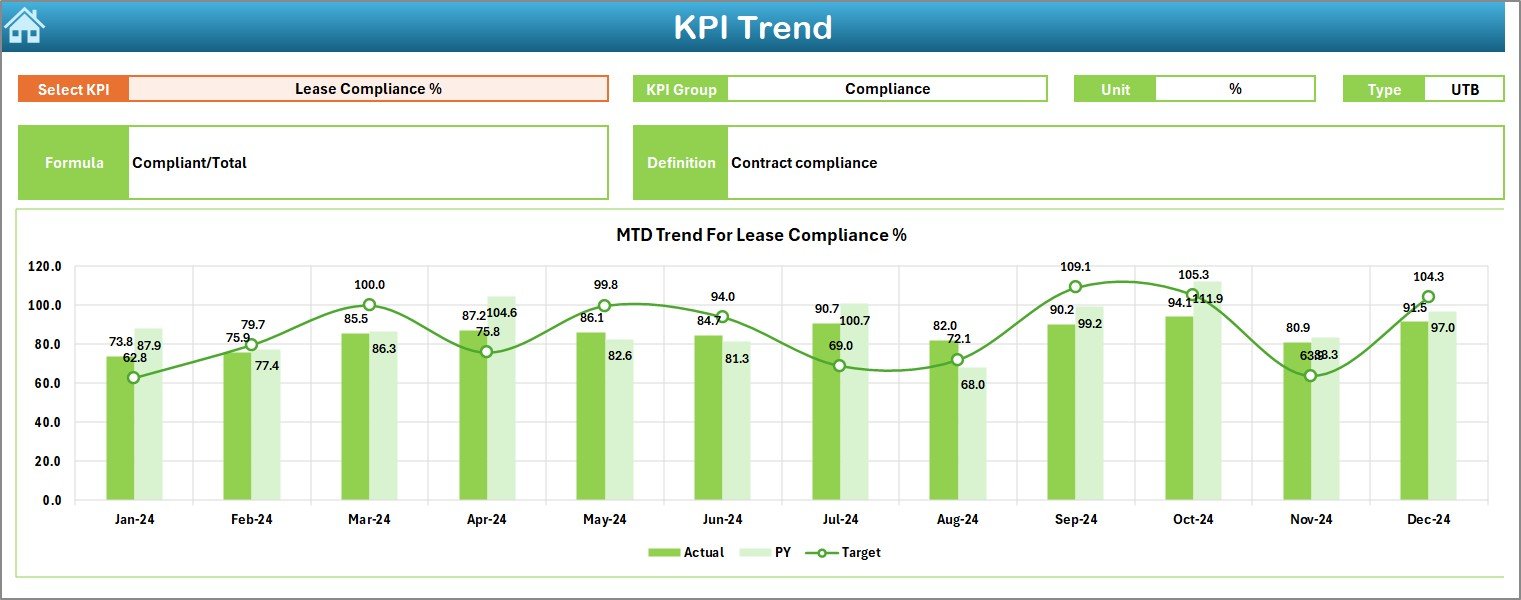
🔍 Interactive Trend Analysis – Deep-dive into KPI behavior across months using dynamic charts.
🧭 Easy Navigation – One-click buttons allow fast access to all dashboard sections.
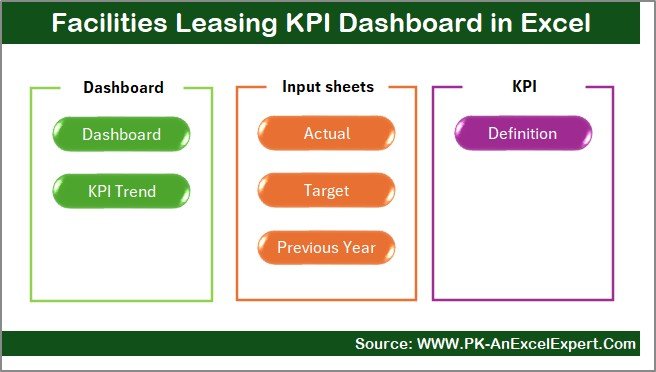
📦 What’s Inside the Facilities Leasing KPI Dashboard in Excel
This digital product includes 7 professionally designed Excel worksheets, each serving a specific purpose:
📘 Summary Page – A clean index page with navigation buttons for quick access.
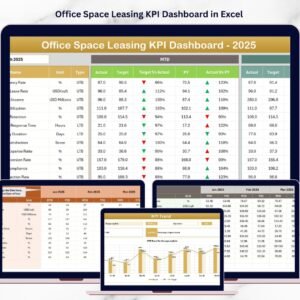
📊 Dashboard Sheet – The core visual dashboard showing all KPIs with month selection in cell D3.
📉 Trend Sheet – KPI-wise MTD and YTD trend charts with KPI definitions and formulas.
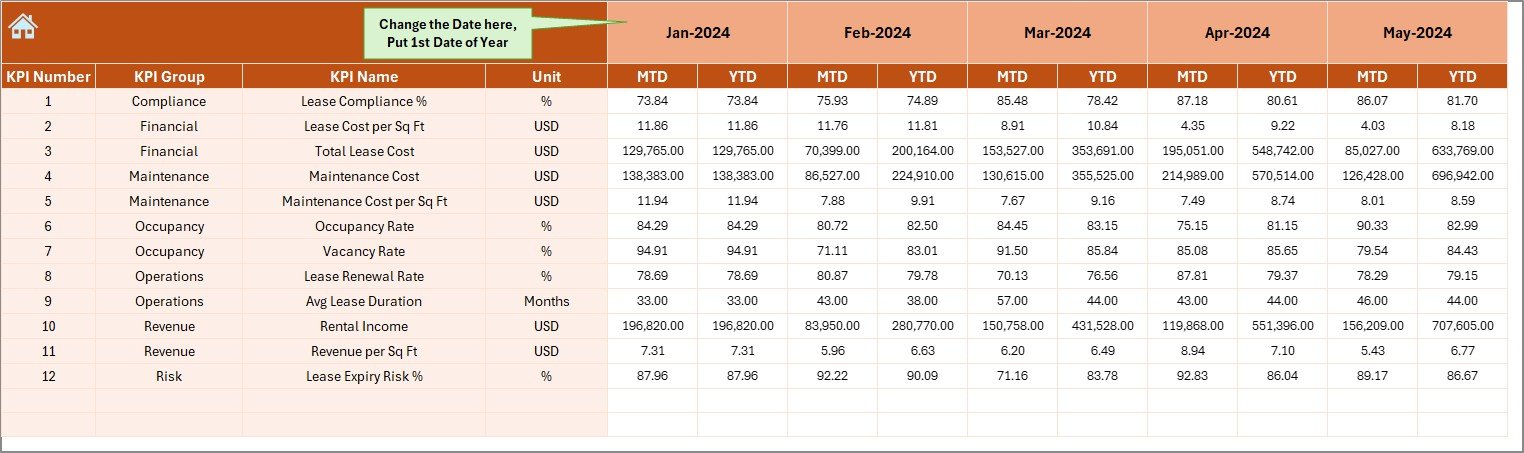
✍️ Actual Numbers Input Sheet – Simple data entry layout for monthly actual values.
🎯 Target Sheet – Store planned targets for accurate performance comparison.
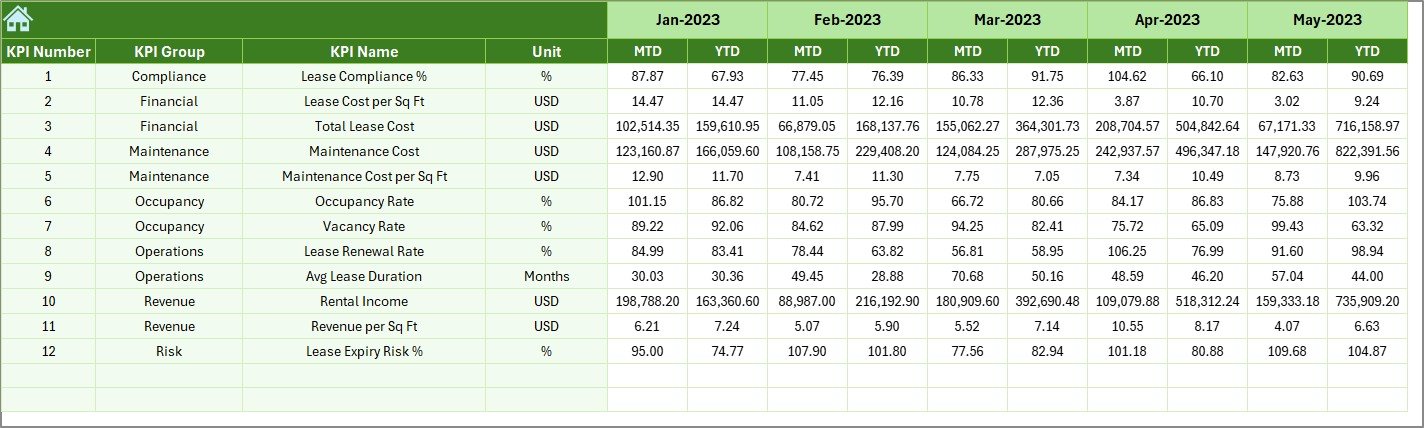
📅 Previous Year Numbers Sheet – Capture historical data for year-over-year analysis.
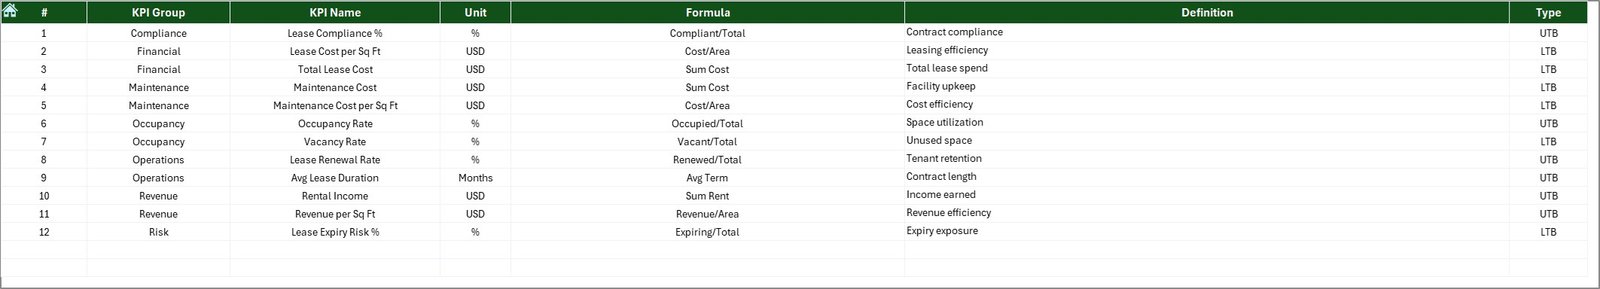
📑 KPI Definition Sheet – Clearly documented KPIs with unit, formula, definition, and KPI type (LTB/UTB).
Each sheet works together to deliver clarity, consistency, and performance intelligence.
▶️ How to Use the Facilities Leasing KPI Dashboard in Excel
Using this dashboard is simple and intuitive:
1️⃣ Enter your actual leasing data in the Actual Numbers Input Sheet
2️⃣ Define your monthly or yearly targets in the Target Sheet
3️⃣ Add last year’s values in the Previous Year Numbers Sheet
4️⃣ Select the month from the drop-down in the Dashboard Sheet
5️⃣ Instantly view KPI performance, variances, and trends
No macros, no coding, no learning curve—just structured Excel intelligence.
👥 Who Can Benefit from This Facilities Leasing KPI Dashboard in Excel
This dashboard is ideal for:
🏢 Facilities Managers managing leased spaces
🏬 Real Estate & Property Managers tracking occupancy and revenue
📊 Finance & Planning Teams monitoring lease performance
📋 Corporate Admin Teams handling multiple facilities
👔 Senior Management needing quick, visual insights
If you work with leasing data, this dashboard will save time, improve accuracy, and enhance decisions.
Click here to read the Detailed blog post
Watch the step-by-step video tutorial:
Visit our YouTube channel to learn step-by-step video tutorials:
Youtube.com/@PKAnExcelExpert


Reviews
There are no reviews yet.