Loan recovery directly impacts cash flow, profitability, and credit risk for banks, NBFCs, MFIs, and lending institutions. Yet many recovery teams still depend on scattered spreadsheets and manual reports. As a result, recovery actions get delayed, performance gaps remain hidden, and non-performing assets continue to rise.
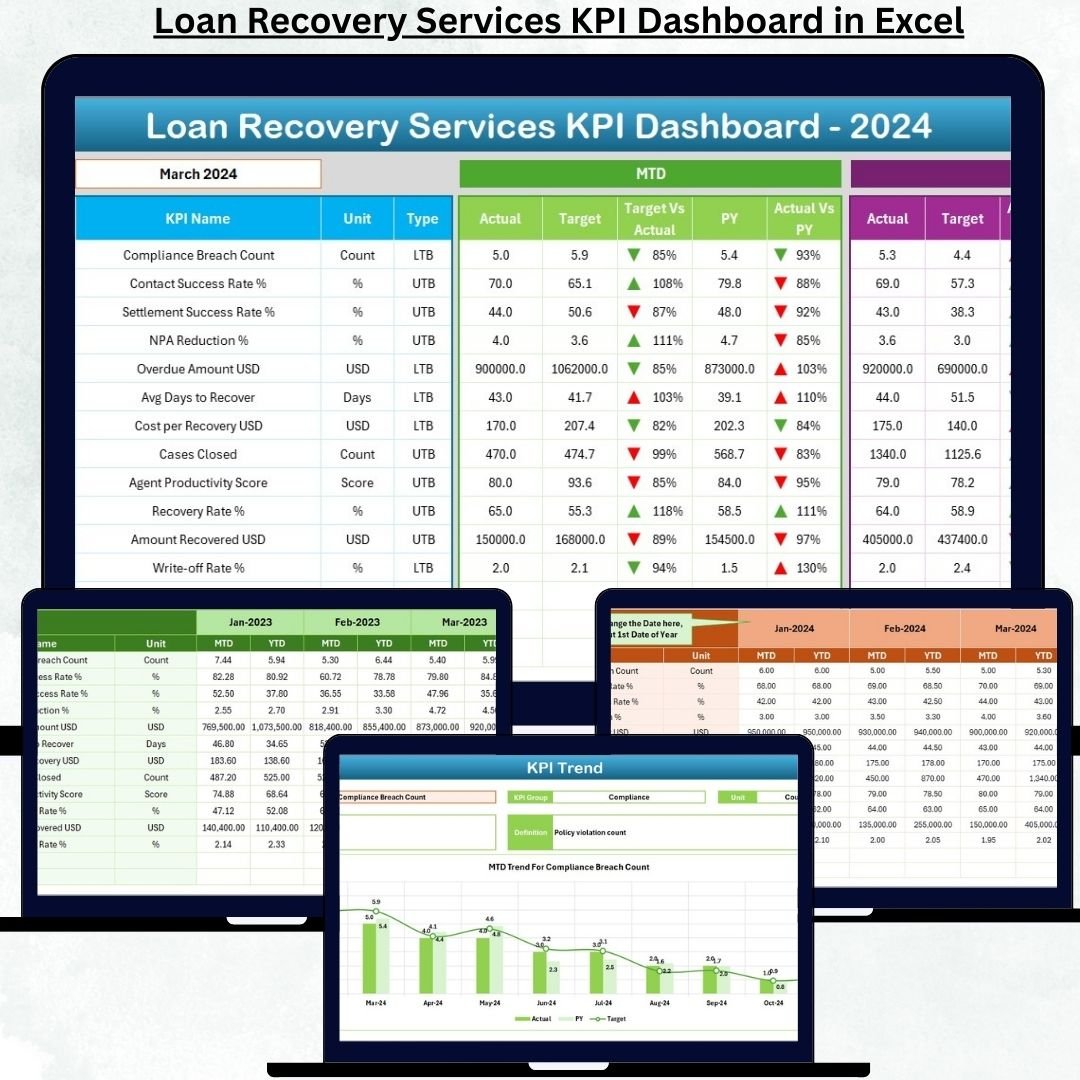
The Loan Recovery Services KPI Dashboard in Excel solves this problem by converting raw recovery data into clear, structured, and action-oriented insights. Loan Recovery Services KPI Dashboard in Excel This ready-to-use Excel dashboard allows recovery teams, managers, and leadership to track targets, actual collections, and trends from a single, interactive file. Because it works entirely in Excel, the dashboard requires no complex tools, BI software, or technical expertise.
With this dashboard, recovery operations become transparent, controlled, and performance-driven—helping organizations strengthen recovery strategies and reduce financial risk.
🚀 Key Features of the Loan Recovery Services KPI Dashboard in Excel
💰 Centralized Recovery KPI Tracking – Monitor all loan recovery KPIs in one dashboard
🎯 MTD & YTD Performance Visibility – Track short-term and cumulative recovery progress
✅ Target vs Actual Comparison – Instantly identify recovery gaps
📉 Previous Year Benchmarking – Measure improvement year over year
📊 Conditional Formatting Indicators – Red ▼ and Green ▲ arrows highlight performance
📅 Month-Wise Analysis – Change months with one drop-down
📈 KPI-Level Trend Analysis – Monitor recovery patterns over time
🧭 Easy Navigation Buttons – Jump across sheets without confusion
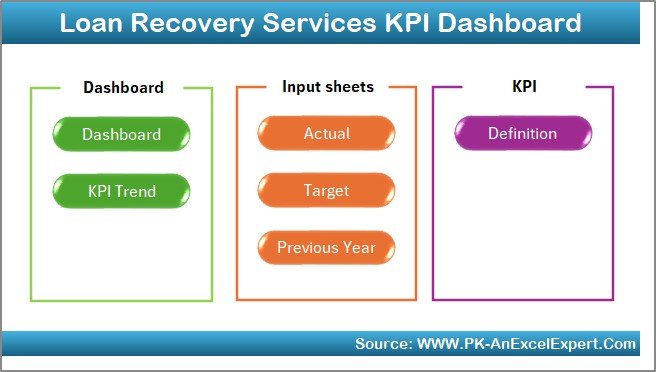
📦 What’s Inside the Loan Recovery Services KPI Dashboard
This Excel dashboard contains seven structured worksheets, designed to create a complete recovery performance management system.
🏠 Home Sheet
Acts as an index page with six navigation buttons that take users directly to key sheets, improving usability and speed.
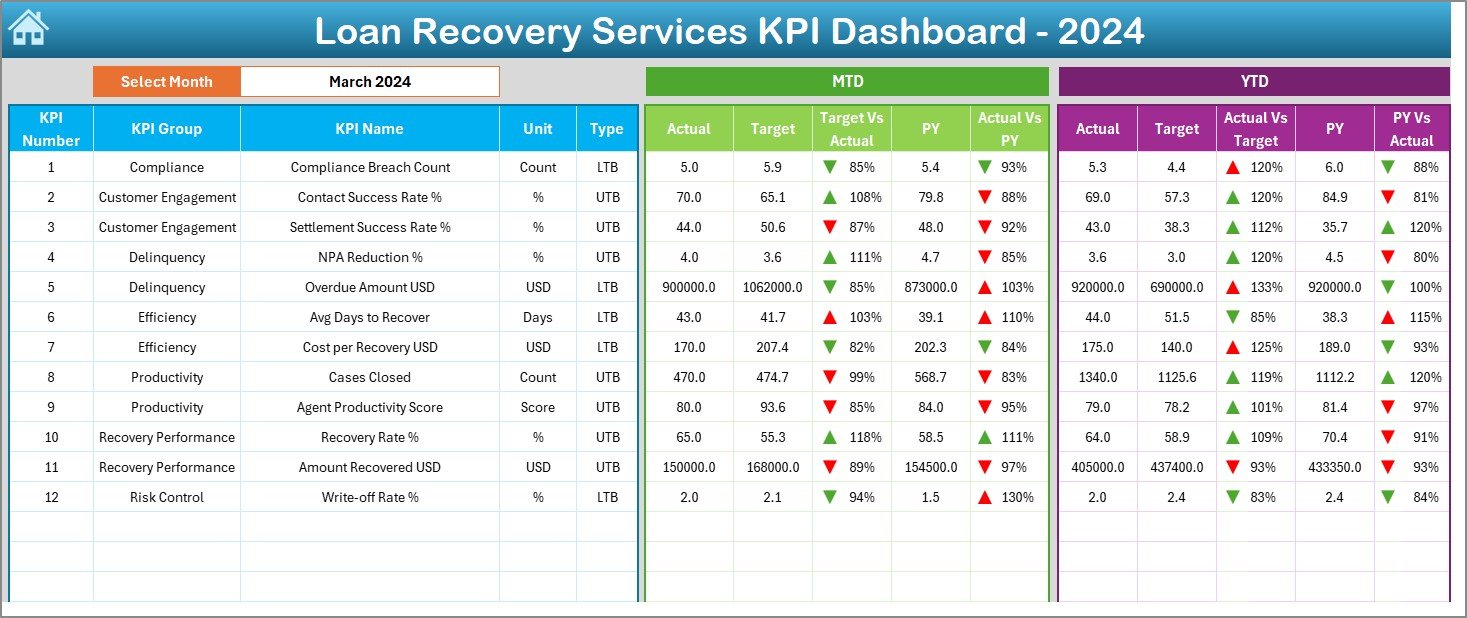
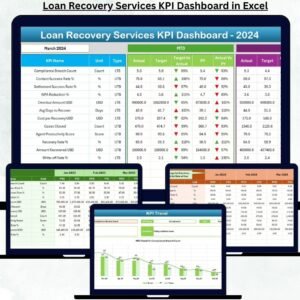
📊 Dashboard Sheet
The main performance view. Users select the reporting month, and the dashboard automatically updates to display MTD and YTD recovery Actuals, Targets, Previous Year values, and comparison ratios with visual arrows.
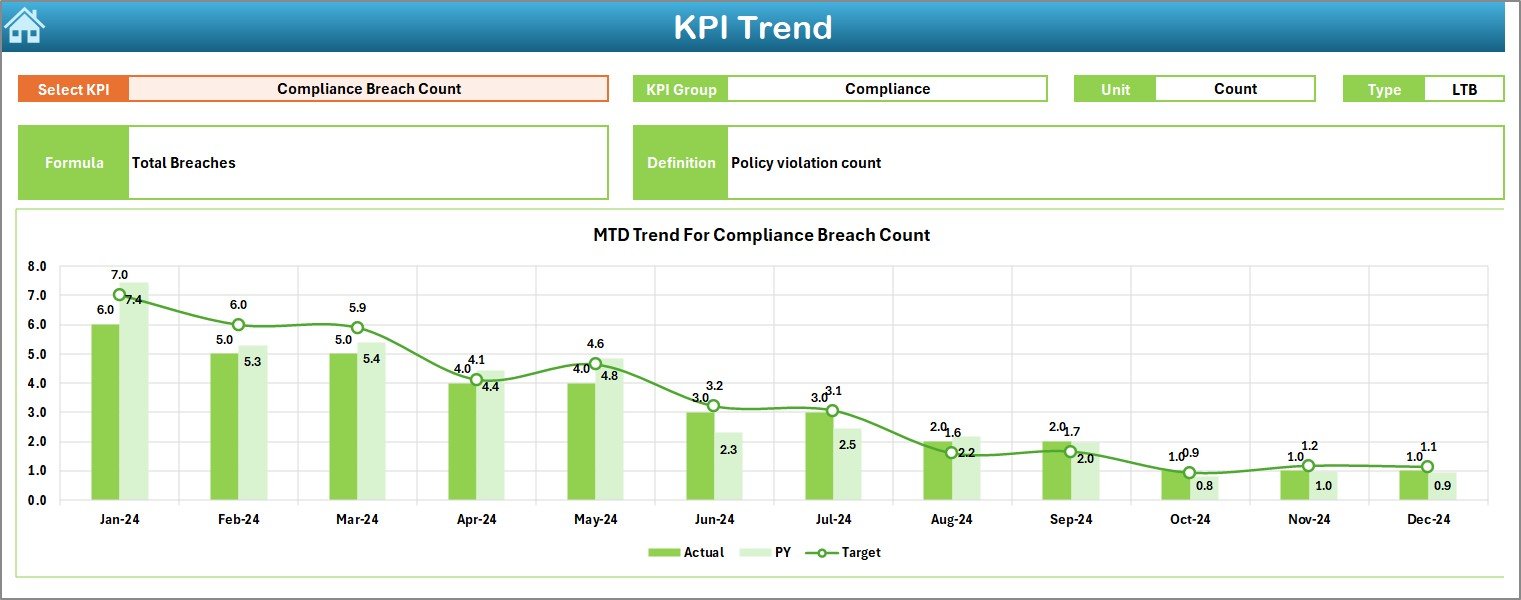
📉 KPI Trend Sheet
Provides deep KPI-wise analysis. After selecting a KPI, users can view KPI details, definitions, and MTD & YTD trend charts comparing Actual, Target, and Previous Year values.
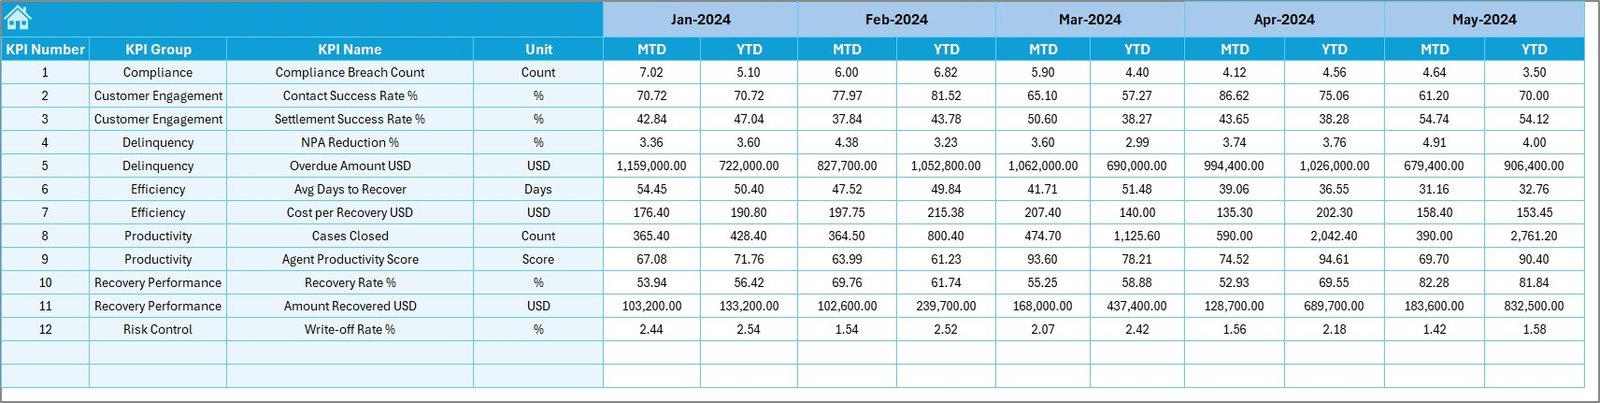
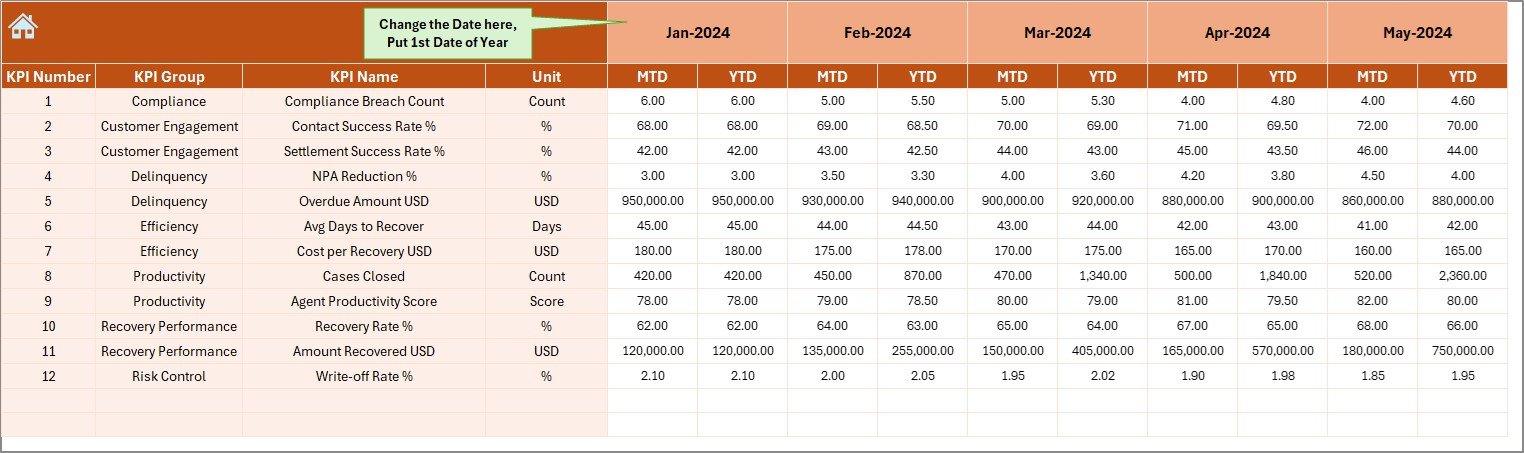
✍ Actual Numbers Input Sheet
Stores real recovery data. Users enter MTD and YTD actual recovery values, which feed all dashboard calculations.
🎯 Target Sheet
Captures KPI-wise MTD and YTD recovery targets, keeping planned goals separate from performance data.
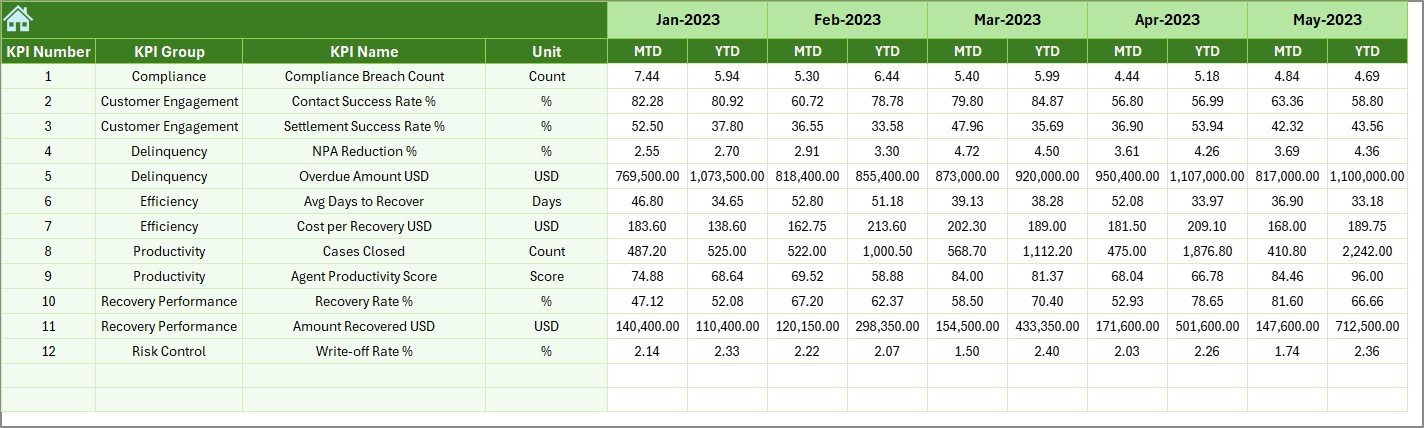
📆 Previous Year Number Sheet
Stores historical recovery data to enable accurate year-over-year comparison and trend analysis.
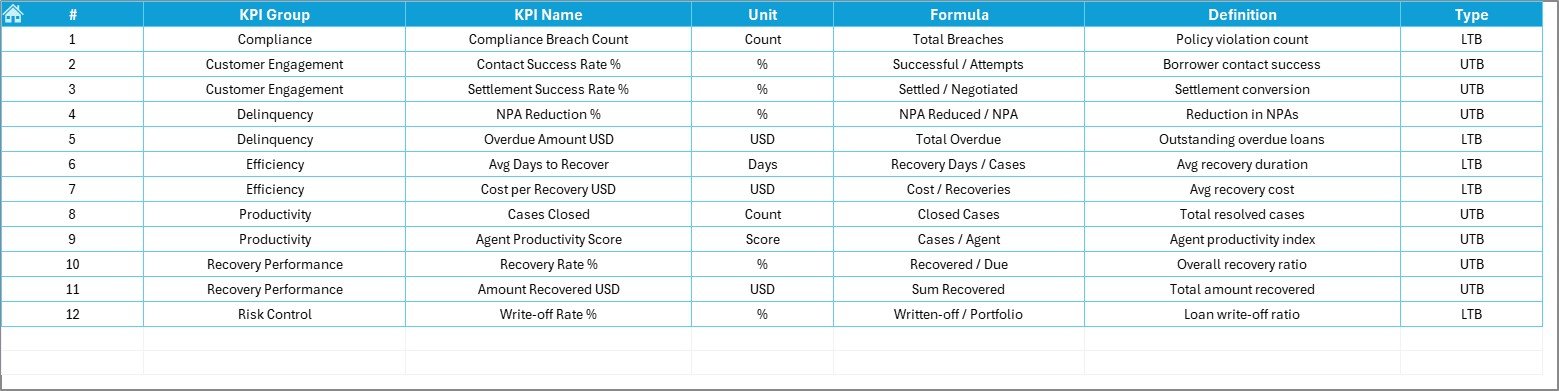
📘 KPI Definition Sheet
Defines KPI Name, Group, Unit, Formula, and Definition—ensuring consistent and standardized KPI tracking.
🛠️ How to Use the Loan Recovery Services KPI Dashboard
✅ Step 1: Enter recovery actuals in the Actual Numbers sheet
✅ Step 2: Maintain targets in the Target Sheet
✅ Step 3: Update previous year data once
✅ Step 4: Select the reporting month from the Dashboard
✅ Step 5: Review KPIs, trends, and performance indicators
No advanced Excel skills are required. The dashboard is plug-and-play and business-friendly.
👥 Who Can Benefit from This Loan Recovery Dashboard?
🏦 Loan Recovery Teams
📉 Credit Risk Managers
💼 Collection Department Heads
📊 Finance & Analytics Teams
👔 Senior Management
Any organization managing loan recovery operations will benefit from better visibility, accountability, and faster decisions.
🔗 Click here to read the Detailed blog post
🎥 Visit our YouTube channel to learn step-by-step video tutorials


Reviews
There are no reviews yet.