Unexpected disruptions are no longer rare events. Cyber incidents, system failures, natural disasters, supply-chain breakdowns, and operational outages can stop business activities within minutes. In such situations, organizations need clear visibility, fast insights, and structured response metrics. That is exactly why a Business Continuity Planning Dashboard in Excel becomes a mission-critical tool for modern organizations.
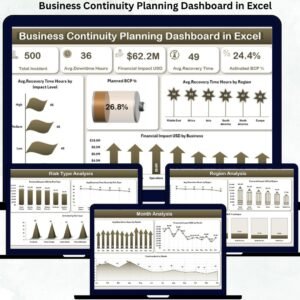
The Business Continuity Planning Dashboard in Excel is a ready-to-use, interactive dashboard designed to help organizations monitor, analyze, and improve continuity readiness in one centralized Excel file. Instead of managing scattered spreadsheets and static reports, this dashboard brings together recovery times, downtime metrics, financial impact, incident trends, and BCP coverage into clean visuals and KPI cards.
Built entirely in Excel, this dashboard remains simple, flexible, and cost-effective. You do not need complex BI tools, coding skills, or expensive software. Even non-technical professionals can understand continuity risk at a glance and take confident, data-driven decisions when disruptions occur.
✨ Key Features of the Business Continuity Planning Dashboard in Excel
This professionally structured dashboard includes five analytical pages, a left-side page navigator, right-side slicers, KPI cards, and automated visuals.
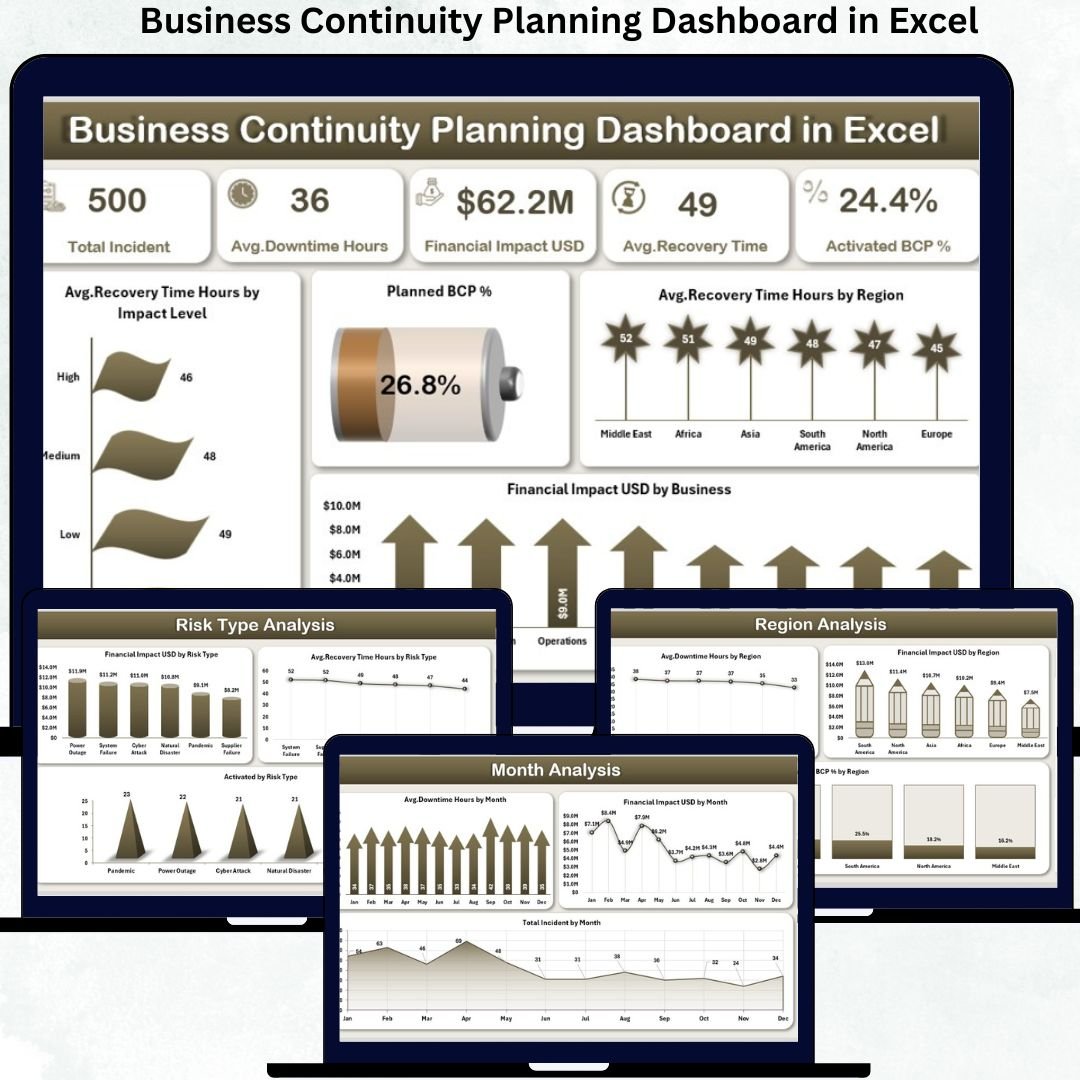
⭐ Overview Page – Continuity Readiness at a Glance
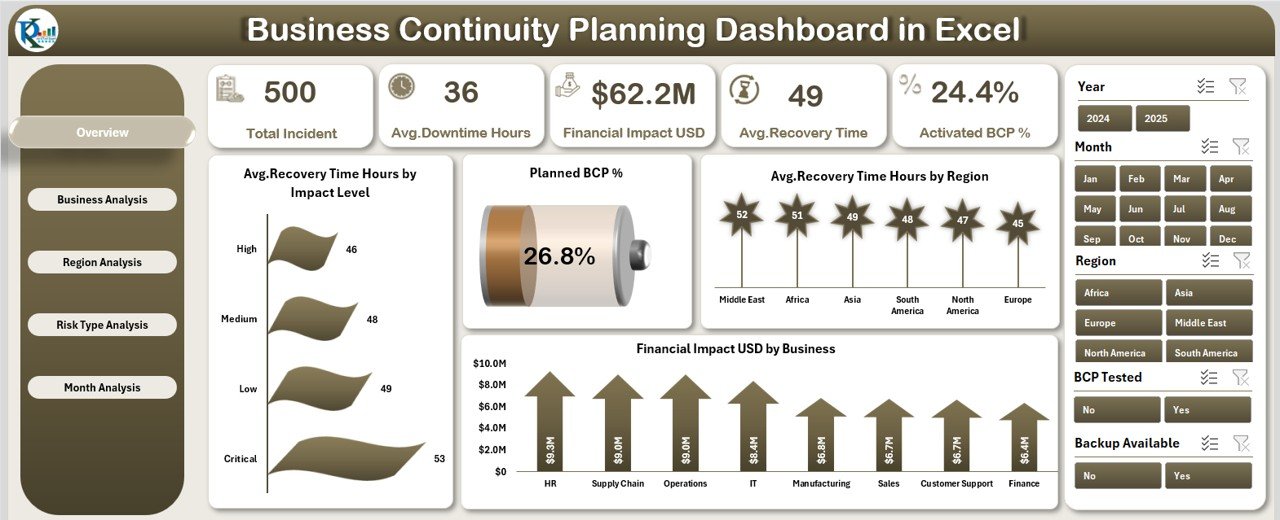
✔ Right-side slicer for quick filtering
✔ Five high-level KPI cards showing continuity health
✔ Four critical charts, including:
-
Average Recovery Time (Hours) by Impact Level
-
Planned BCP %
-
Average Recovery Time (Hours) by Region
-
Financial Impact (USD) by Business
This page allows leadership to assess preparedness within seconds.
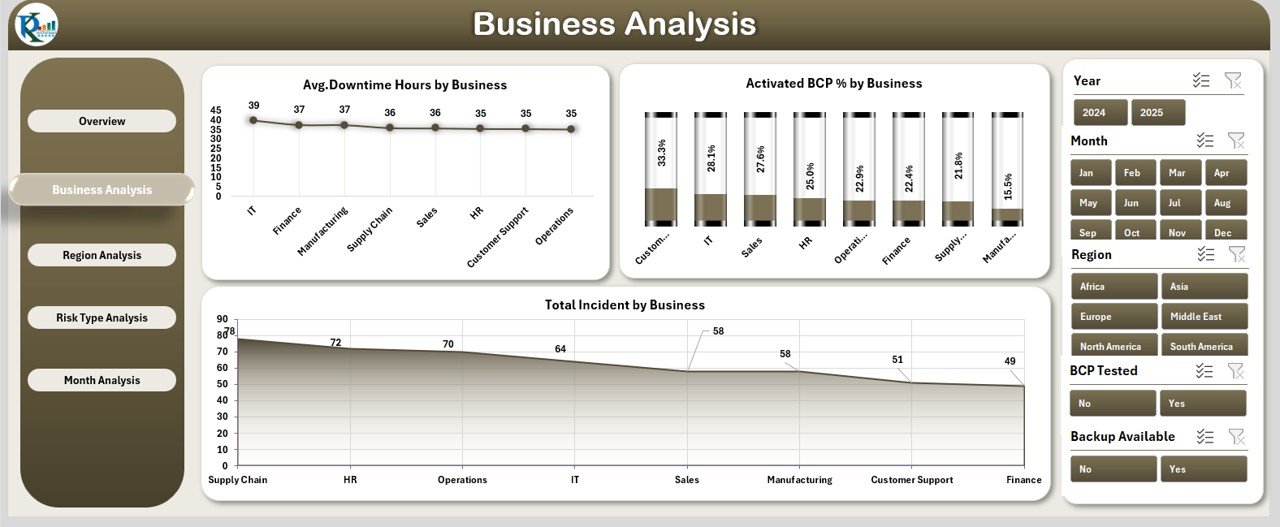
⭐ Business Analysis Page – Business Unit Risk Visibility
✔ Average Downtime Hours by Business
✔ Active BCP % by Business
✔ Total Incidents by Business
This page clearly highlights business units with higher exposure and weaker continuity coverage.
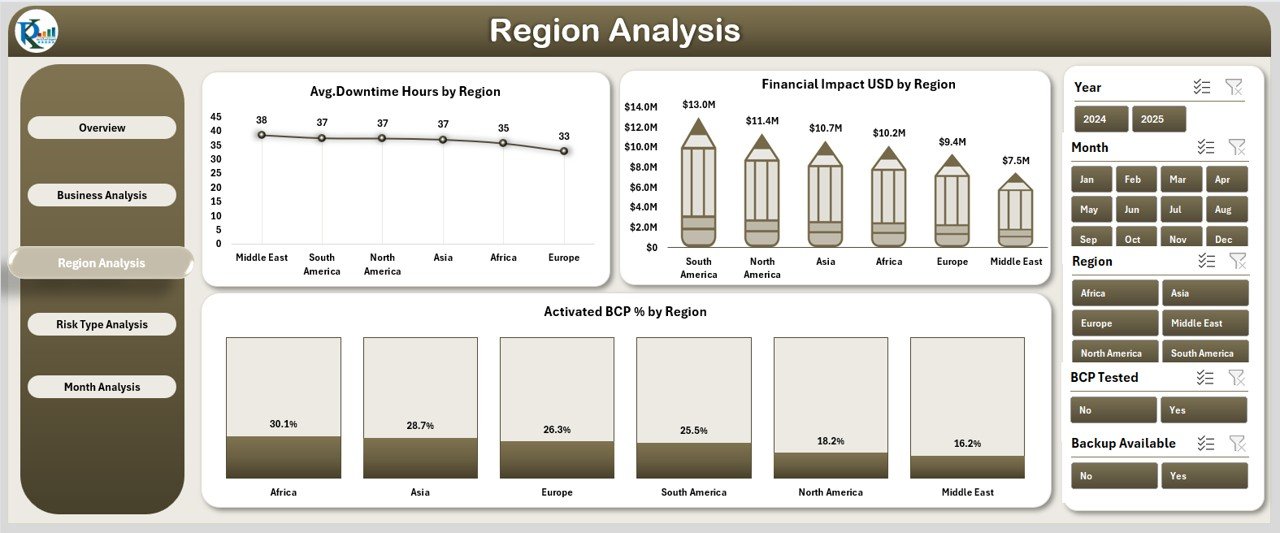
⭐ Region Analysis Page – Geographic Risk Intelligence
✔ Average Downtime Hours by Region
✔ Active BCP % by Region
✔ Financial Impact (USD) by Region
With this view, organizations can prioritize regional risk mitigation and resource allocation.
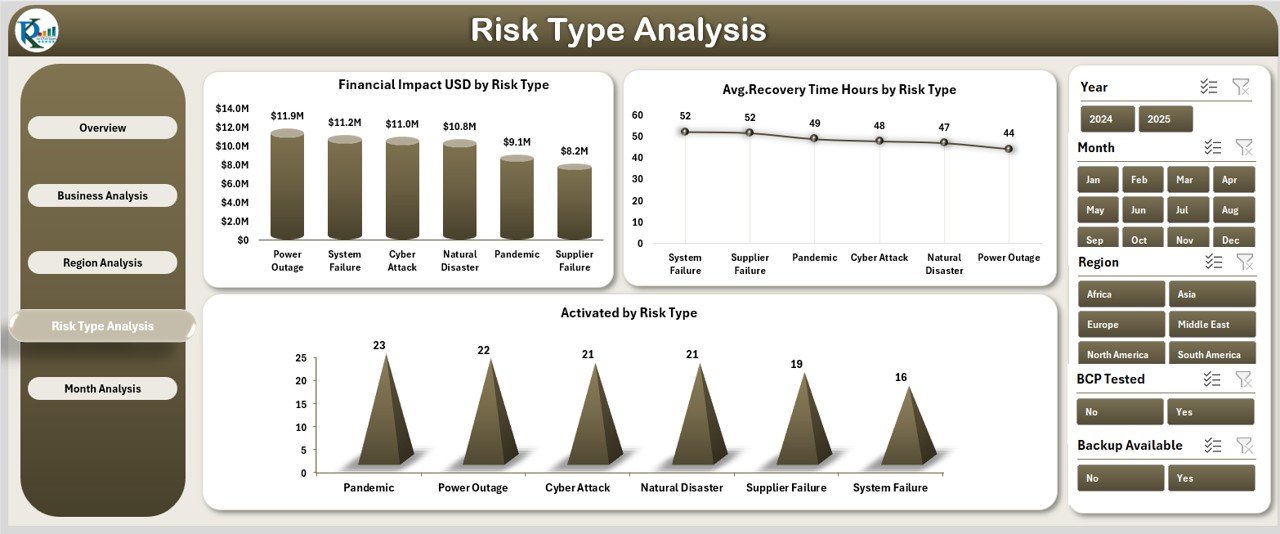
⭐ Risk Type Analysis Page – Identify High-Impact Threats
✔ Active BCP % by Risk Type
✔ Financial Impact (USD) by Risk Type
✔ Average Recovery Time (Hours) by Risk Type
This page helps teams strengthen controls for the most damaging risk categories.
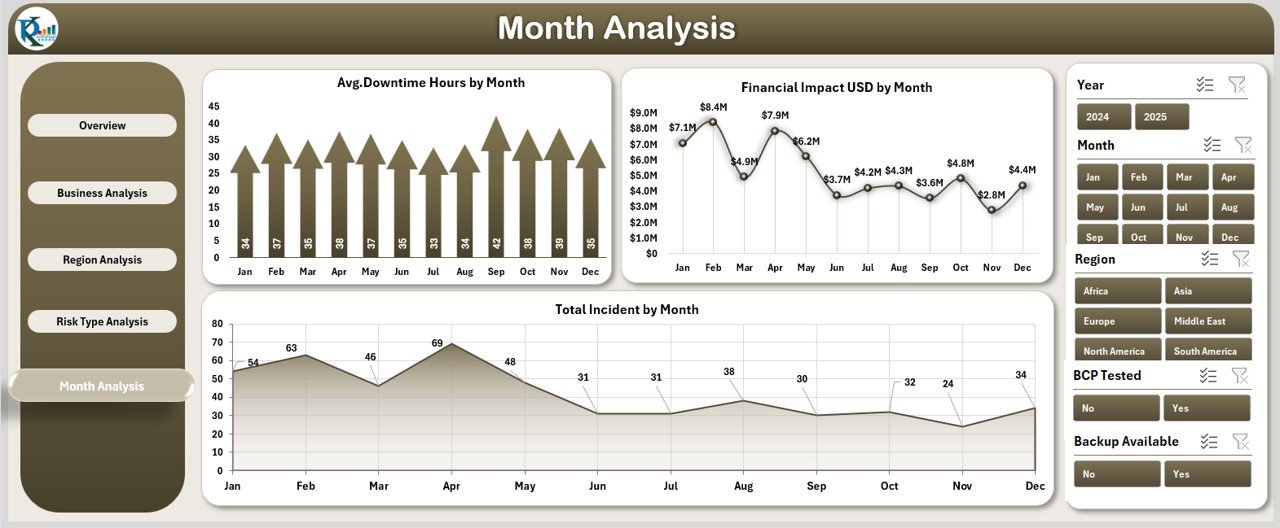
⭐ Month Analysis Page – Track Continuity Trends Over Time
✔ Financial Impact (USD) by Month
✔ Average Downtime Hours by Month
✔ Total Incidents by Month
Trend analysis supports proactive planning rather than reactive firefighting.
📦 What’s Inside the Business Continuity Planning Dashboard in Excel
When you download this product, you get:
✨ A ready-to-use Excel dashboard file
✨ Five interactive analysis pages
✨ Left-side page navigator for smooth navigation
✨ Right-side slicers for deep filtering
✨ KPI cards for instant decisions
✨ Automated charts linked to the data
✨ A structured Data Sheet for updates
✨ A Support Sheet for dropdowns and automation
Everything refreshes automatically when data changes.
🛠️ How to Use the Business Continuity Planning Dashboard in Excel
1️⃣ Update continuity data in the Data Sheet
2️⃣ Navigate pages using the left-side page navigator
3️⃣ Apply slicers to filter by business, region, or risk type
4️⃣ Review KPI cards for immediate risk insights
5️⃣ Analyze downtime, recovery time, and financial impact
6️⃣ Identify vulnerable areas early
7️⃣ Take corrective actions and update continuity plans
No advanced Excel knowledge is required—basic usage is sufficient.
👥 Who Can Benefit from This Business Continuity Planning Dashboard in Excel
This dashboard is ideal for:
✔ Business Continuity Managers
✔ Risk Management Teams
✔ IT & Operations Leaders
✔ Compliance & Audit Teams
✔ Crisis Management Committees
✔ Senior Executives & Leadership
✔ Small, Medium, and Large Organizations
Anyone responsible for resilience will find this dashboard invaluable.
### 📘 Click here to read the Detailed blog post
🎥 Visit our YouTube channel to learn step-by-step video tutorials
👉 Youtube.com/@PKAnExcelExpert


Reviews
There are no reviews yet.