
Managing a brand is no longer about creativity alone. In today’s competitive market, data-driven decisions define brand success. However, many organizations still struggle with scattered reports, unclear KPIs, and delayed performance insights. That is exactly where the Brand Management KPI Dashboard in Excel becomes a powerful game-changer.
This ready-to-use Excel dashboard transforms raw brand data into clear, actionable insights. Instead of juggling multiple spreadsheets and presentations, you get a single, structured dashboard to monitor brand performance monthly, yearly, and historically. As a result, decision-making becomes faster, smarter, and more confident.
Designed for simplicity and flexibility, this dashboard requires no coding, no BI tools, and no advanced Excel expertise. You just enter the data, and Excel does the rest—calculations, comparisons, visuals, and trends.
🔑 Key Feature of Brand Management KPI Dashboard in Excel
🚀 Centralized KPI Tracking – Track all brand-related KPIs in one structured Excel file
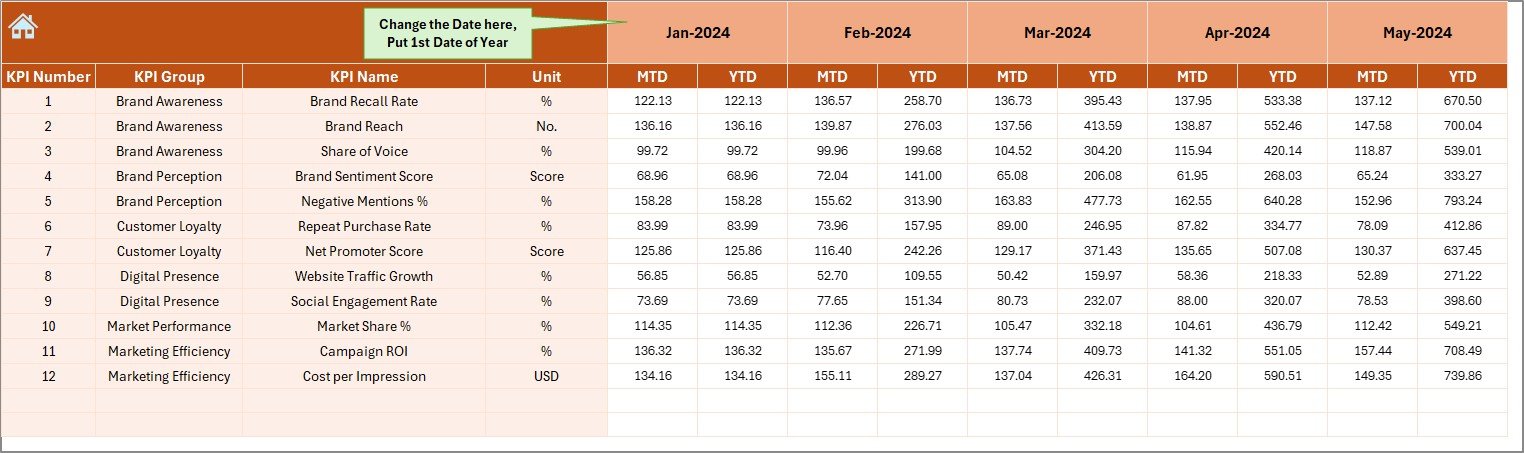
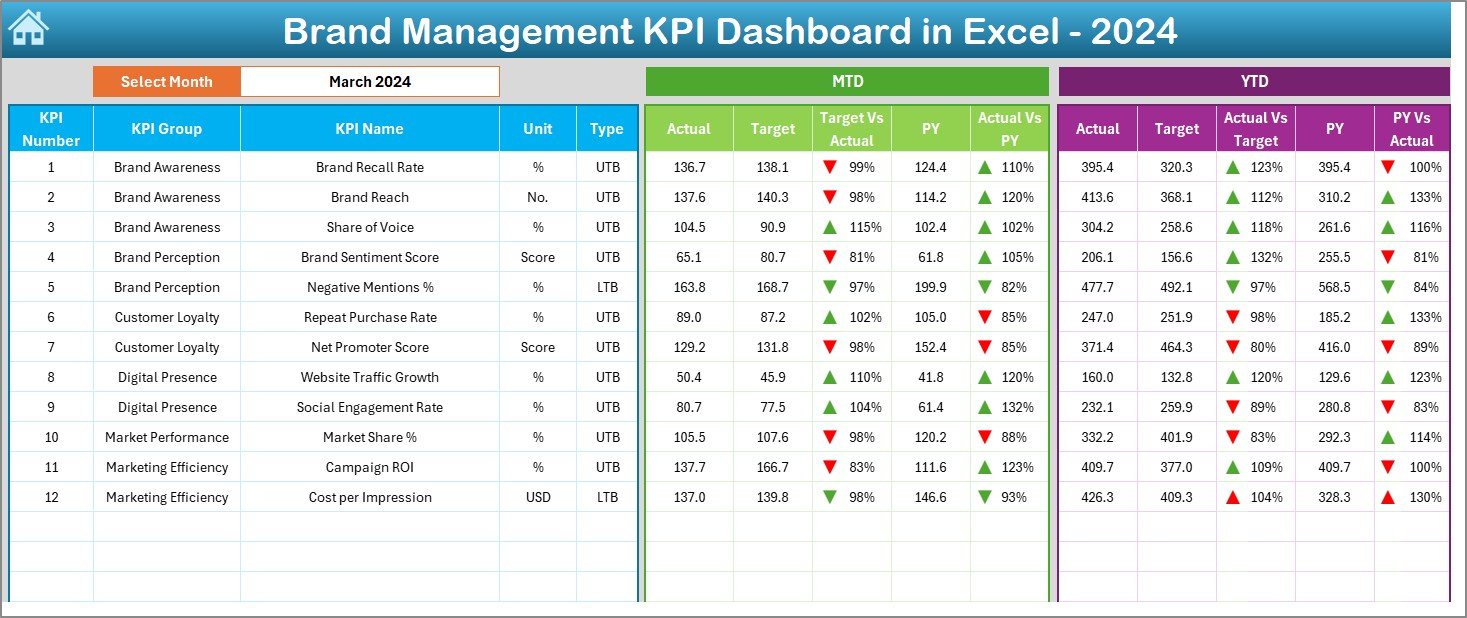
📅 MTD & YTD Performance Monitoring – Instantly view Month-to-Date and Year-to-Date results
🎯 Target vs Actual Comparison – Identify performance gaps with clear variance analysis
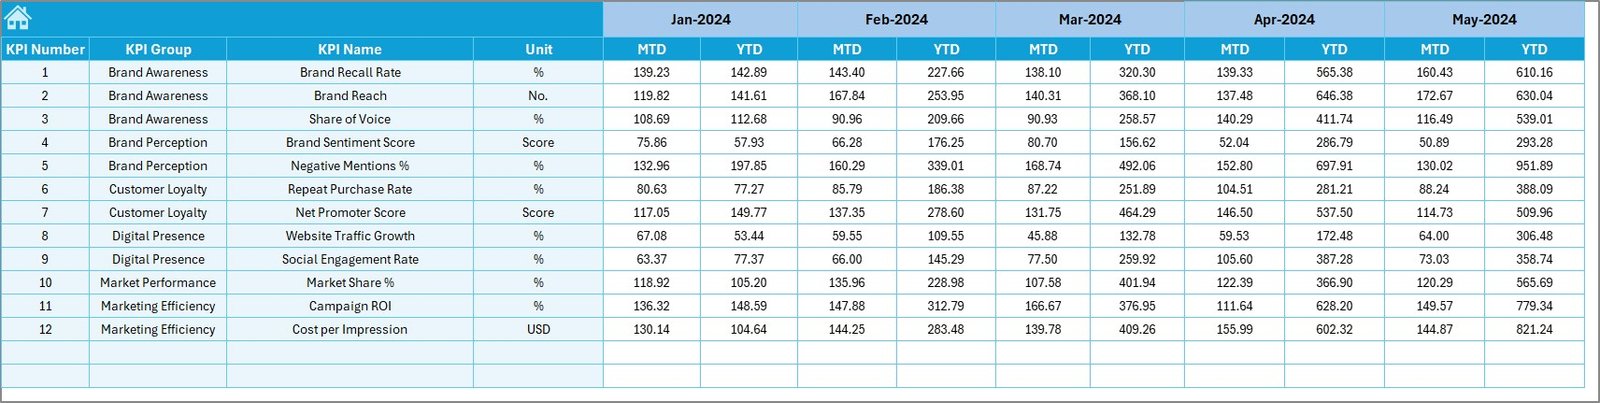
📊 Previous Year Benchmarking – Measure brand growth using PY vs Current Year comparison
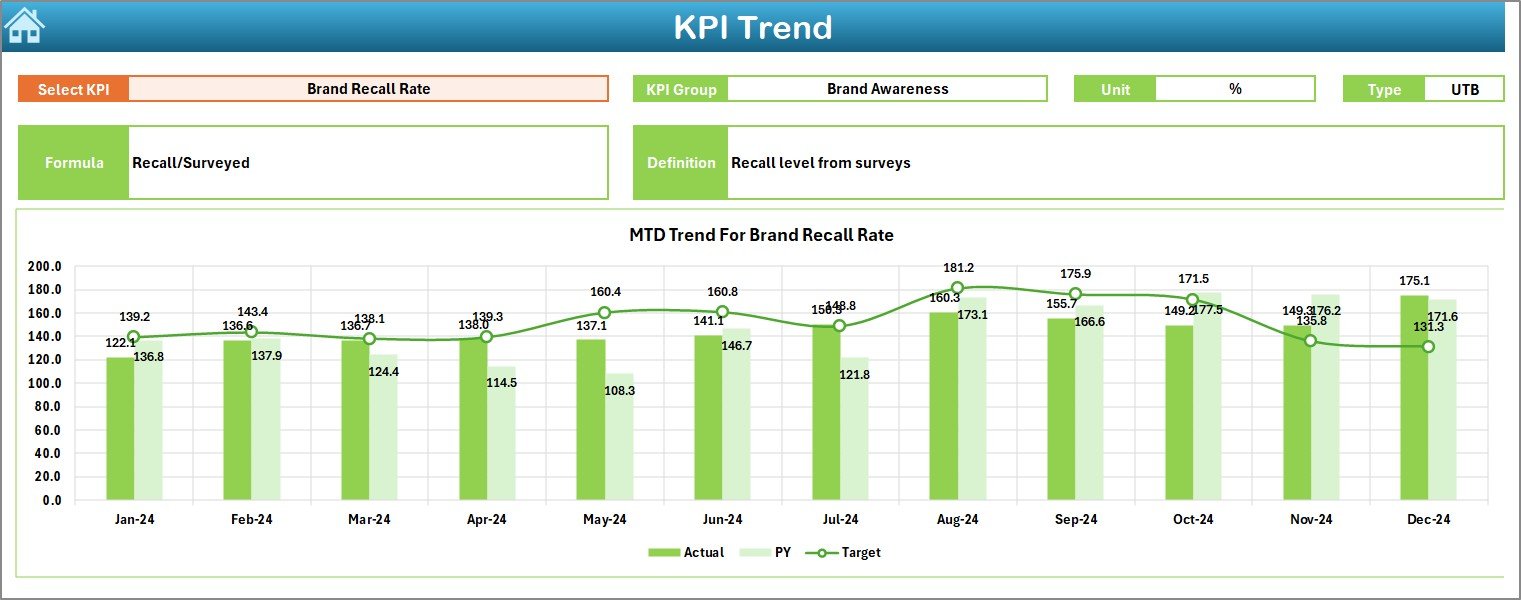
📉 Trend Analysis by KPI – Understand performance direction through dynamic trend charts
⬆️⬇️ Conditional Formatting Indicators – Instantly spot improvement or decline using arrows
🧭 Easy Navigation – One-click buttons simplify movement between dashboard sheets
⚙️ 100% Customizable – Easily add, edit, or remove KPIs as your brand strategy evolves
📦 What’s Inside the Brand Management KPI Dashboard in Excel
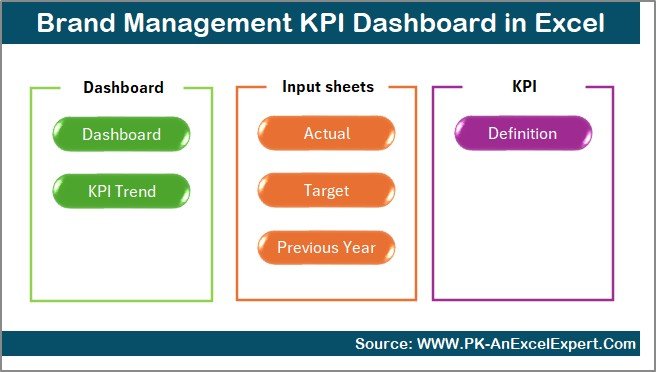
This digital product includes 7 intelligently designed Excel worksheets, each serving a specific analytical purpose:
📌 Summary Page – Acts as an index page with interactive navigation buttons
📌 Dashboard Page – Displays all KPIs with MTD, YTD, Target, and PY comparisons
📌 Trend Page – Shows KPI-wise MTD and YTD trend charts with KPI details
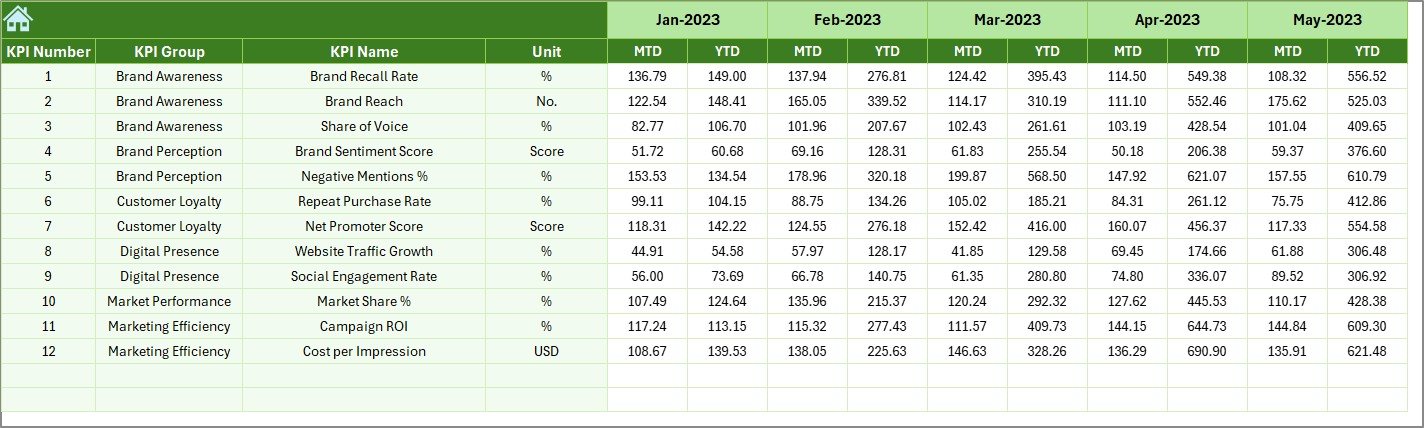
📌 Actual Numbers Sheet – Enter real performance values with flexible month selection
📌 Target Sheet – Define monthly and yearly brand performance expectations
📌 Previous Year Sheet – Store historical data for year-over-year analysis
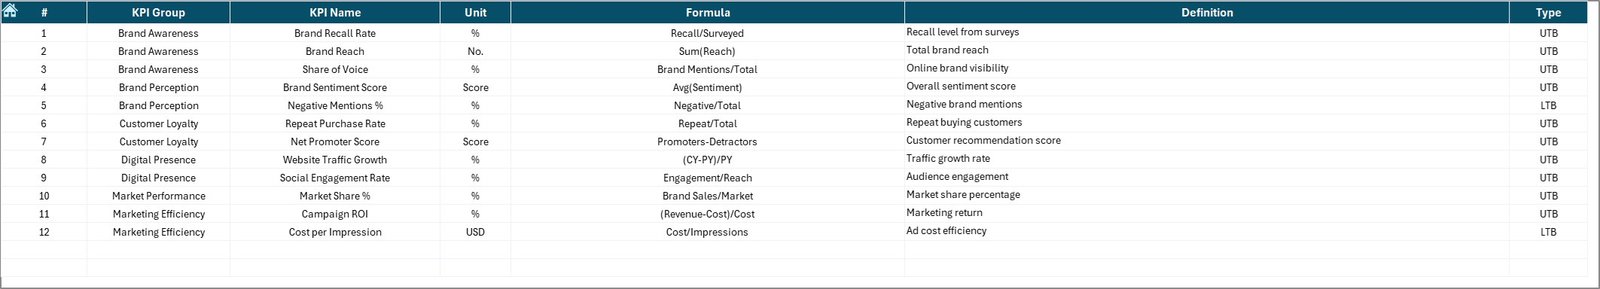
📌 KPI Definition Sheet – Maintain standardized KPI names, formulas, units, and types
Together, these sheets create a complete brand performance management system.
🚀 How to Use the Brand Management KPI Dashboard in Excel
Using this dashboard is simple and intuitive:
1️⃣ Define your brand KPIs in the KPI Definition Sheet
2️⃣ Enter Actual, Target, and Previous Year data
3️⃣ Select the month using the dropdown
4️⃣ Review MTD and YTD performance instantly
5️⃣ Analyze trends and performance gaps
6️⃣ Take data-backed strategic actions
Because Excel automates calculations and visuals, you focus only on insights—not manual work.
👥 Who Can Benefit from This Brand Management KPI Dashboard in Excel
This dashboard is ideal for professionals who want clarity and control over brand performance:
✅ Brand Managers
✅ Marketing Managers
✅ Digital Marketing Teams
✅ Corporate Strategy Teams
✅ Business Owners & Founders
✅ Marketing Consultants & Analysts
Whether you manage one brand or multiple portfolios, this dashboard adapts seamlessly.
📖 Click here to read the Detailed blog post
Watch the step-by-step video tutorial:


Reviews
There are no reviews yet.