Artificial Intelligence is now at the center of global innovation, helping teams automate tasks, improve accuracy, and work faster than ever before. But while AI continues to expand across industries, many organizations still operate with scattered spreadsheets, disconnected reports, and slow manual tracking. This leads to blind spots—teams miss performance fluctuations, cannot compare AI models effectively, and struggle to identify cost or latency issues at the right time.
The Artificial Intelligence (AI) Dashboard in Excel solves all these challenges instantly. This ready-to-use, interactive dashboard gives your team a clear and structured view of AI performance—without coding, without BI tools, and without any technical complexity. Since it works in Excel, every department can use it effortlessly.
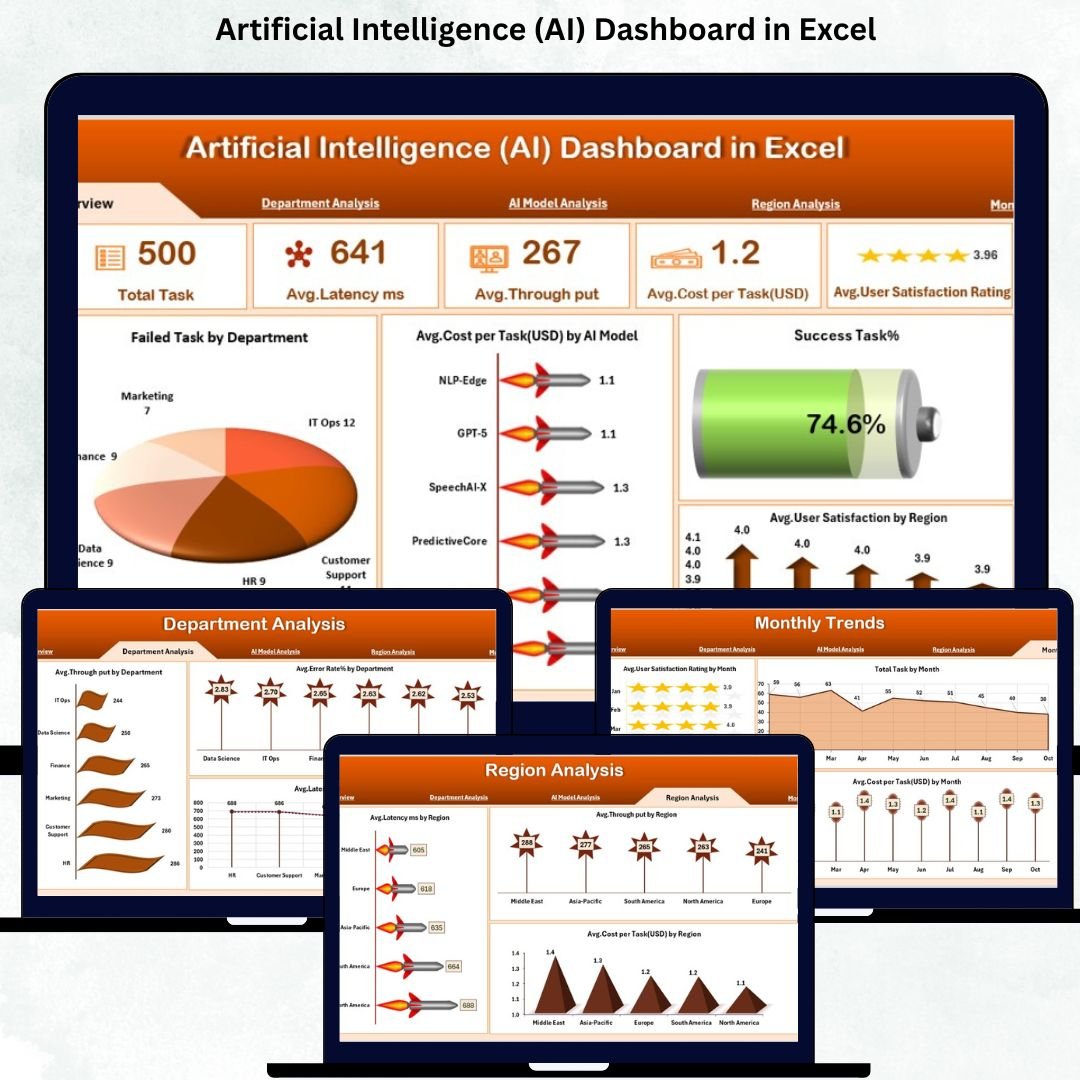
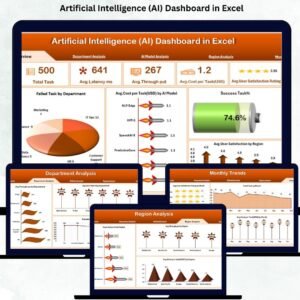
This dashboard transforms raw data into real-time insights, helping you monitor total tasks, latency, throughput, cost per task, satisfaction levels, model performance, regional behavior, and monthly trends—all inside one clean and professional Excel file.
If you want complete visibility of your AI operations, this dashboard is the perfect solution.
✨ Key Features of the Artificial Intelligence (AI) Dashboard in Excel
This dashboard includes multiple analytical pages designed to give you a 360° view of AI operations:
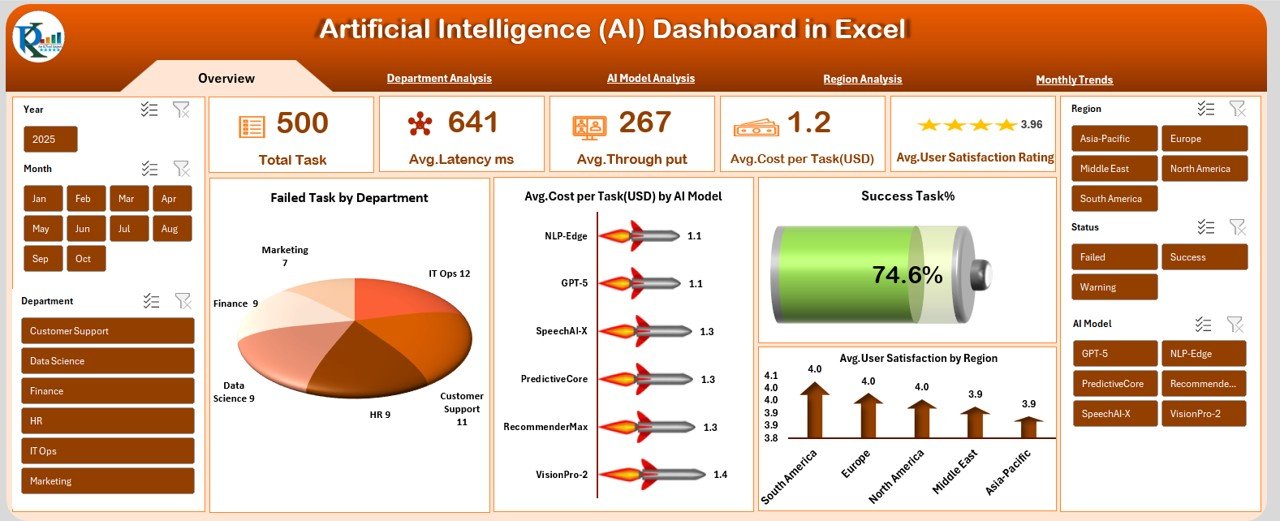
🔹 Overview Page
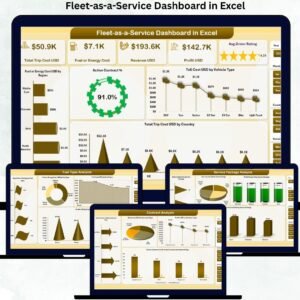
Get instant clarity with KPIs such as Total Tasks, Avg. Latency, Avg. Throughput, Avg. Cost per Task, Success Rate, Published Content %, and more. Compare model costs and departmental failures in one snapshot.
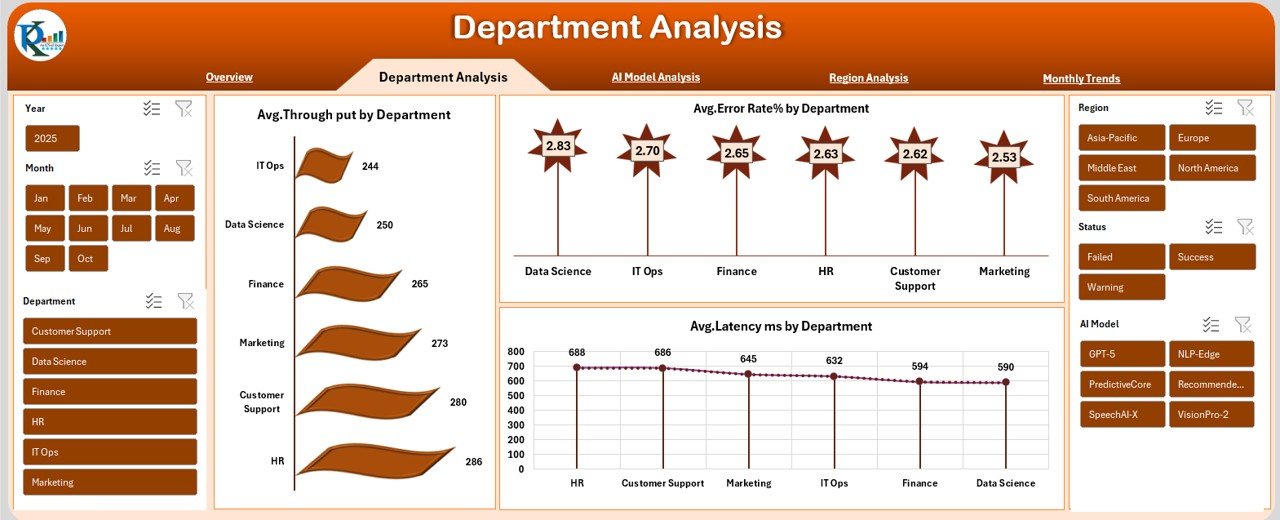
🔹 Department Analysis Page
Identify which departments experience higher latency, higher error rates, or stronger AI adoption. Great for cross-team improvement and performance optimization.
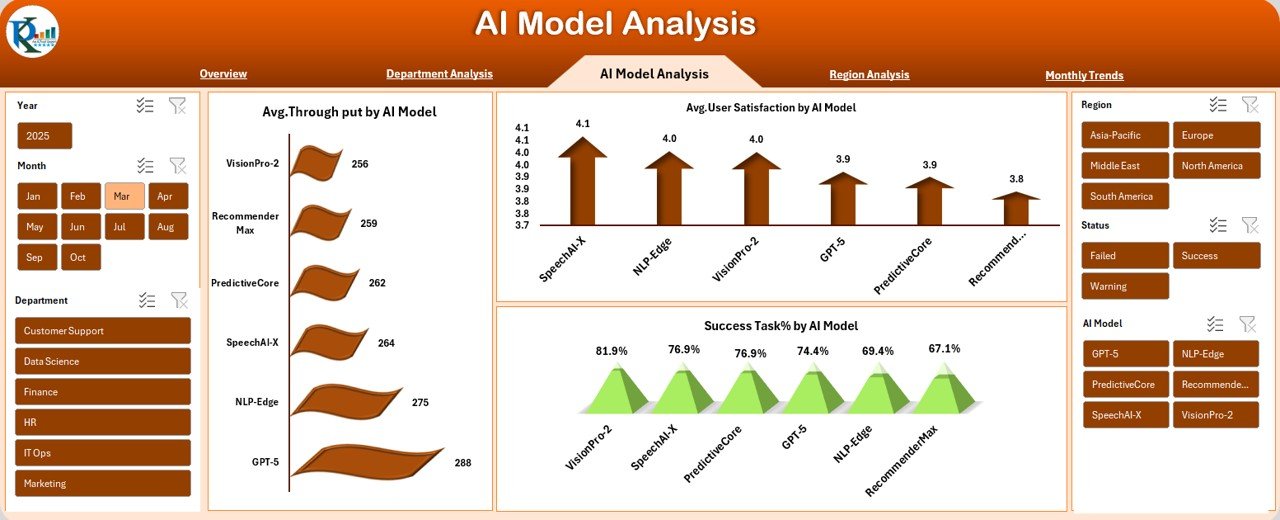
🔹 AI Model Analysis Page
Compare AI models based on throughput, satisfaction, and success rate. Perfect for model selection, performance tuning, and resource planning.
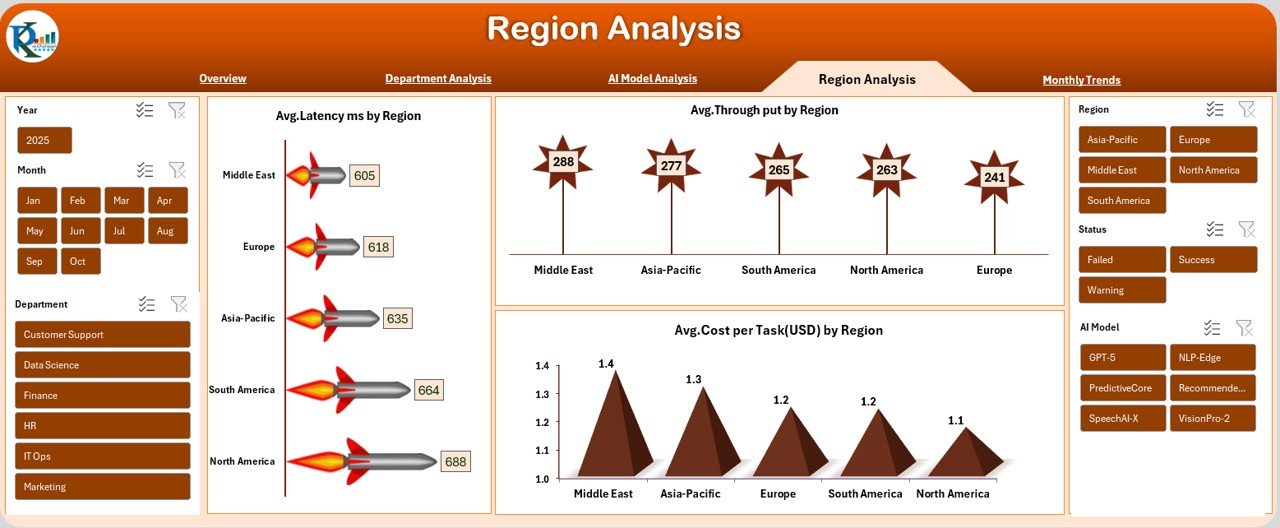
🔹 Region Analysis Page
Understand how AI performance varies across regions—track regional latency, throughput, and cost differences to optimize infrastructure.
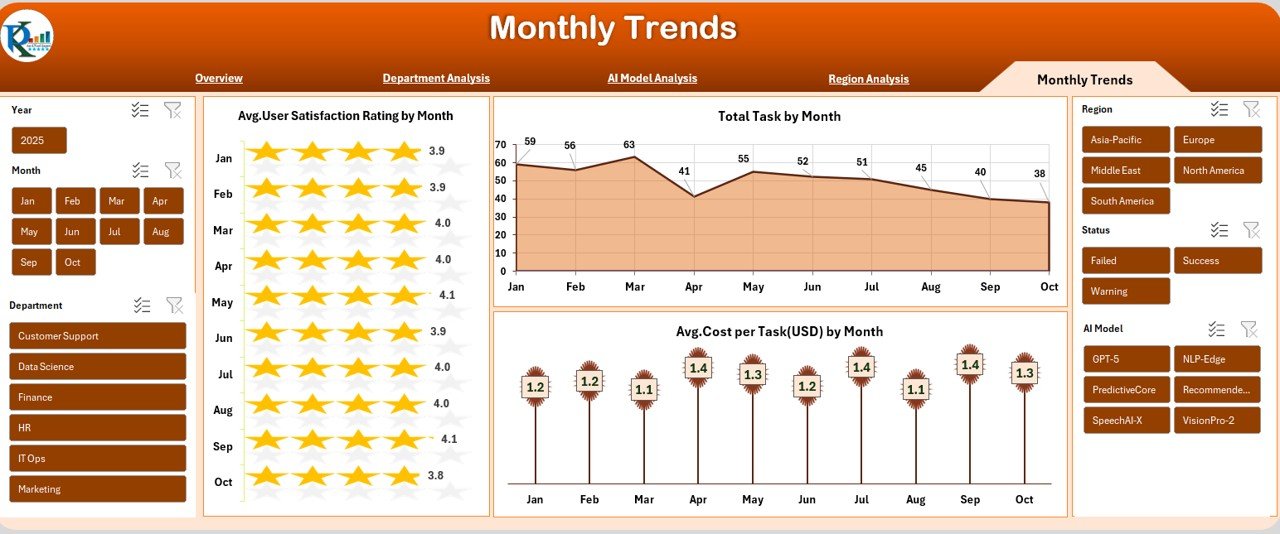
🔹 Monthly Trends Page
View month-wise changes in satisfaction, tasks processed, and cost per task. Spot trends, predict issues, and measure long-term performance improvements.
With these powerful pages, teams can make faster, smarter, and more data-driven decisions.
✨ What’s Inside the Artificial Intelligence (AI) Dashboard in Excel
Here’s what you get inside the product:
-
📊 5 fully designed analytical pages (Overview, Department, Model, Region, Monthly Trends)
-
🔄 Auto-updating visuals connected to Excel sheets
-
🧮 Structured data tables ready for monthly or weekly updates
-
🎨 Professional dashboard theme with clean layout
-
📌 Interactive slicers for real-time filtering
-
📈 Charts, cards, KPIs, and summaries for clear insights
-
🗂 Editable data sheet for complete customization
-
⚡ No formulas required—everything updates instantly
You receive a dashboard that’s not only powerful but incredibly easy to use.
✨ How to Use the Artificial Intelligence (AI) Dashboard in Excel
Using this dashboard is extremely simple:
-
Enter or paste your AI data into the provided data sheet
-
Refresh the workbook to update all visuals
-
Use slicers to filter by month, department, region, or model
-
Compare performance across KPIs using interactive charts
-
Review monthly trends to understand performance patterns
-
Share insights with your team by exporting charts or reports
-
Customize as needed (change colors, add metrics, extend sheets)
Within minutes, you’ll have a professional reporting system synchronized with your data.
✨ Who Can Benefit from This AI Dashboard
This dashboard is ideal for:
-
🧑💻 AI Engineers – Monitor model performance and improvement
-
📊 Data Analysts – Track KPIs without building manual reports
-
🏢 Operations Teams – Evaluate efficiency and workflow performance
-
👨🏫 Team Leaders & Managers – Improve decision-making with accurate insights
-
💼 Consultants – Present professional AI performance reports
-
🧠 Innovation & R&D Teams – Understand behavior across models and regions
If your team uses AI in any capacity, this dashboard becomes an essential control center.
### Click here to read the Detailed blog post
Watch the step-by-step video tutorial:


Reviews
There are no reviews yet.