Managing Real Estate Investment Trusts (REITs) becomes challenging when data spreads across spreadsheets, emails, and disconnected reports. REIT managers deal with fluctuating rental income, market value changes, occupancy variations, high-risk locations, property type performance, and multiple regional regulations. Without a centralized system, it becomes difficult to monitor performance, identify risks, or forecast results effectively.
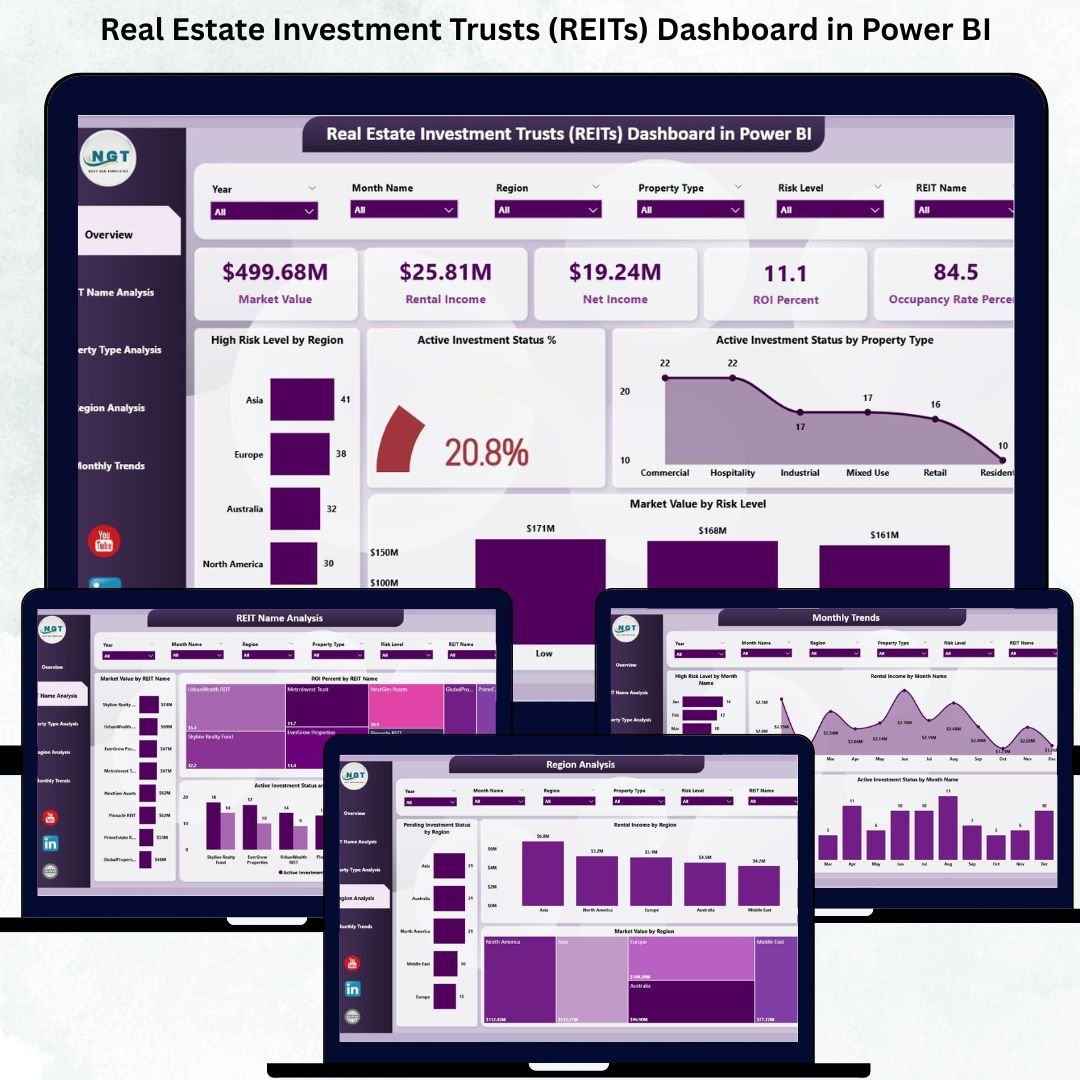
Real Estate Investment Trusts (REITs) Dashboard in Power BI To solve these challenges, we created the Real Estate Investment Trusts (REITs) Dashboard in Power BI — a fully automated, interactive, and easy-to-use dashboard that tracks all REIT performance indicators on one powerful system. Real Estate Investment Trusts (REITs) Dashboard in Power BI It turns raw real estate and financial numbers into rich visual insights using KPI cards, slicers, trend charts, and comparison views.
Real Estate Investment Trusts (REITs) Dashboard in Power BI This dashboard is designed for investors, fund managers, analysts, asset management firms, and real estate consultants who want real-time visibility across REITs, property types, regions, and monthly patterns. Real Estate Investment Trusts (REITs) Dashboard in Power BI With a single refresh, the entire dashboard updates instantly, giving you complete clarity and confidence in your investment decisions.
⭐ Key Features of the REITs Dashboard in Power BI
✨ Clean & Interactive Visual Insights
View real-time financial, operational, and risk-based KPIs using easy-to-read visuals and slicers.
📊 Smart KPI Cards
Instantly track:
-
Market Value
-
Rental Income
-
Net Income
-
ROI %
-
Occupancy Rate (%)
These high-level KPIs offer a quick snapshot of REIT performance at a glance.
📁 Five Analytical Pages
The dashboard includes five well-structured pages:
1️⃣ Overview Page – Full portfolio summary
2️⃣ REIT Name Analysis – Compare individual REIT performance
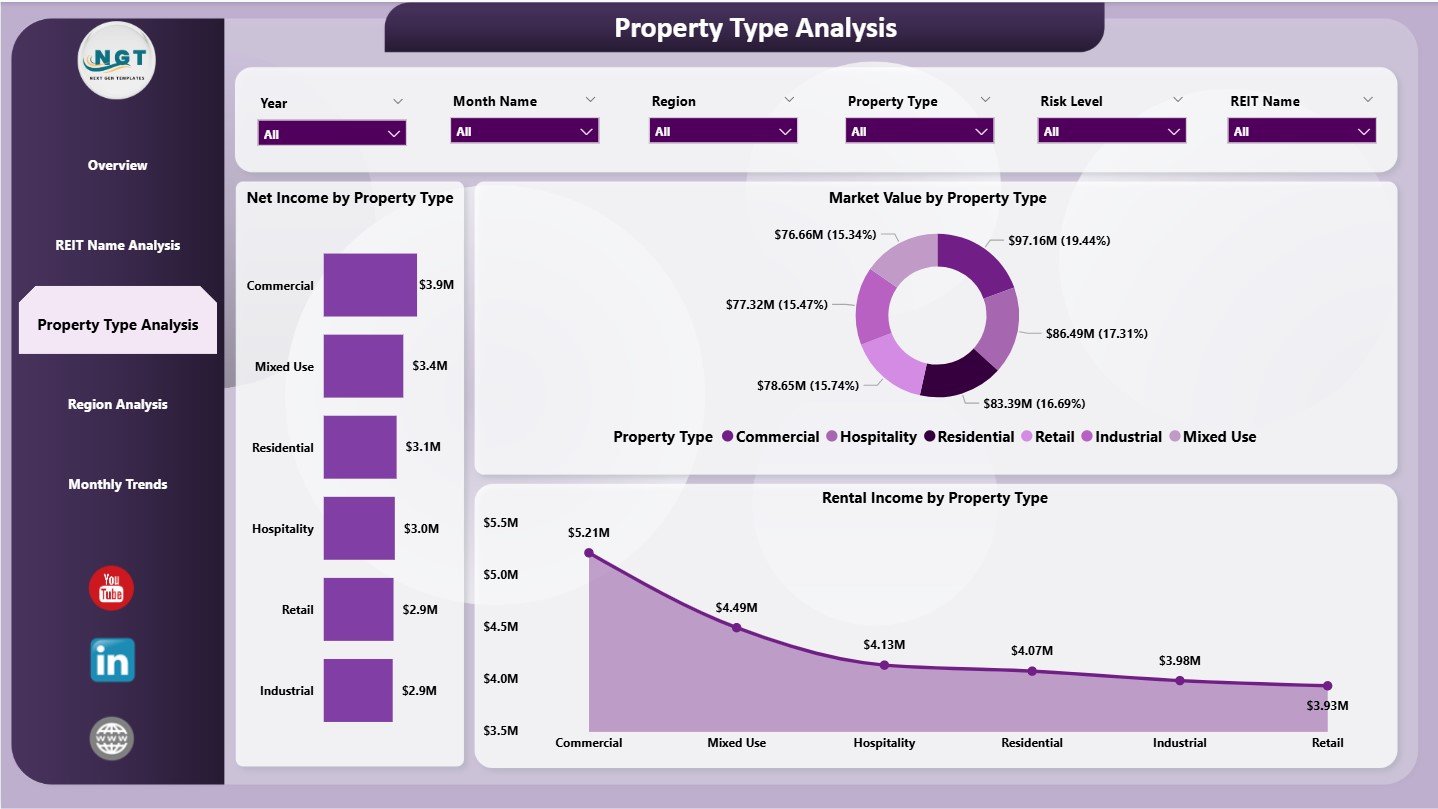
3️⃣ Property Type Analysis – Understand category-wise profitability
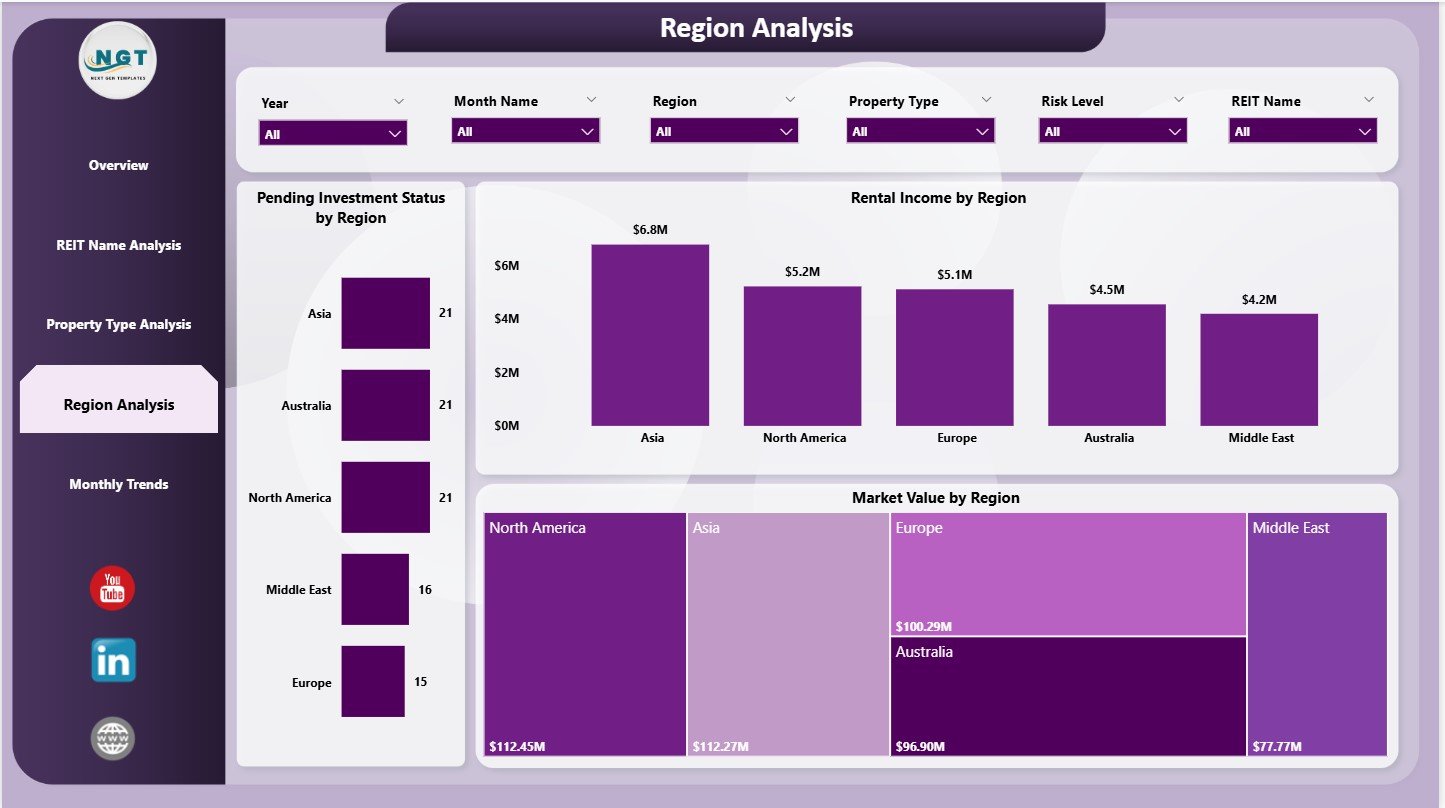
4️⃣ Region Analysis – Track regional growth and risk
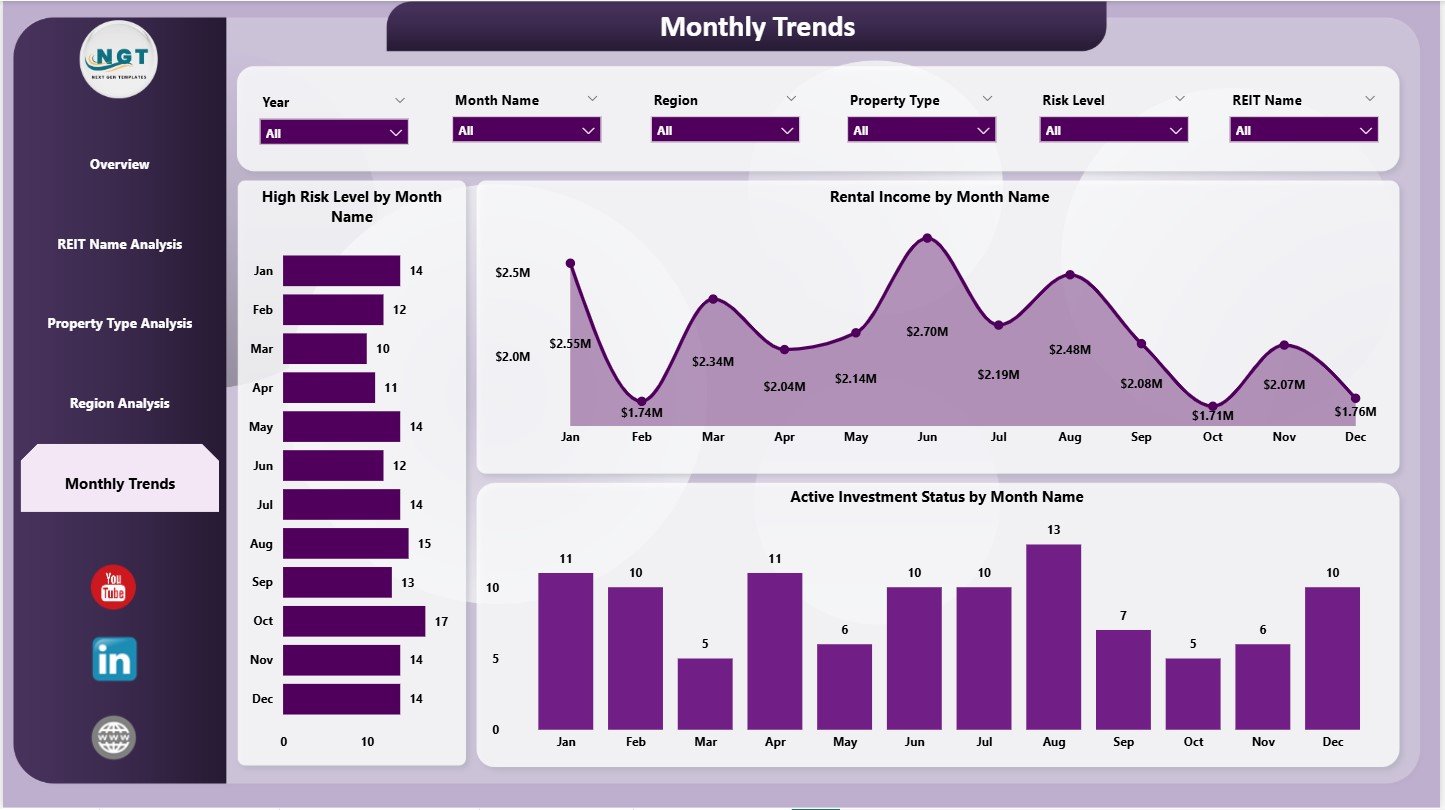
5️⃣ Monthly Trends – Identify month-by-month patterns
🧭 Advanced Slicers for Instant Filtering
Filter data by region, REIT name, property type, investment status, and risk level with one click.
📈 Trend & Comparison Charts
Study how income, occupancy, investment activity, and risks change over time for smarter forecasting.
⭐ What’s Inside the REITs Dashboard?
🏢 1. Overview Page – Your Complete Portfolio Snapshot
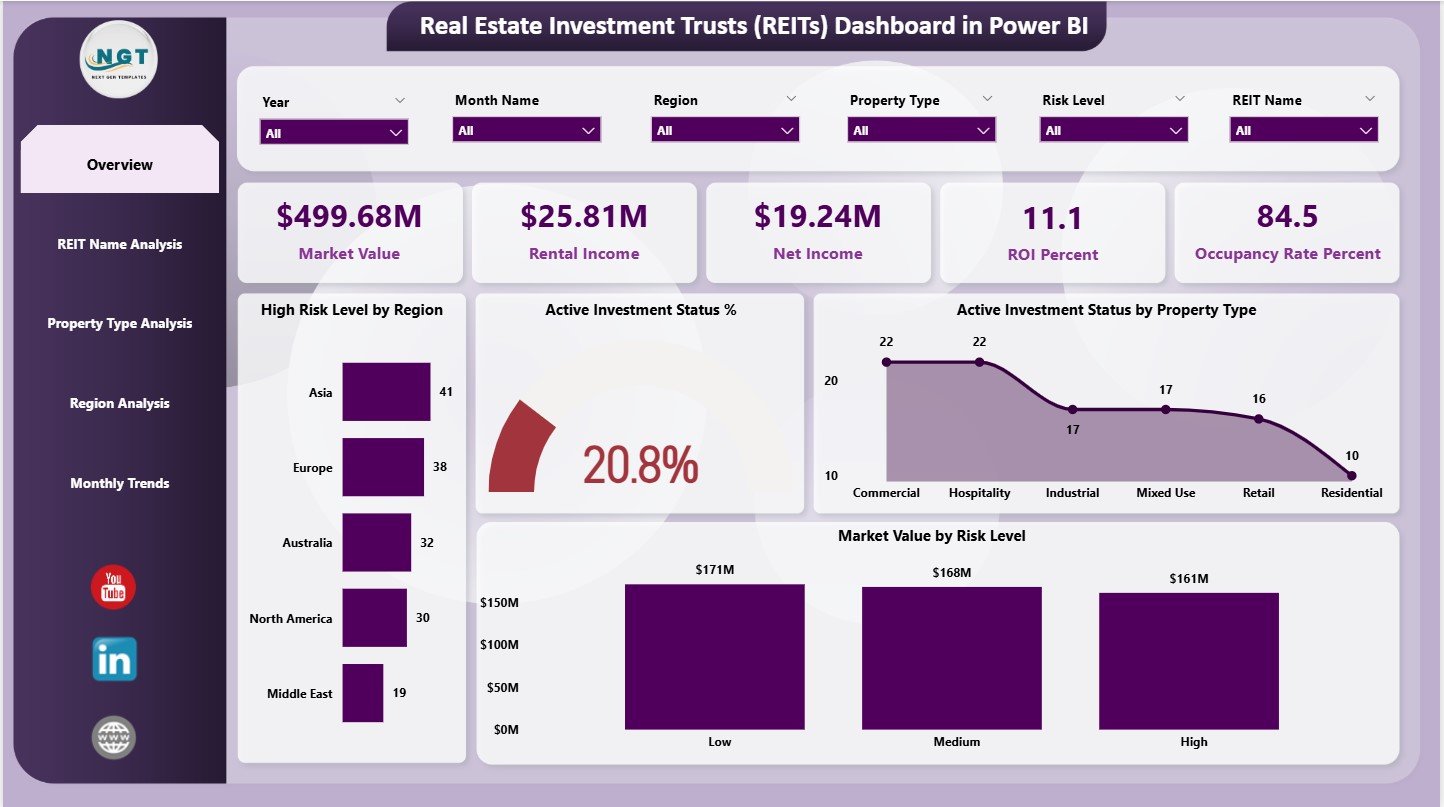
This page acts as the control center of the dashboard.
It displays high-level KPI cards and visual insights like:
-
High-risk regions
-
Active investment percentages
-
Market value by risk level
-
Property type activity
Users can filter instantly using the right-side slicers.
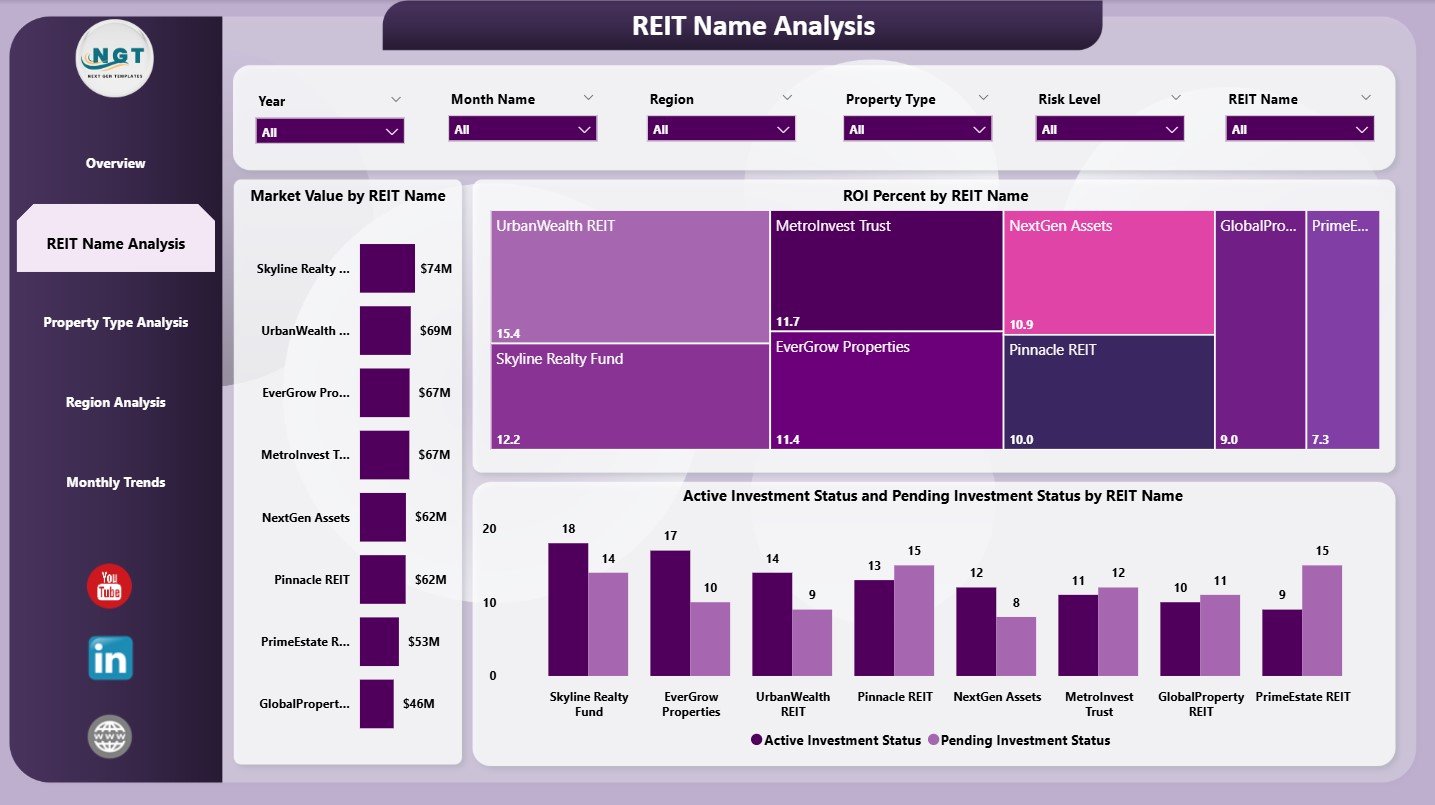
🏦 2. REIT Name Analysis Page – Evaluate Individual REITs
This page compares:
-
Market value by REIT
-
ROI % performance
-
Active vs. Pending investments
Perfect for identifying top-performing REITs and underperforming ones.
🏬 3. Property Type Analysis Page – Understand Category Behavior
Analyze performance across property categories like:
➡ Offices
➡ Retail
➡ Warehouses
➡ Residential
➡ Hospitality
➡ Data Centers
View net income, rental income, and market value by property type.
🌍 4. Region Analysis Page – Track Geographic Performance
Evaluate performance across regions using visuals that show:
-
Rental income by region
-
Market value by region
-
Pending investments
-
Regional risk exposure
A must-have for diversification and risk planning.
📅 5. Monthly Trends Page – Time-Based Insights
Track how KPIs behave month after month:
-
High-risk levels
-
Rental income
-
Active investment status
Understand seasonal patterns and forecast future performance easily.
⭐ How to Use the REITs Dashboard
Using the dashboard is simple:
1️⃣ Update your Excel data source
2️⃣ Refresh Power BI
3️⃣ Use slicers to filter data
4️⃣ Explore insights across all 5 pages
5️⃣ Compare REITs, regions, and property types
6️⃣ Review monthly trends for forecasting
7️⃣ Share insights with your investment team
No advanced Power BI skills required.
⭐ Who Can Benefit from This Dashboard?
🏢 REIT Managers – Monitor financial performance
💼 Fund Managers – Compare portfolios in seconds
📊 Real Estate Analysts – Study property trends & risks
🏦 Investment Teams – Make data-driven decisions
📉 Asset Managers – Track rental income & occupancy
📈 Real Estate Consultants – Present insights professionally
This dashboard is built for both small and large investment teams.


Reviews
There are no reviews yet.