Training plays a crucial role in strengthening any organization. When employees learn new skills, teams work better, productivity increases, and overall performance improves 📈👩🏫. But tracking training sessions, feedback scores, trainer performance, costs, and completion rates becomes difficult when everything is scattered across multiple Excel files. This leads to confusion, errors, delays, and poor training decisions.
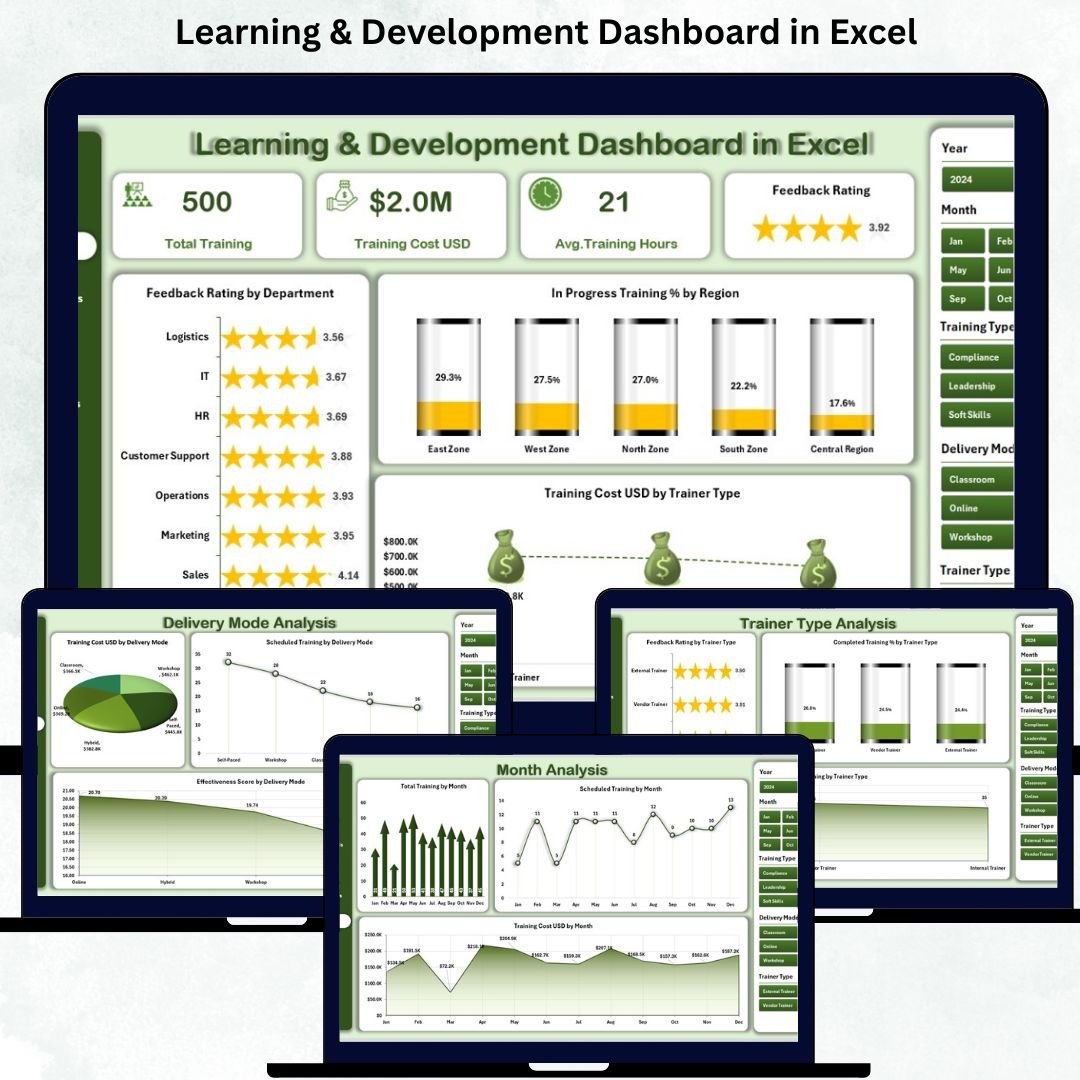
The Learning & Development Dashboard in Excel solves this problem by bringing all training activity into one clean, interactive, and easy-to-understand dashboard. HR teams, L&D managers, trainers, and leadership can instantly monitor training metrics, compare performance, and make better decisions with confidence. With simple navigation, smart visuals, and auto-updating charts, this dashboard helps organizations build a stronger and more capable workforce.
This ready-to-use Excel dashboard requires no coding and no complex formulas. Just update the data sheet, refresh the visuals, and your complete L&D performance is ready for review.
🔥 Key Features of the Learning & Development Dashboard in Excel
-
📊 Overview Page – Track total trainings, feedback scores, in-progress %, completion %, and total training cost.
-
🎯 Training Type Analysis – Compare technical, soft skills, leadership, compliance, and business training.
-
🖥️ Delivery Mode Analysis – Analyze classroom, online, self-paced, and hybrid learning performance.
-
👩🏫 Trainer Type Analysis – Evaluate internal trainers, external trainers, guest trainers, and training companies.
-
📅 Month-Wise Analysis – Understand seasonal trends in training events, schedules, and training costs.
-
📥 Data Sheet Included – All training data stays organized in one structured sheet.
-
⚡ Auto-Refreshing Visuals – Update the data and the dashboard adjusts instantly.
-
💡 Easy Navigation – Left-side page navigator for smooth page switching.
📂 What’s Inside the Learning & Development Dashboard
1. Overview Page – Complete Training Summary
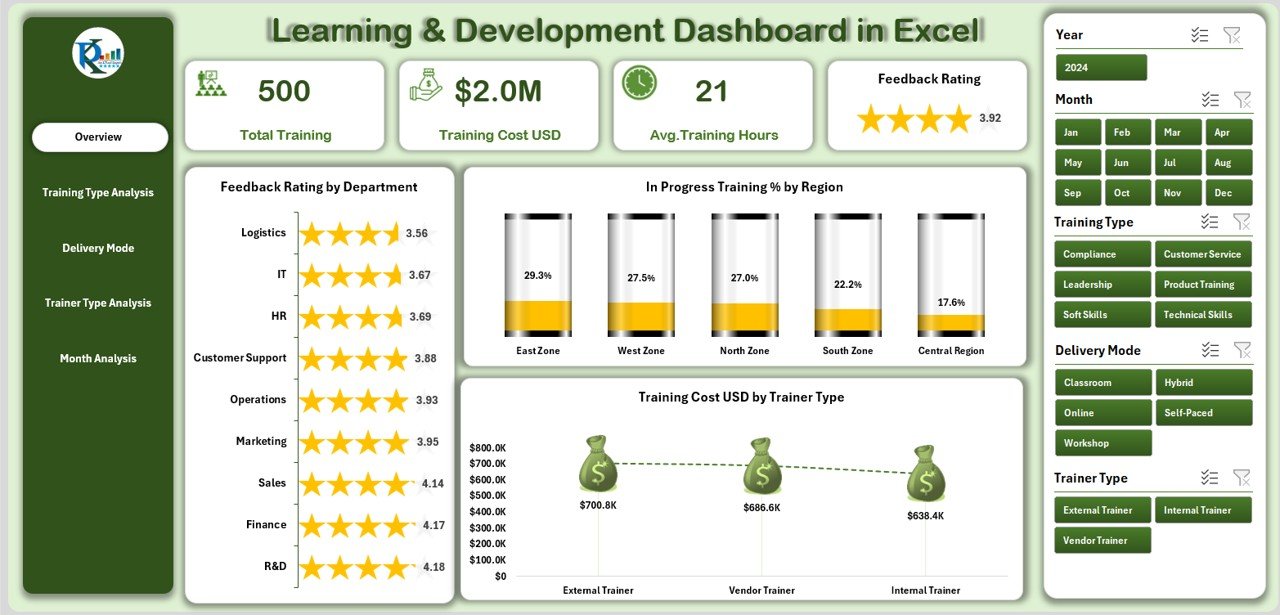
This page shows the overall health of your training activities with:
-
✔️ 5 KPI cards (Total Trainings, Feedback Score, Training Cost, Completed %, In-Progress %).
-
✔️ Charts for department-wise ratings, region-wise progress, and trainer-wise cost insights.
This gives an instant view of organizational learning performance.
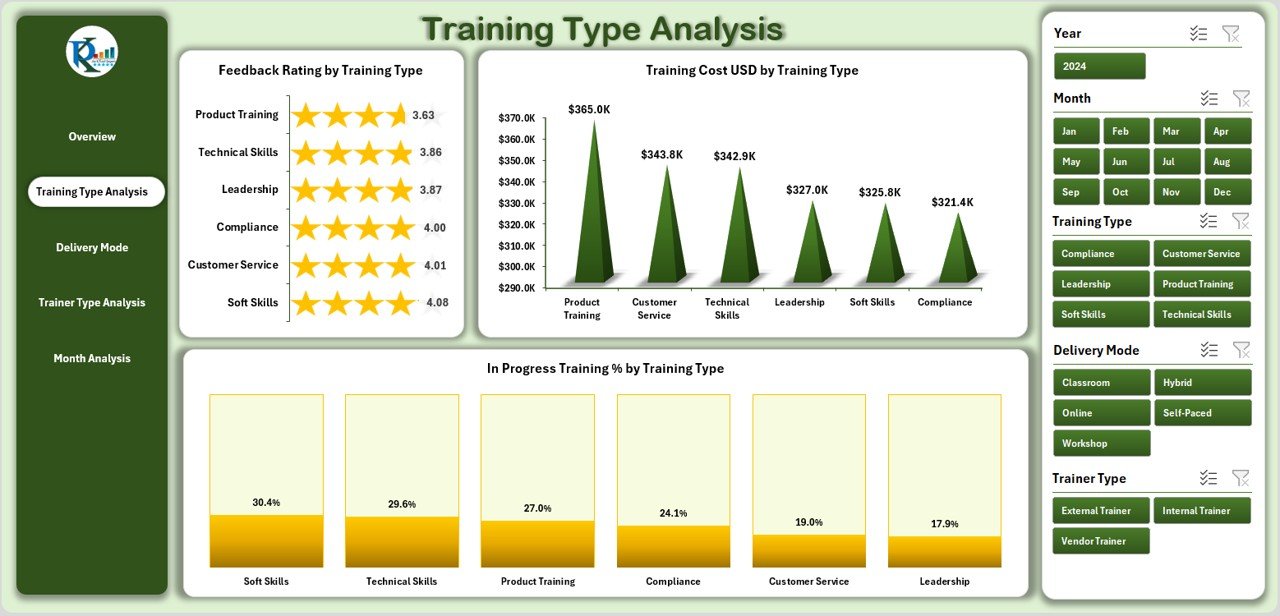
2. Training Type Analysis – Understand Training Effectiveness
This page breaks down performance across different training types such as technical, soft skills, business, compliance, and leadership.
It includes:
-
Feedback Rating by Training Type
-
Training Cost by Training Type
-
In-Progress Training % by Training Type
Perfect for deciding which training formats deliver the best results.
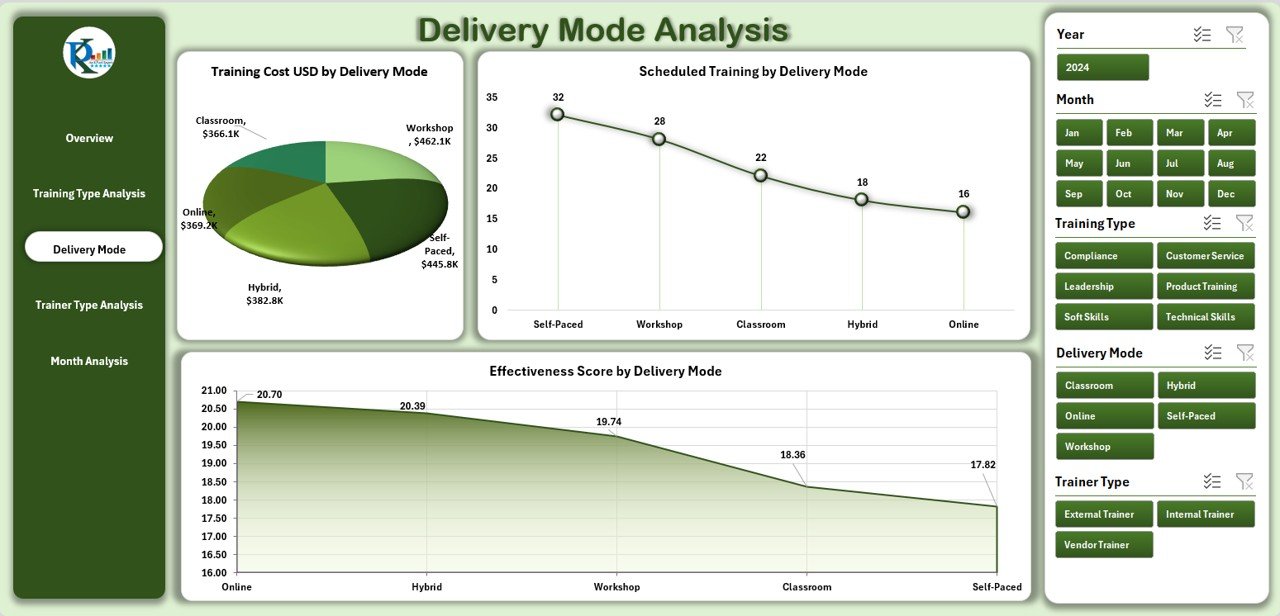
3. Delivery Mode Analysis – Compare Learning Formats
Training formats influence cost, engagement, and effectiveness. This page compares:
-
Training Hours by Delivery Mode
-
Feedback Score by Delivery Mode
-
Cost by Delivery Mode
You can easily spot which delivery mode performs best.
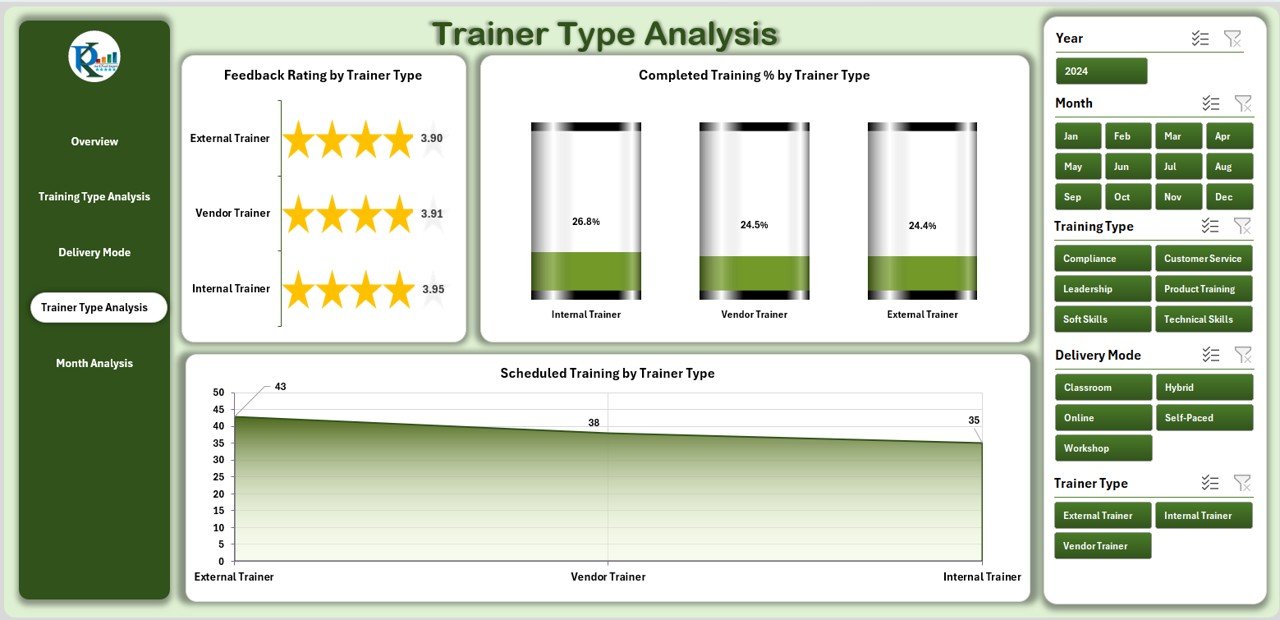
4. Trainer Type Analysis – Evaluate Trainer Performance
Organizations must track trainer quality to deliver effective learning. This page includes:
-
Feedback Score by Trainer Type
-
Scheduled Training by Trainer Type
-
Completed Training % by Trainer Type
You get a clear picture of trainer efficiency and value.
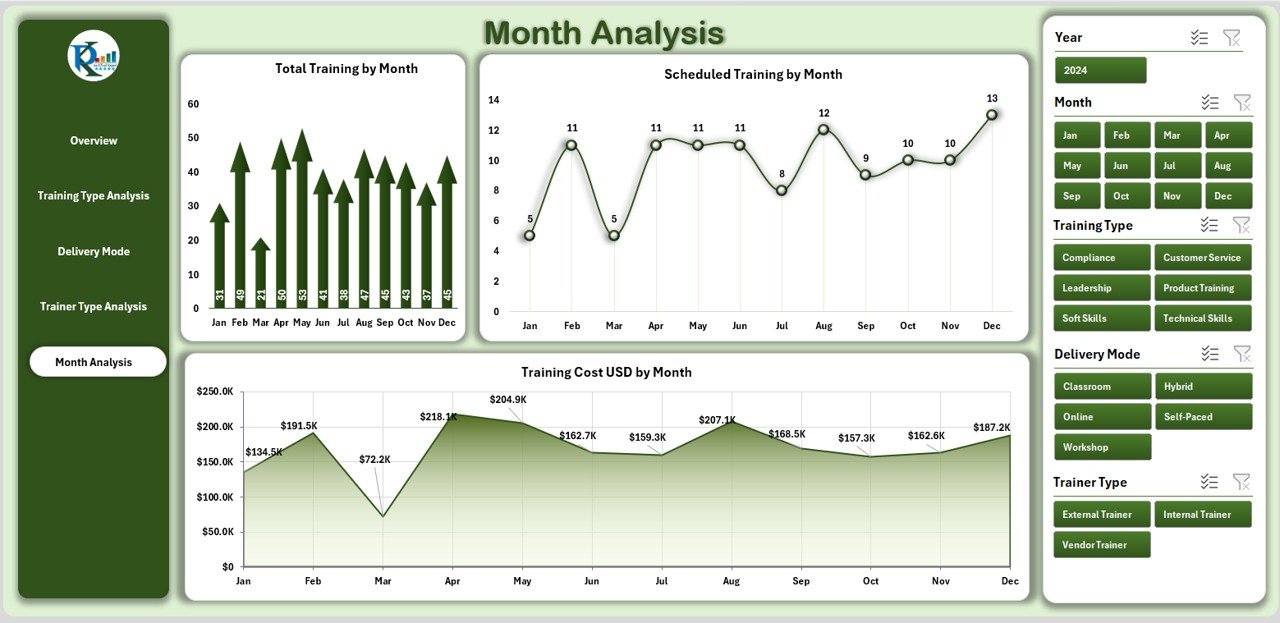
5. Month-Wise Training Analysis – Track Seasonal Trends
Training activities vary every month. This page helps you analyze:
-
Total Trainings by Month
-
Scheduled Trainings by Month
-
Training Cost by Month
Organizations use this to plan yearly training calendars and allocate budgets.
🌟 Why You Should Use the L&D Dashboard
-
✔️ Clear Visibility – Track all training activities in one place.
-
✔️ Better Decision-Making – View performance trends & cost insights instantly.
-
✔️ Improved Learning Quality – Identify weak areas through feedback analysis.
-
✔️ Saves Time – No need to collect scattered reports manually.
-
✔️ Cost Optimization – Track spending across trainers, months, and training types.
-
✔️ Supports Every Learning Format – Works for corporate, IT, retail, education, healthcare & more.
🎯 Who Should Use This Dashboard?
-
HR teams
-
L&D managers
-
Trainers & training companies
-
Team leaders
-
Project managers
-
Organizational leadership
-
Universities & training institutes
This dashboard is ideal for anyone responsible for learning strategy and employee development.
### Click here to read the Detailed blog post
Visit our YouTube channel to learn step-by-step video tutorials


Reviews
There are no reviews yet.