
Drone delivery is transforming the logistics industry with faster, safer, and more efficient delivery capabilities. Drone Delivery Services Dashboard in Excel But managing drone operations is not easy—costs fluctuate, weather impacts performance, cancellations rise unexpectedly, and city-wise trends keep changing. Manually tracking these details becomes time-consuming and error prone.
That’s why we created the Drone Delivery Services Dashboard in Excel — a ready-to-use, powerful, and interactive performance tracking system that brings all your delivery insights into one place. Drone Delivery Services Dashboard in Excel Whether you run a drone logistics company, manage a delivery fleet, or work in last-mile operations, this dashboard gives you complete visibility into revenue, profit, customer satisfaction, cancellations, weather impact, and monthly trends.
It’s easy to use, professionally designed, and built to help you make faster, smarter business decisions.
✨ Key Features of the Drone Delivery Services Dashboard in Excel
📊 1. Five Insightful Analytical Pages
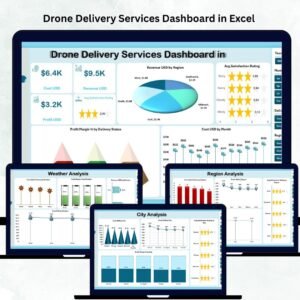
The dashboard includes Overview, City Analysis, Region Analysis, Weather Analysis, and Monthly Trends, each offering unique insights into your business.
🎯 2. Interactive Slicers for Deep Filtering
Filter data instantly by Month, Region, City, Delivery Status, and Category to explore customized insights.
💰 3. Complete Financial Visibility
Track revenue, costs, profit, and margin percentages across cities, regions, and weather types.
😊 4. Customer Satisfaction Insights
Understand satisfaction ratings by city, region, month, and more—identify service gaps quickly.
🌦 5. Weather-Based Delivery Intelligence
Monitor cancellations and profit drops caused by bad weather and plan routes proactively.
🔄 6. Auto-Updating Dashboard
When you update the Data Sheet, all visuals refresh automatically — no technical skills required.
📦 What’s Inside the Drone Delivery Services Dashboard in Excel
🏠 1. Overview Page
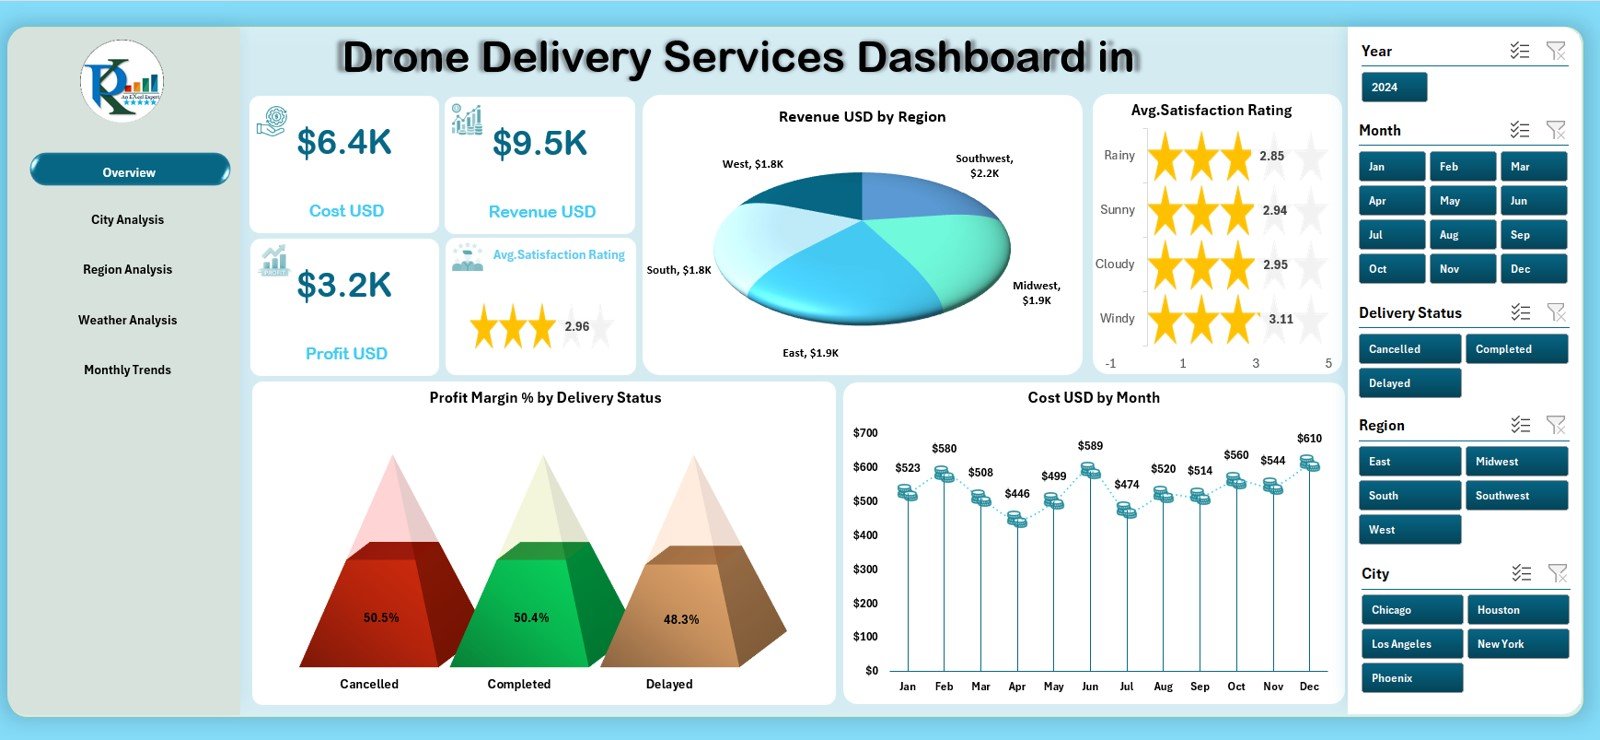
View the most important KPIs in one place — Total Revenue, Satisfaction Rating, Profit Margin %, and Delivery Status Performance.
Four dynamic charts display revenue by region, satisfaction score, monthly cost, and profit margin distribution.
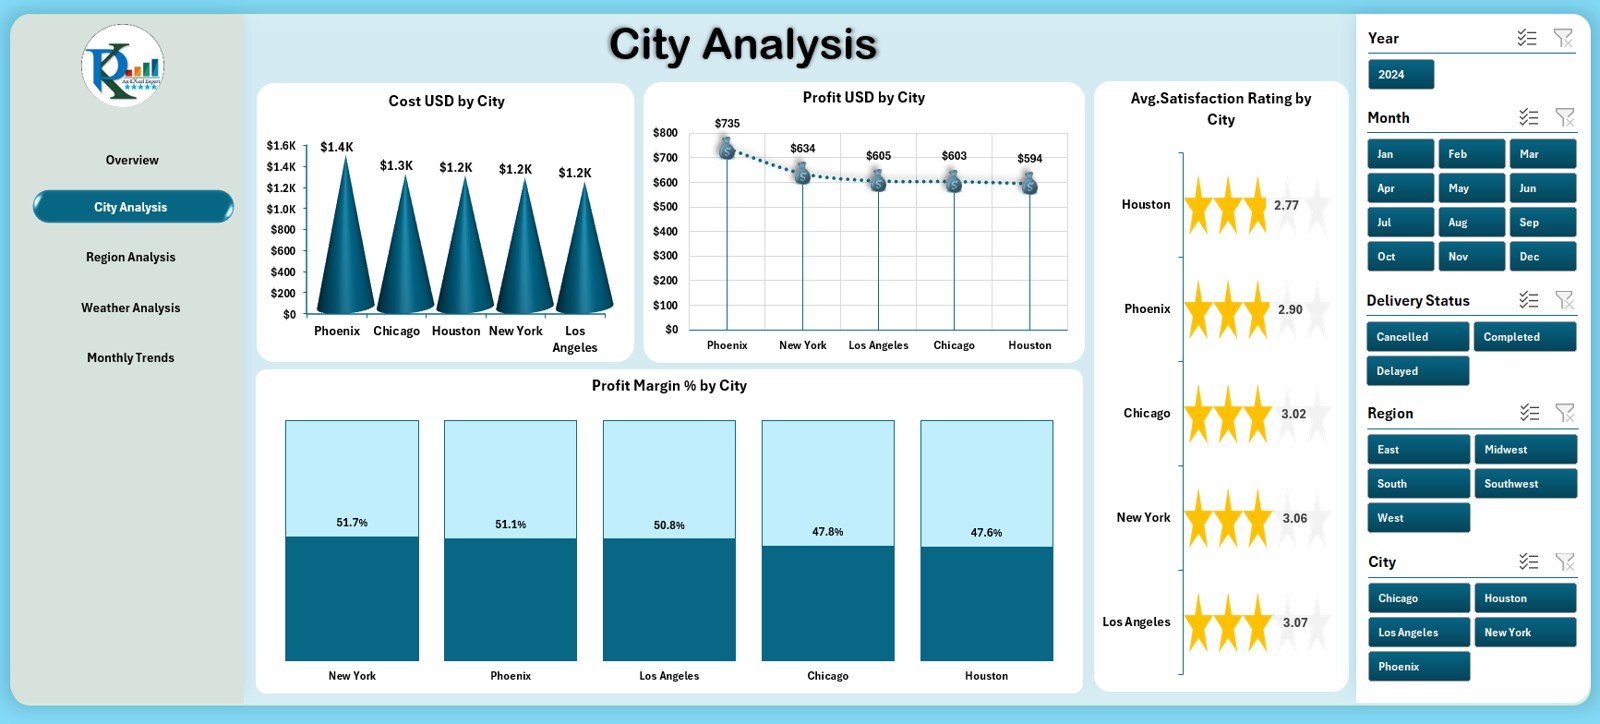
🏙️ 2. City Analysis Page
Analyze city-wise performance using charts for Cost, Profit, Satisfaction Rating, and Profit Margin %.
Perfect for companies with operations in multiple cities.
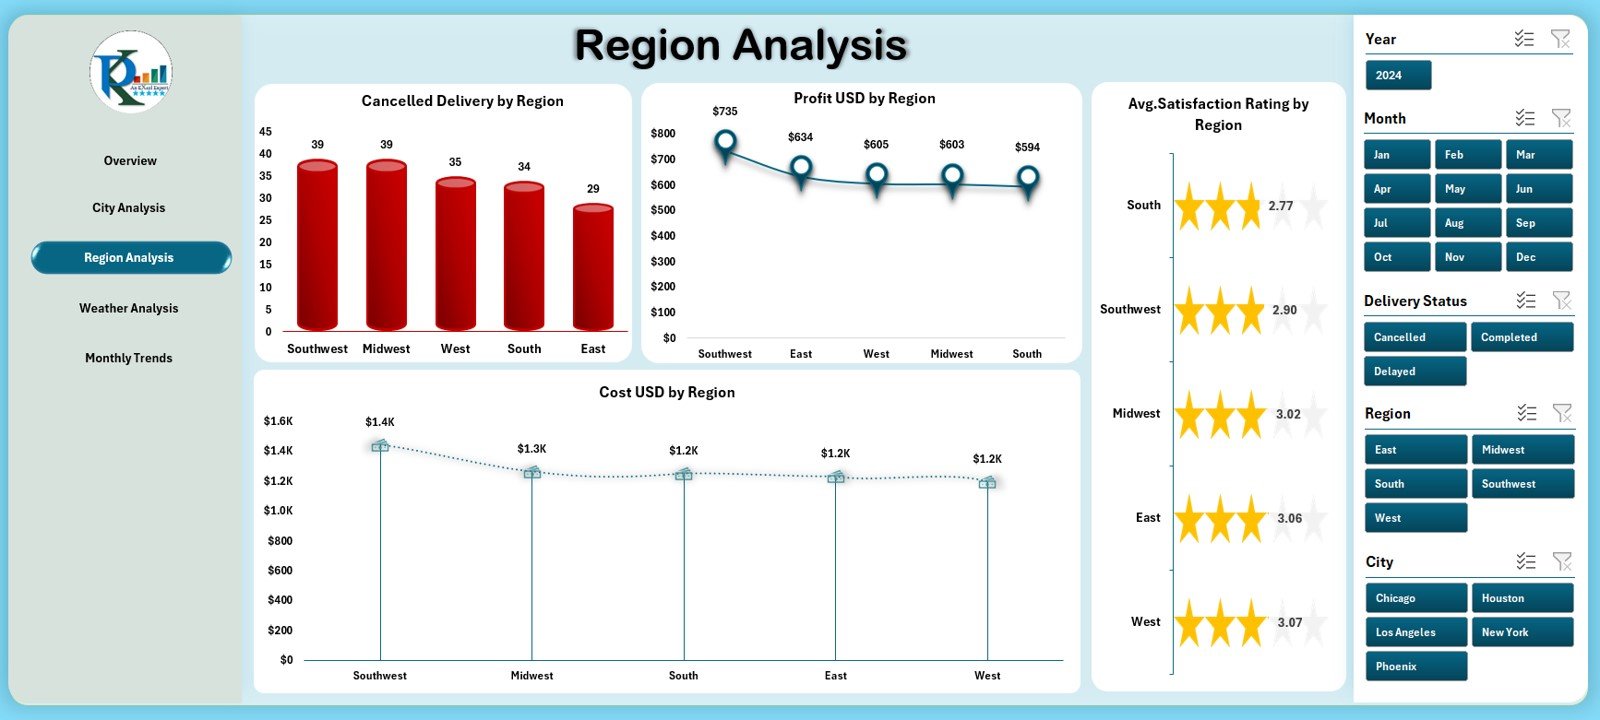
🌍 3. Region Analysis Page
Discover regional behavior with insights into cancellations, cost variations, profit performance, and customer satisfaction across regions.
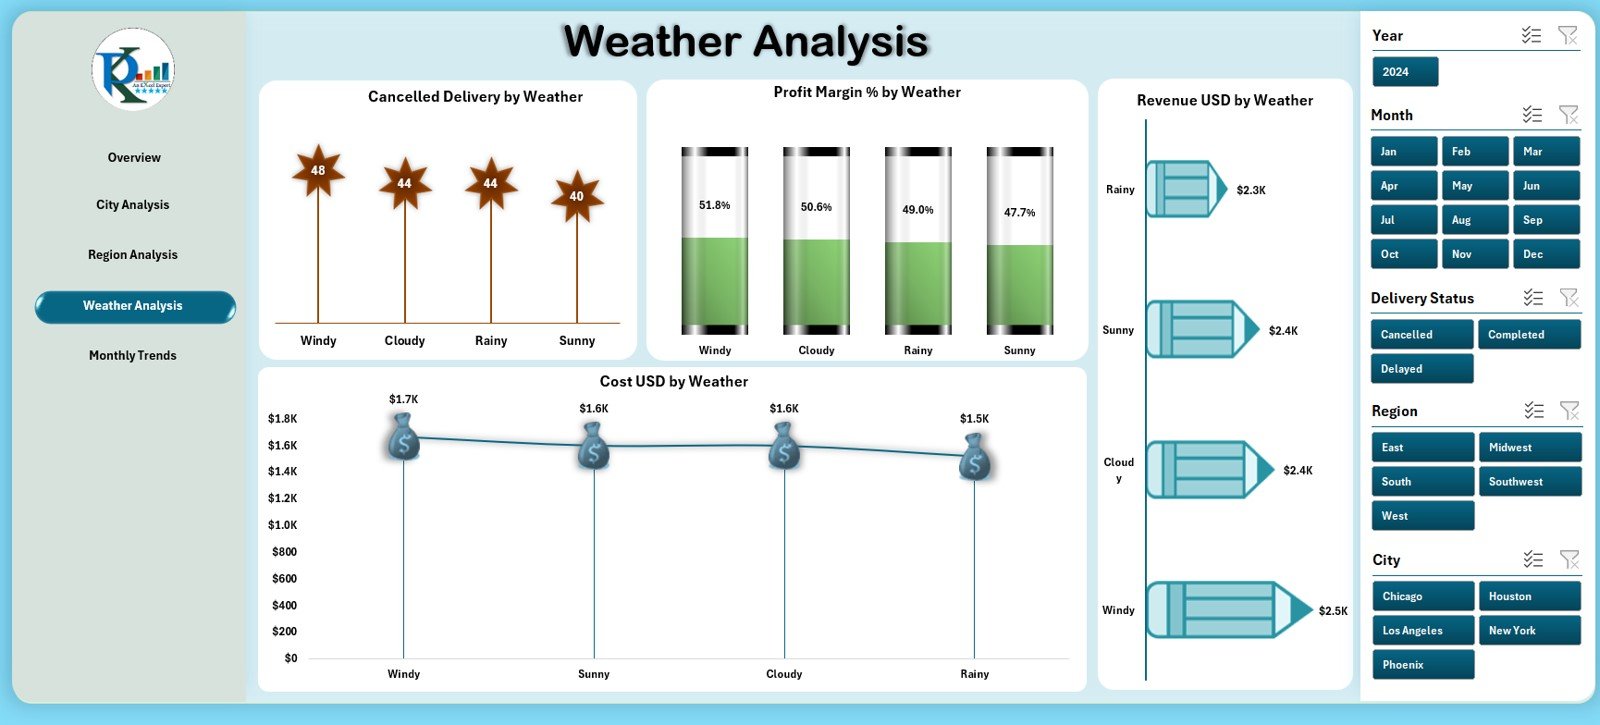
🌦 4. Weather Analysis Page
Drone deliveries depend heavily on weather conditions.
This page shows cancellation patterns, revenue drops, cost spikes, and margin changes under different weather types.
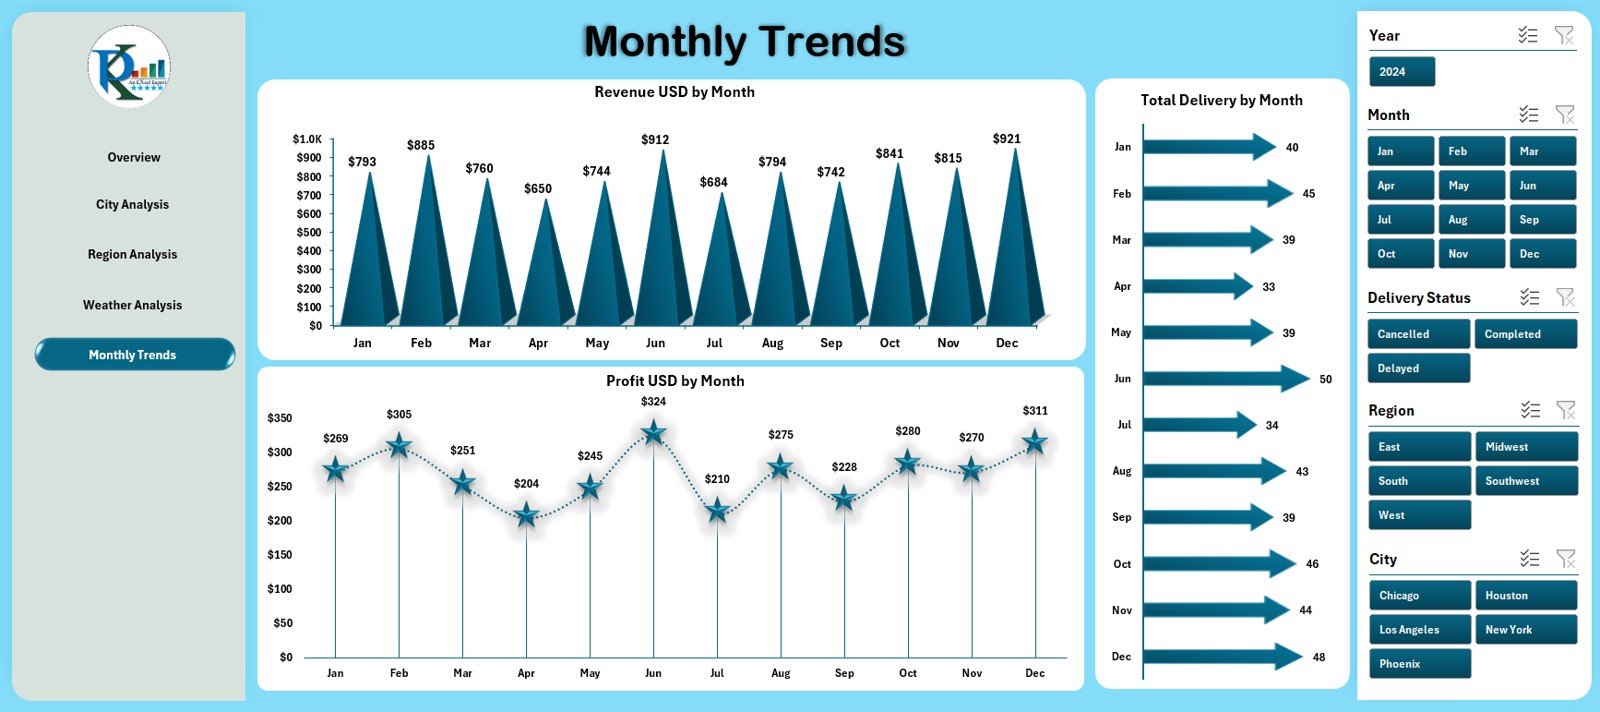
📅 5. Monthly Trends Page
Understand monthly patterns with charts for Revenue, Profit, and Total Deliveries — ideal for forecasting and seasonal planning.
📁 Support & Data Sheets
The Support Sheet organizes dropdown lists for slicers, while the Data Sheet serves as the engine of the dashboard where you enter deliveries, revenue, cost, profit, weather, region, city, satisfaction rating, and delivery status.
🧭 How to Use the Drone Delivery Services Dashboard in Excel
🪄 Step 1: Enter or Paste Your Data
Fill the Data Sheet with your delivery data — the dashboard updates instantly.
🔄 Step 2: Refresh and Explore
Use slicers to analyze city, region, weather, or monthly performance.
📈 Step 3: Compare Key Metrics
Track cost, profit, cancellations, and satisfaction ratings to identify trends and efficiency gaps.
🌎 Step 4: Use Insights for Better Planning
Optimize drone routes, forecast demand, improve service quality, and reduce avoidable costs.
📤 Step 5: Share Insights with Teams
Export visuals or share the file with management, operations, or customer service teams.
🎯 Who Can Benefit from This Dashboard
🚁 Drone Logistics Companies
Track deliveries, performance, and profitability with precision.
📦 Last-Mile Delivery Startups
Optimize operations and reduce unpredictable costs.
👨💼 Operations & Fleet Managers
Monitor weather, cancellations, and regional performance to plan efficiently.
📊 Data Analysts & BI Teams
Use clean visuals to prepare accurate weekly and monthly reports.
💼 Supply Chain Managers
Identify high-performing regions and improve delivery outcomes.


Reviews
There are no reviews yet.