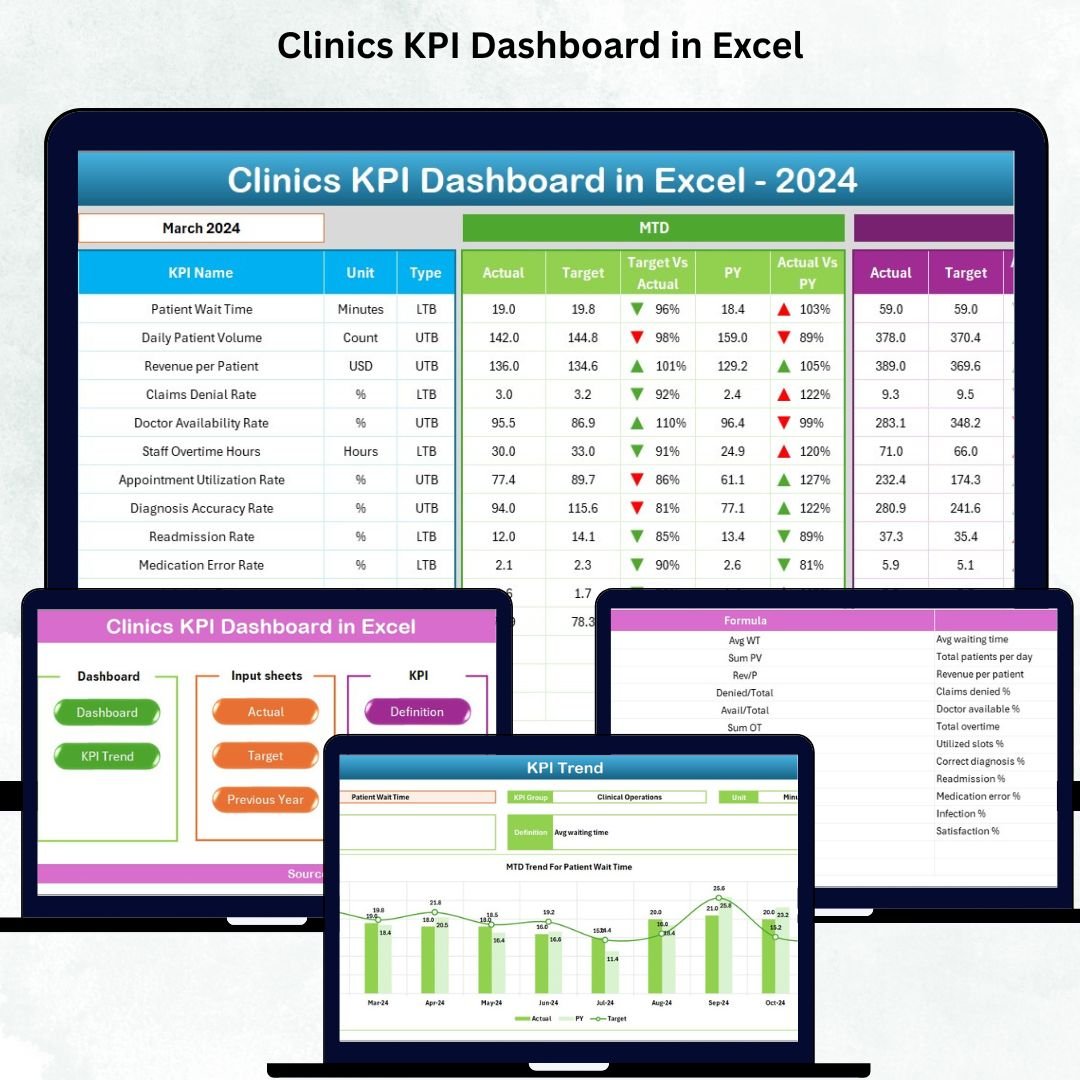
A well-managed clinic runs on accurate data, quick insights, and real-time visibility. But many clinics still work with scattered sheets, manual reports, and outdated files. This leads to delays, errors, and poor decision-making. The Clinics KPI Dashboard in Excel is the perfect solution. It transforms raw clinical data into clear, visual, and action-driven insights. Whether you want to track patient visits, staff efficiency, billing performance, or clinical quality, this dashboard gives you everything in one place—beautifully organized and easy to use.
With dynamic drop-downs, slicers, KPI cards, charts, and monthly comparisons, this dashboard makes performance tracking effortless. Every number updates automatically when you refresh the data. Clinic managers, doctors, and administrators can instantly view MTD, YTD, and Previous Year performance without opening multiple reports. It’s a complete analytics system built for fast decisions and continuous improvement.
⭐ Key Features of Clinics KPI Dashboard in Excel
The Clinics KPI Dashboard in Excel comes with powerful built-in features designed to simplify clinic operations and enhance decision-making.
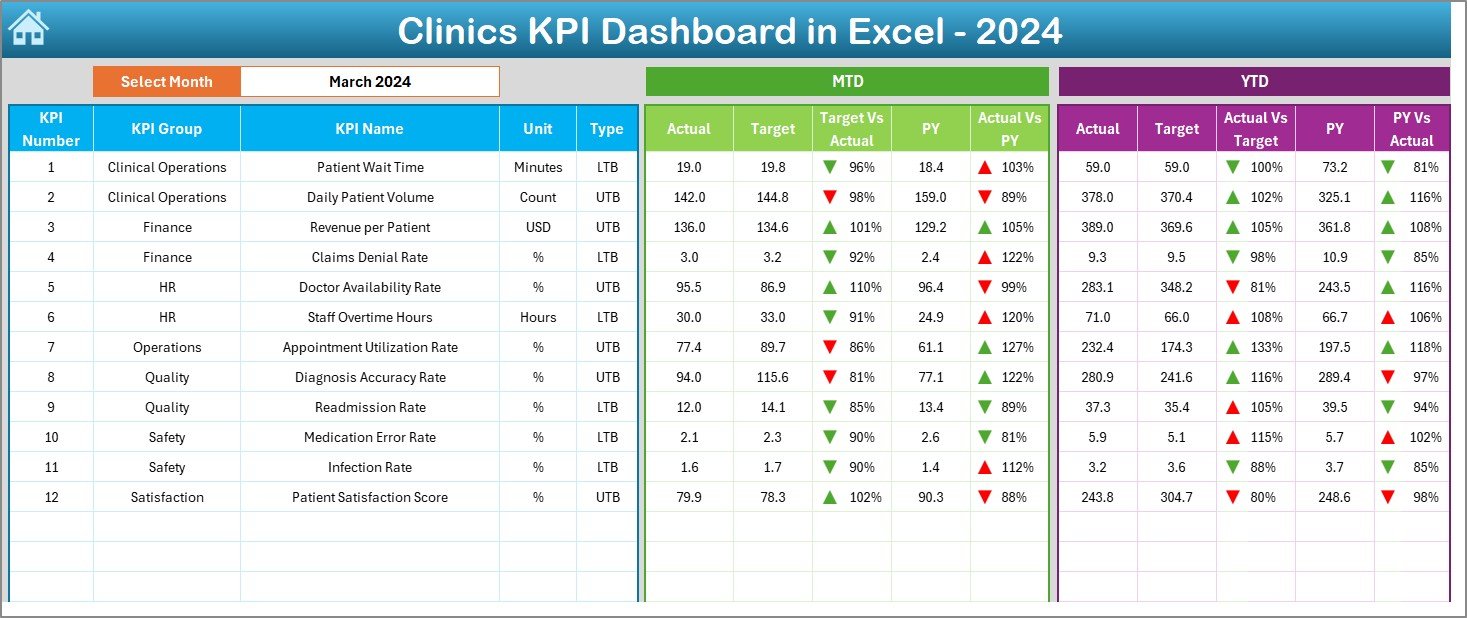
✨ Fully Automated KPI Dashboard – View MTD, YTD, and PY metrics instantly.
📊 Interactive Charts & KPI Cards – Track key metrics with real-time visuals.
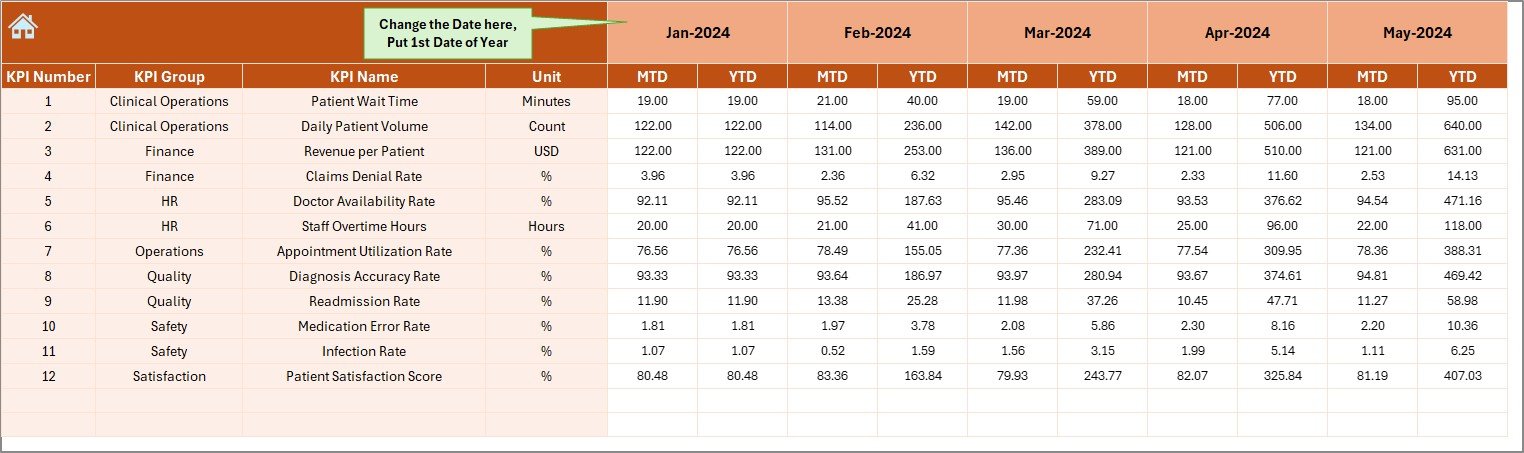
📅 Month Selector – Choose any month and watch the entire dashboard update.
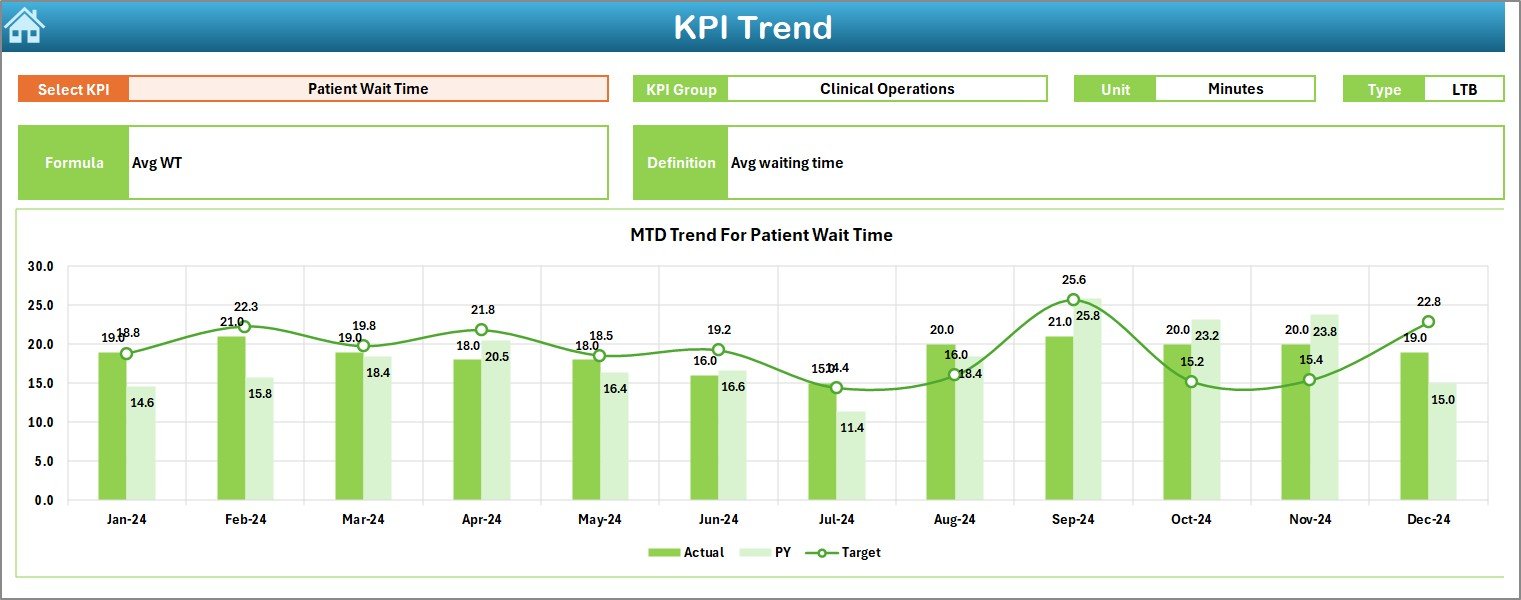
📈 Trend Analysis – Compare monthly and yearly progress with easy-to-read trend lines.
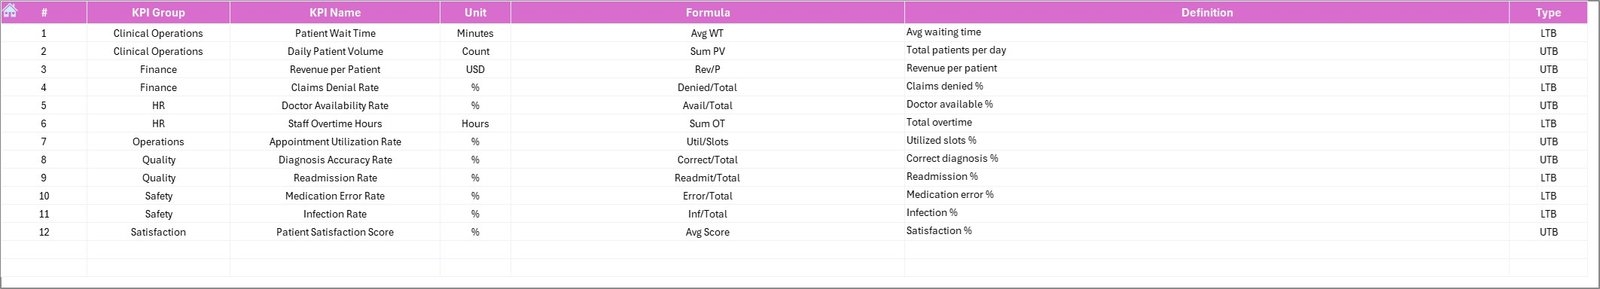
🧾 Predefined KPI Definitions – Standardized formulas ensure accuracy across teams.
🧭 Page Navigator Buttons – Jump between sheets instantly and save time.
📂 Structured Data Input Sheets – Clean, simple formats for entering actuals, targets, and PY numbers.
🔁 Yearly Comparison – Identify improvements using PY vs Actual indicators.
🎯 Target vs Actual Insights – Highlight KPIs meeting or missing targets.
💡 Clinic-Friendly Metrics – Includes Patient, Financial, Operational, and Quality KPIs.

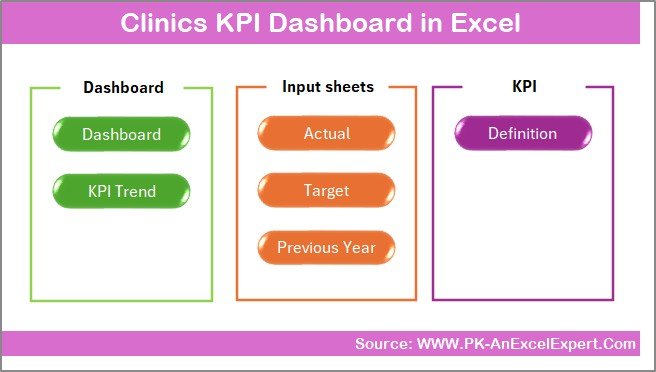
📦 What’s Inside the Clinics KPI Dashboard in Excel
This product includes a complete set of ready-to-use worksheets designed for smooth clinical performance tracking.
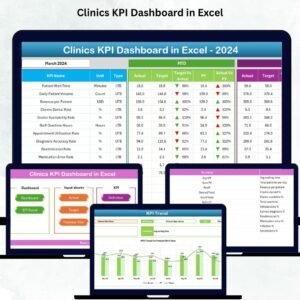
🟦 Summary Page – A simple navigation hub with quick-access buttons.
🟩 Main Dashboard Sheet – Displays all KPIs with charts, cards, and conditional formatting.
🟧 Trend Sheet – Deep-dive KPI view with monthly MTD and YTD trend charts.
🟨 Actual Numbers Input Sheet – Enter monthly actuals with ease.
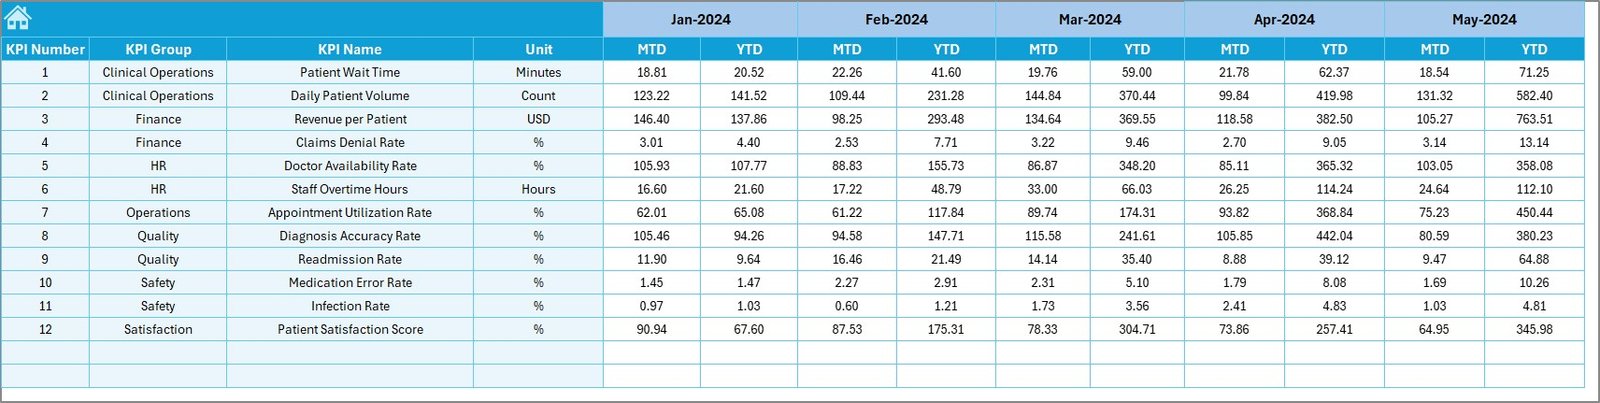
🟪 Target Sheet – Define KPI-wise MTD and YTD targets.
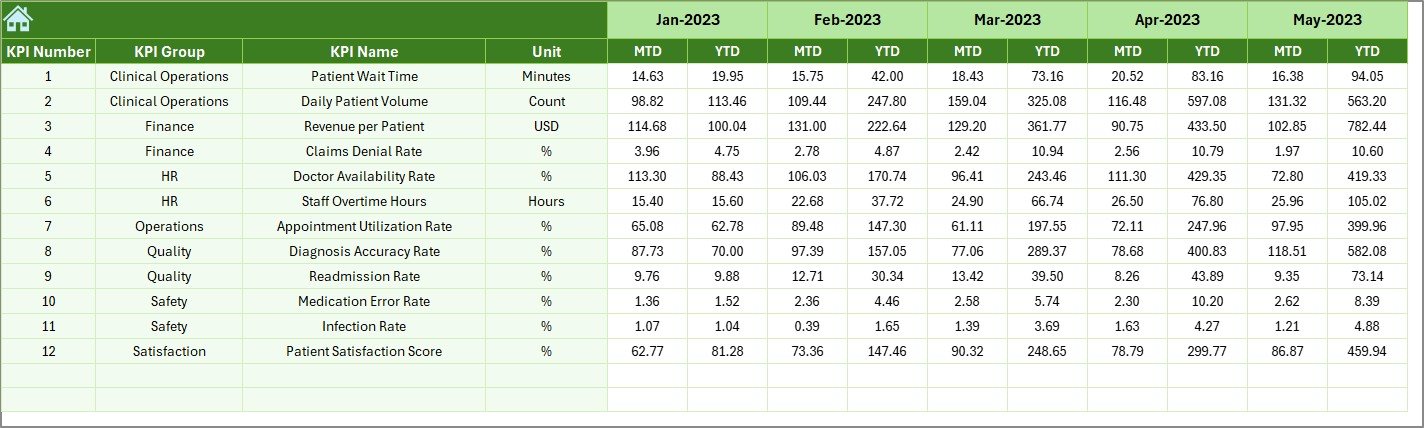
⬜ Previous Year Data Sheet – Compare performance with last year.
🔷 KPI Definition Sheet – Stores KPI names, units, formulas, and definitions.
Each sheet works together to help you track performance with precision and clarity.
🛠️ How to Use the Clinics KPI Dashboard in Excel
Using this dashboard is simple, even for beginners.
1️⃣ Enter your monthly actual data in the Actual Numbers Input sheet.
2️⃣ Set your targets for each KPI in the Target sheet.
3️⃣ Add previous year numbers for year-over-year comparisons.
4️⃣ Select a month from the dashboard’s drop-down menu to view performance.
5️⃣ Use the Trend sheet to analyze how KPI performance is moving month-to-month.
6️⃣ Navigate using the Summary Page to jump between pages in seconds.
7️⃣ Review KPI definitions to maintain clarity and standardization across your team.
With all metrics automated, you only update the data monthly — the dashboard handles the rest.
👥 Who Can Benefit from This Clinics KPI Dashboard in Excel
The dashboard is suitable for a wide range of healthcare professionals:
🏥 Clinic Managers – Monitor daily operations and overall performance.
👨⚕️ Doctors – Track treatment quality, patient flow, and service standards.
🧑💼 Administrators – Oversee billing, staffing, and compliance.
📊 Healthcare Analysts – Analyze trends and performance patterns.
🏥 Outpatient & Diagnostic Centers – Improve patient experience and operational efficiency.
💼 Hospital Branches & Small Clinics – Achieve standardization and consistent reporting.
This dashboard is designed for small clinics, diagnostic labs, polyclinics, and specialty centers looking for a reliable reporting system.
### Click here to read the Detailed blog post
Watch the step-by-step video tutorial:


Reviews
There are no reviews yet.