
Managing translation and localization performance becomes challenging when teams depend on scattered spreadsheets, manual calculations, and inconsistent reports. If you want a fast, accurate, and professional way to monitor your KPIs, the Translation & Localization KPI Dashboard in Excel is the perfect solution. This ready-to-use dashboard gives you clear visibility into quality, productivity, timeliness, and customer satisfaction—all inside one powerful Excel file.
Whether you’re a translation agency, localization team, linguist, or project manager, this dashboard helps you track performance instantly and make smarter, data-driven decisions. With its automated calculations, drop-down filters, clean layout, and interactive analytics, you can monitor monthly (MTD), yearly (YTD), and previous-year comparisons with ease. Every chart and table updates automatically, saving you hours of manual work every month.
⭐ Key Features of the Translation & Localization KPI Dashboard in Excel
✨ Smart Page Navigation – Jump between worksheets instantly using a clean Summary Page with built-in buttons.
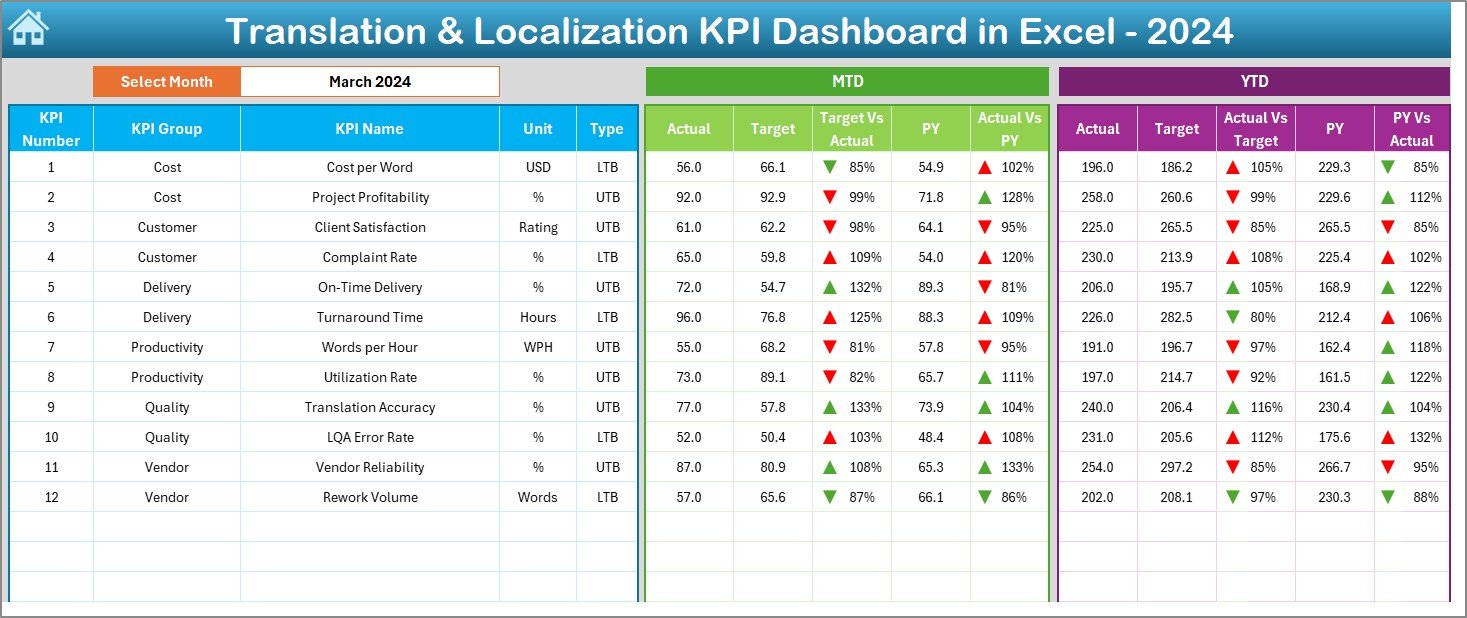
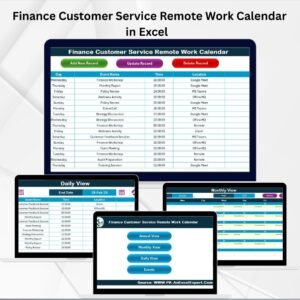
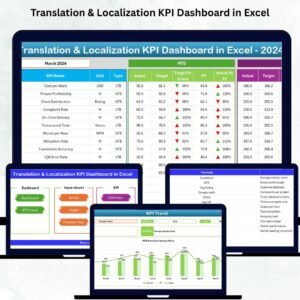
📊 Interactive Dashboard Page – Select a month from a dropdown and watch all KPIs update automatically.
📈 MTD & YTD Analysis – Compare Actual vs Target vs Previous Year with clear trend arrows.
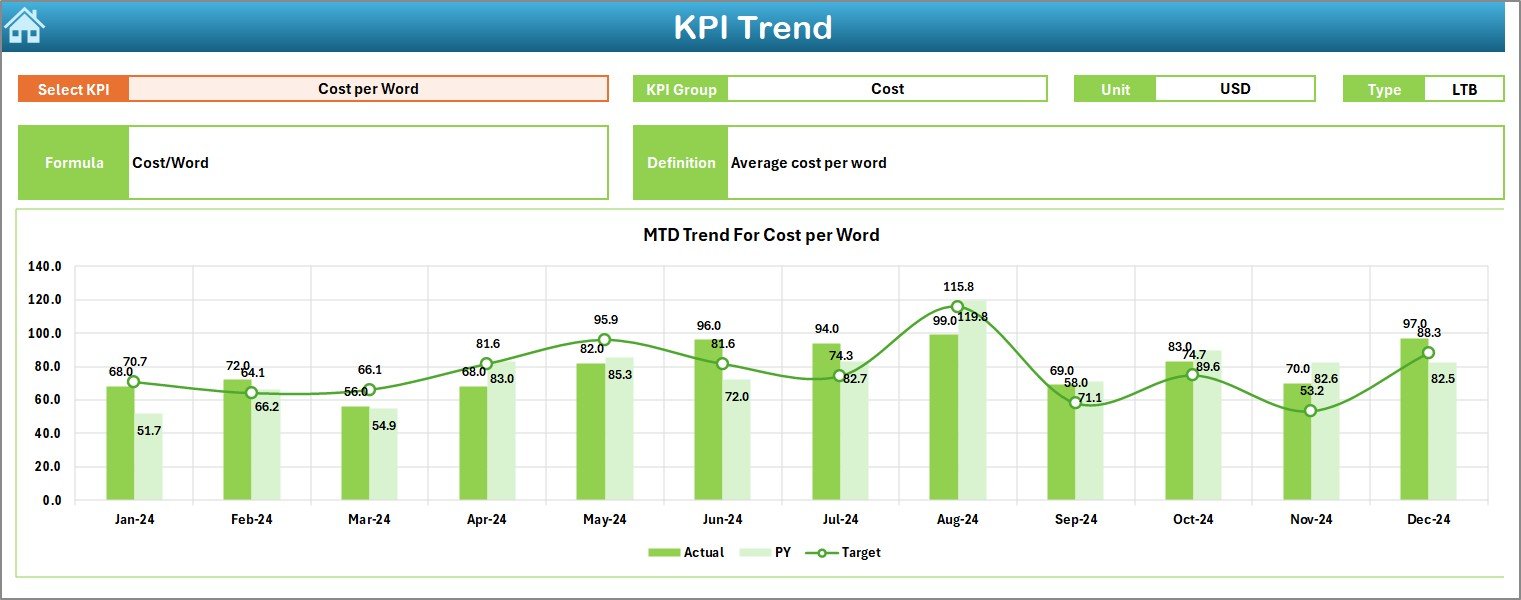
📉 Detailed KPI Trends – Analyze monthly patterns, formulas, definitions, and performance graphs.
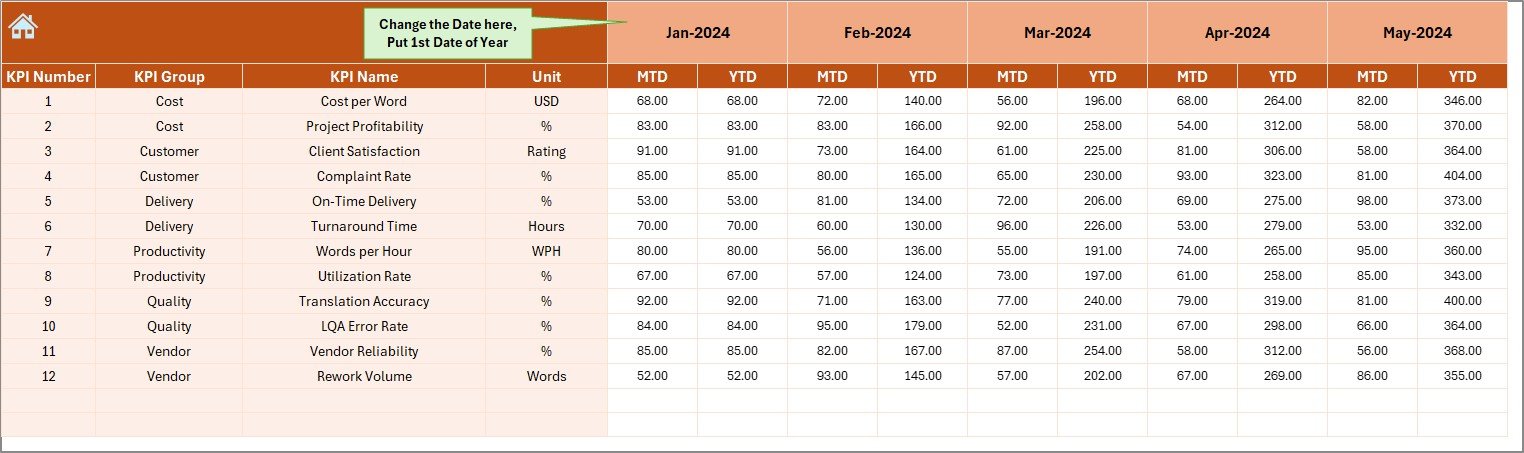
📝 Structured Data Input Sheets – Enter Actual, Target, and Previous Year values quickly without errors.
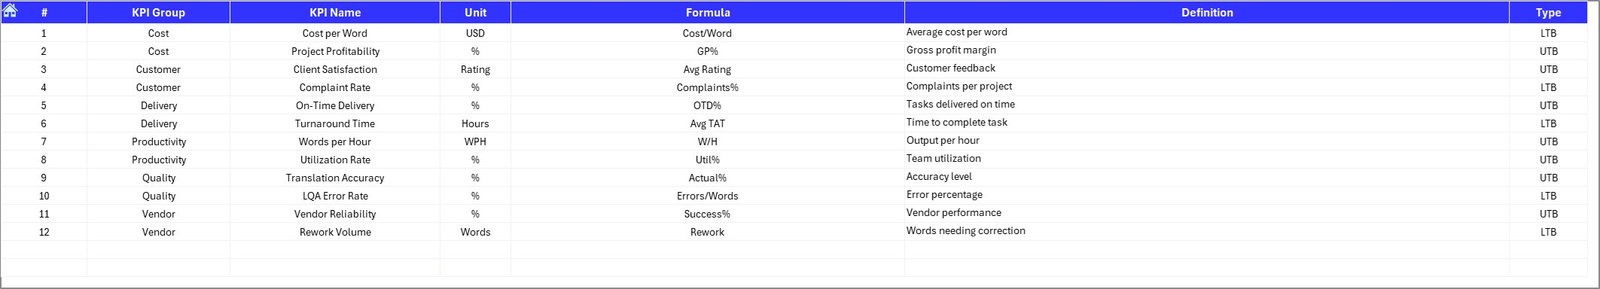
📘 KPI Definition Sheet – Standardize KPI understanding across teams with clear definitions.
📅 Year-over-Year Comparison – Track long-term improvements and performance stability.
⚙️ Fully Editable Excel File – Add, modify, or expand KPIs anytime based on your process.
⭐ What’s Inside the Translation & Localization KPI Dashboard in Excel
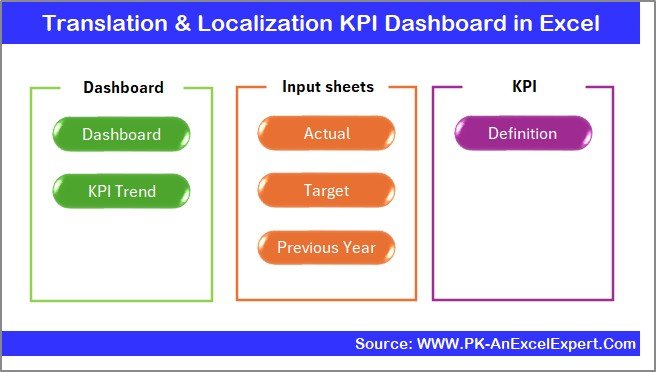
This dashboard includes 7 powerful worksheets, each designed to help you monitor your KPIs effectively:
📄 Summary Page – A simple index page with navigation buttons to move across sheets quickly.
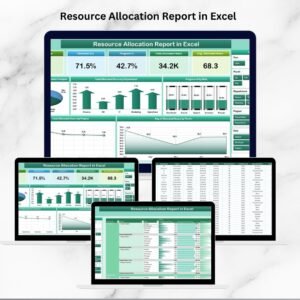
📊 Dashboard Sheet – The main visualization page showing MTD, YTD, Target vs Actual, and PY comparisons.
📈 Trend Analysis Sheet – Select any KPI and view monthly trends, definitions, KPI type, and formulas.
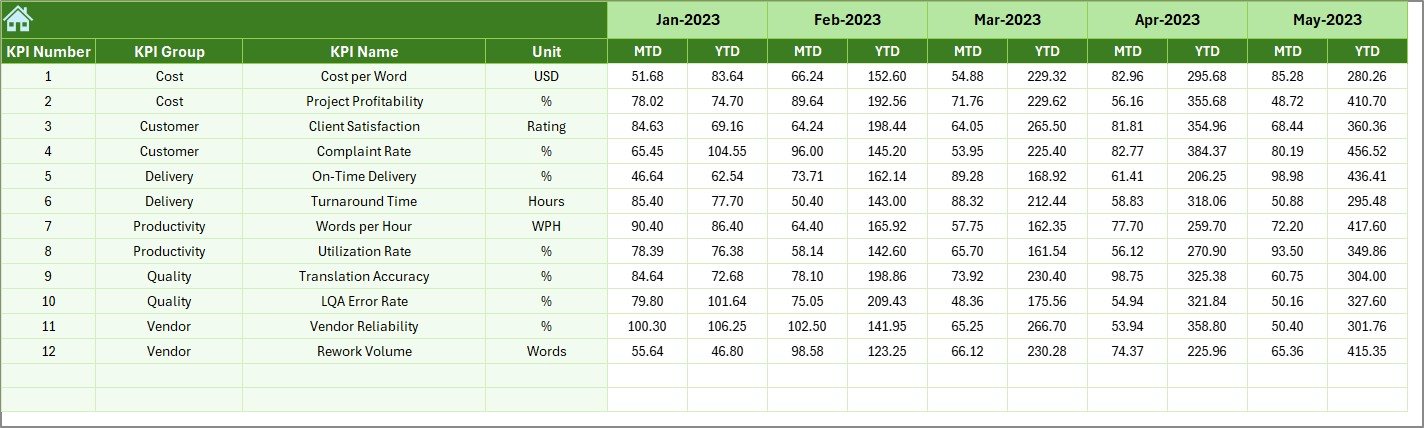
✍️ Actual Numbers Input Sheet – Enter monthly actual MTD & YTD values and let Excel calculate everything.
🎯 Target Sheet – Define monthly and yearly targets for every KPI.
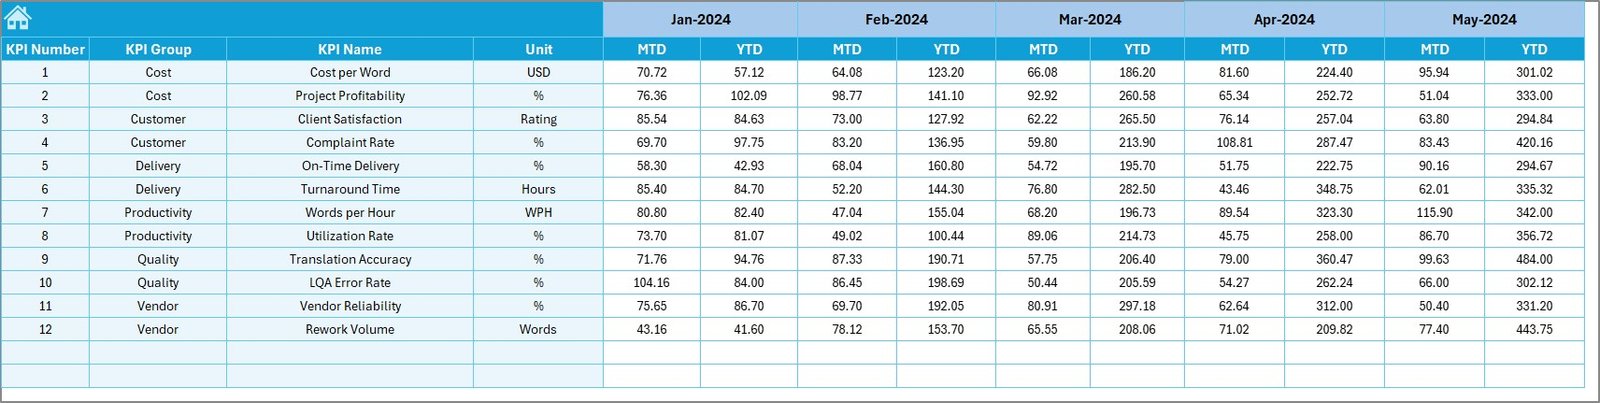
📉 Previous Year Numbers Sheet – Add last year’s KPIs for year-over-year analysis.
📘 KPI Definition Sheet – A complete dictionary of your KPI definitions, formulas, and units.
Everything is organized, automated, and easy to interpret—making reporting fast and smooth.
⭐ How to Use the Translation & Localization KPI Dashboard in Excel
⚙️ Step 1: Update Actual MTD/YTD data in the Actual Numbers Input sheet.
🎯 Step 2: Add Targets in the Target Sheet to compare against performance.
📉 Step 3: Fill in Previous Year numbers to enable YOY comparisons.
📊 Step 4: Go to the Dashboard sheet and select your reporting month from the dropdown.
📈 Step 5: Use the Trend Sheet to analyze any KPI in detail.
📘 Step 6: Refer to the KPI Definition sheet for clarity on formulas and definitions.
Within minutes, you’ll have a complete performance view—ready for team meetings, reports, and audits.
⭐ Who Can Benefit from This Translation & Localization KPI Dashboard?
👩💼 Project Managers – Track productivity, quality, and delivery performance instantly.
📝 Translators & Linguists – Understand personal KPIs and improve output.
🏢 Localization Teams & LSPs – Get a structured, professional reporting system.
📚 Editors & Reviewers – Monitor quality scores and error trends.
📊 QA Specialists – Identify gaps in quality and track rework.
💼 Freelancers – Manage projects professionally and impress clients.
📈 Agencies & Enterprises – Standardize performance monitoring across departments.
If your goal is faster reporting, better accuracy, and clearer visibility—this dashboard is exactly what you need.
### Click here to read the Detailed blog post
Watch the step-by-step video tutorial:


Reviews
There are no reviews yet.