
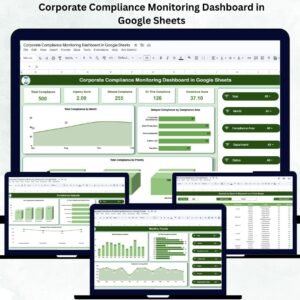
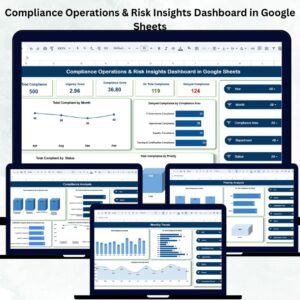
Managing compliance activities is one of the most critical responsibilities inside any organization. Delays, manual tracking, and unclear reporting often create unnecessary risk exposure. That’s why the Compliance Operations & Risk Insights Dashboard in Google Sheets is designed to simplify compliance tracking, strengthen governance, and provide real-time visibility into every compliance activity — all inside a user-friendly Google Sheets file.
This dashboard transforms raw compliance data into powerful insights using KPI cards, automated charts, and department-wise analysis. Whether you manage compliance operations, risk assessments, internal audits, or regulatory obligations, this Google Sheets dashboard gives you everything you need in a single, smart, and interactive workspace.
Key Features of the Compliance Operations & Risk Insights Dashboard in Google Sheets
This dashboard brings clarity, structure, and intelligence to your compliance operations. Every feature is built to support faster analysis and smarter decisions.
✨ Real-Time KPI Cards – Track Total Compliance, Urgency Score, Compliance Score, On-Time Tasks, and Delayed Tasks instantly.
📊 Automated Charts – Visualize trends, risks, department performance, and compliance categories with clean and interactive charts.
📅 Monthly Trend Tracking – Monitor improvement or decline in compliance performance over time.
🏢 Department & Compliance Area Insights – Identify high-risk areas and underperforming departments in seconds.
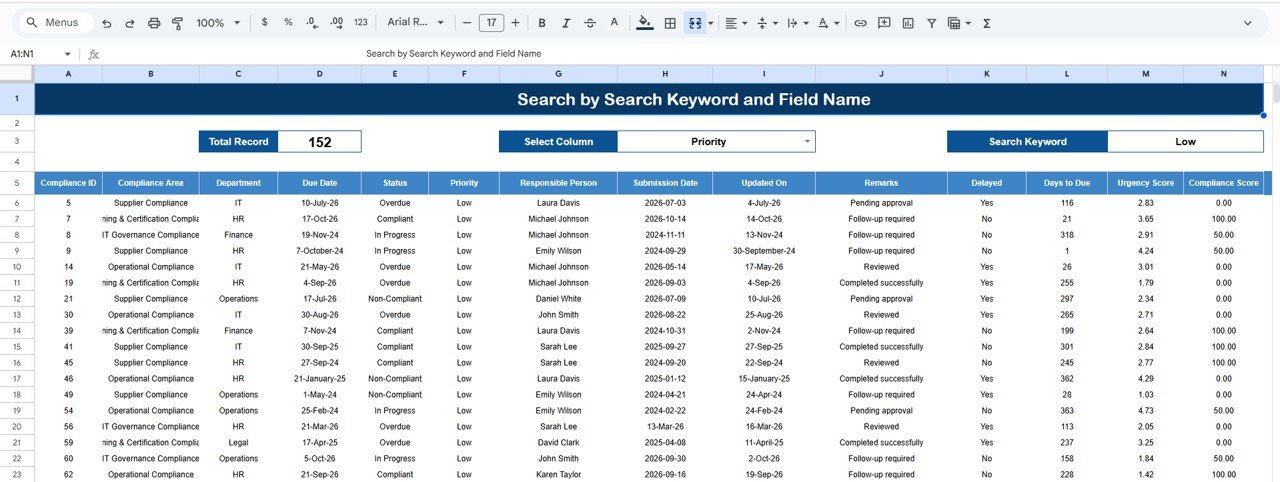
📌 Search Functionality – Quickly locate compliance records by keyword or field name.
☁️ Cloud-Based Collaboration – Perfect for teams working across departments and locations.
🛠️ Fully Customizable Template – Add KPIs, update fields, insert new departments, and scale it as your organization grows.
💡 Zero Software Cost – Built entirely on Google Sheets, making it cost-effective and easy to use.
What’s Inside the Compliance Operations & Risk Insights Dashboard in Google Sheets
This dashboard includes multiple analytical tabs to give you complete control over your compliance process:
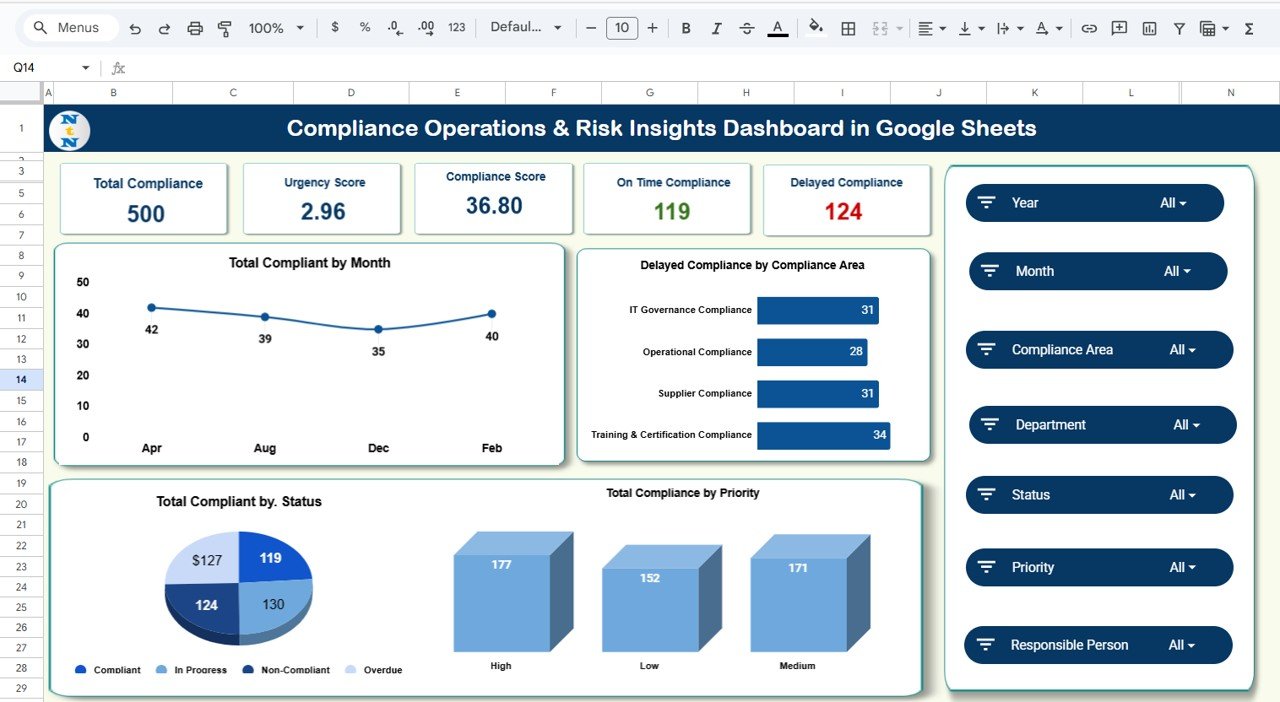
🟦 Overview Sheet Tab
A high-level view of your compliance health.
It includes KPI cards and essential charts such as:
-
Total Compliance by Month
-
Delayed Compliance by Compliance Area
-
Compliance by Priority
-
Compliance by Status
These visuals help you instantly understand where risk is increasing and where performance is strong.
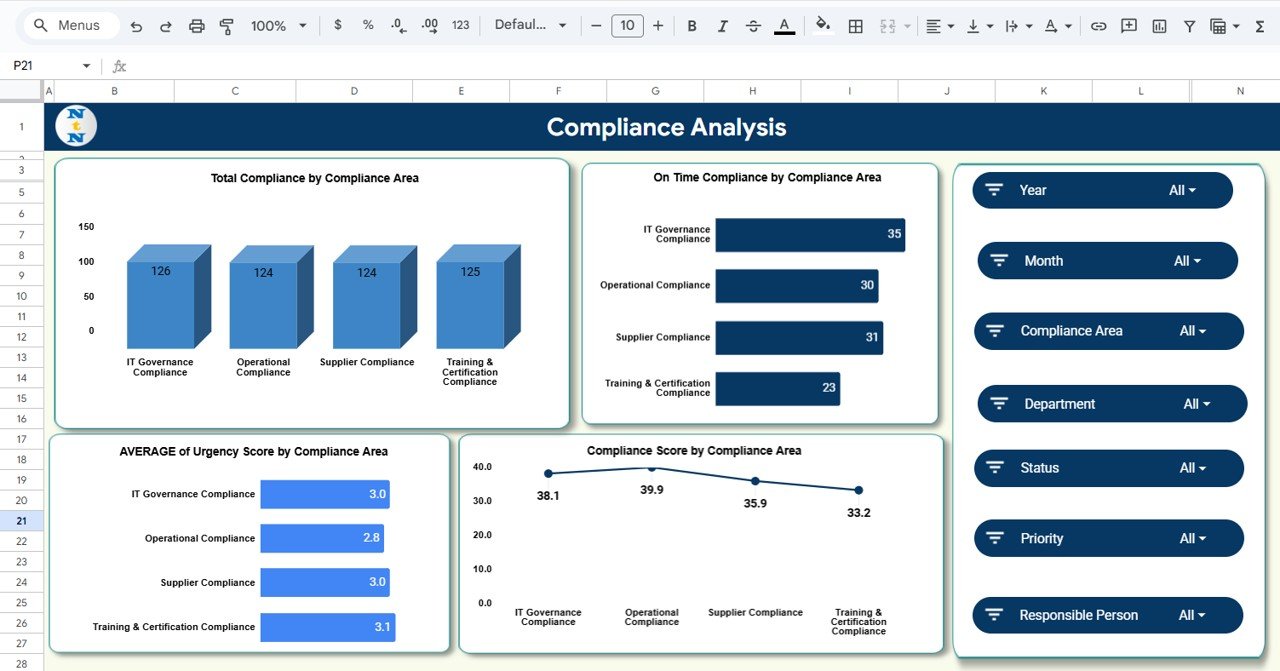
🟩 Compliance Analysis Tab
Breaks down insights by Compliance Area, showing:
-
Total Compliance
-
On-Time Compliance
-
Compliance Score
-
Average Urgency Score
This helps you identify the hot spots that require quick action.
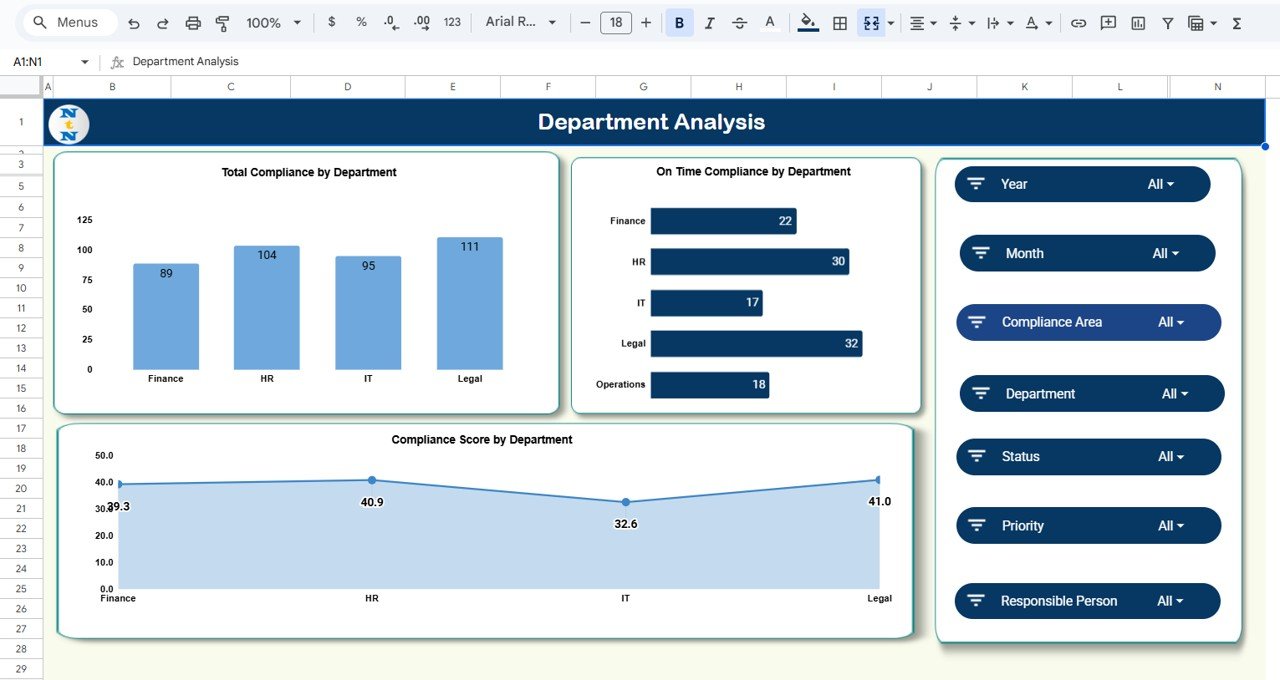
🟧 Department Analysis Tab
Understand how each department is performing.
Spot delays, low scores, and departments that require training or escalation.
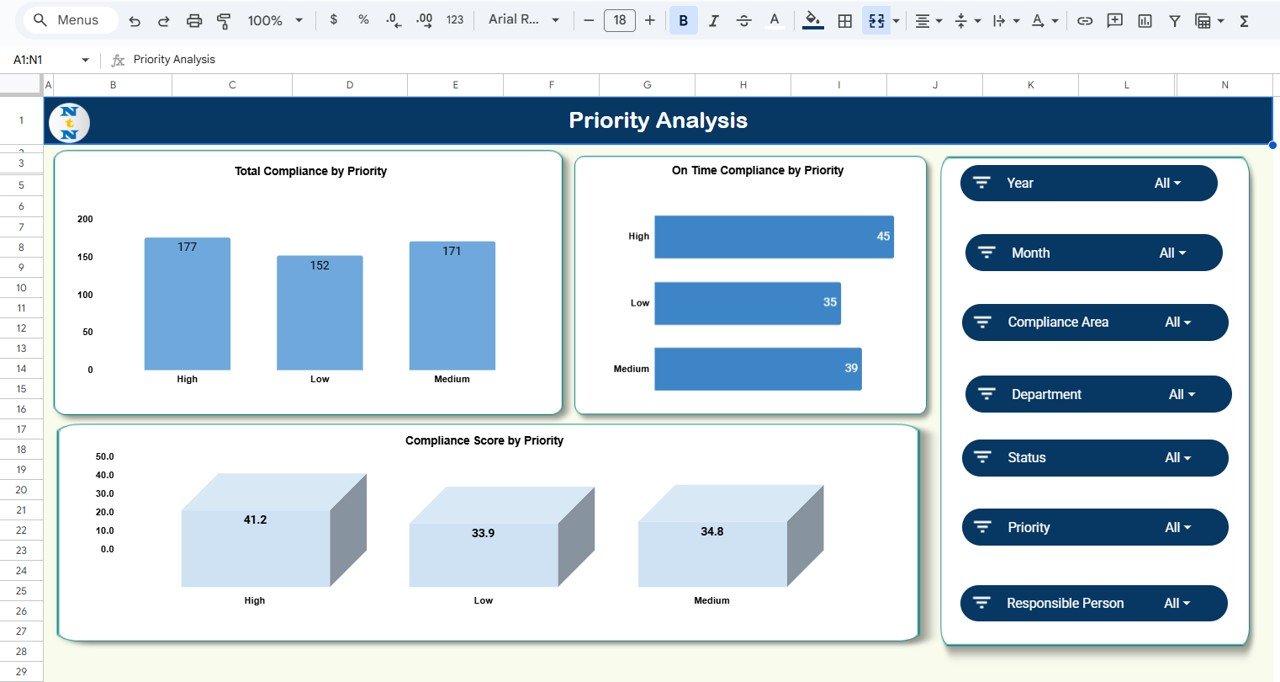
🟨 Priority Analysis Tab
Analyzes High, Medium, and Low-priority tasks to highlight urgent areas and risk-heavy categories.
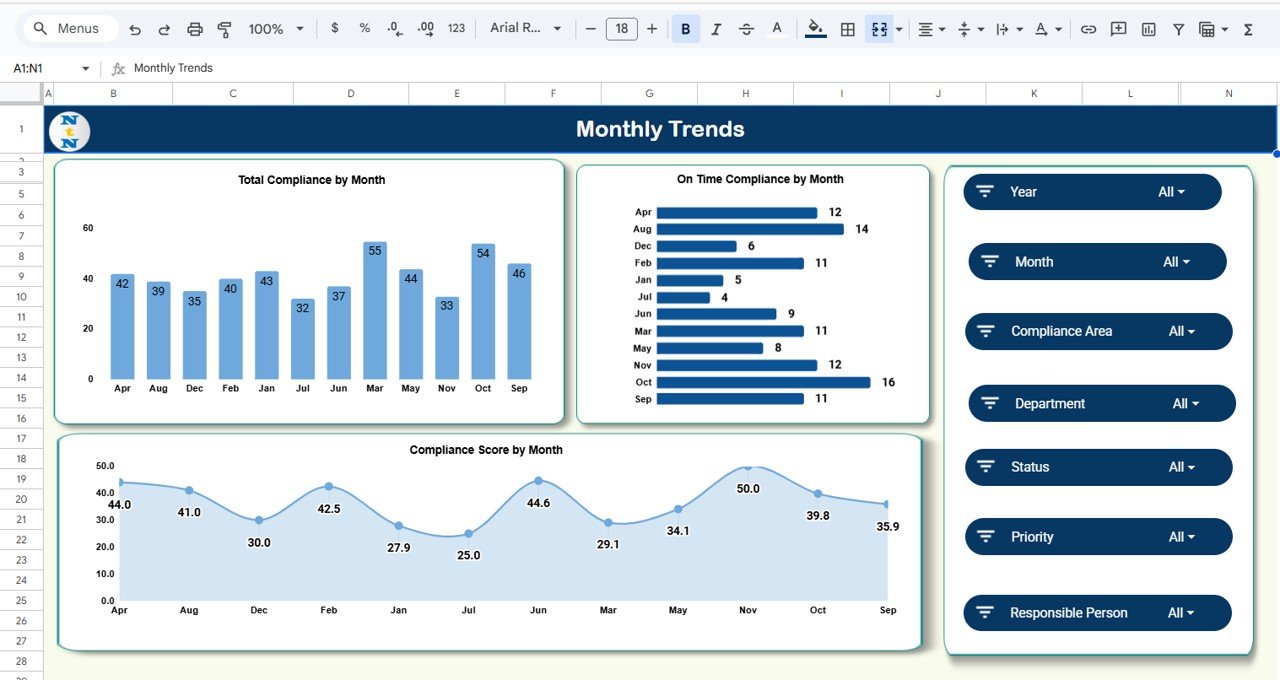
🟪 Monthly Trends Tab
Shows how your compliance performance evolves month-by-month, helping leadership predict risks and plan improvements.
🟫 Search Tab
Quickly locate compliance records using a smart search filter — useful for audits, meetings, or investigations.
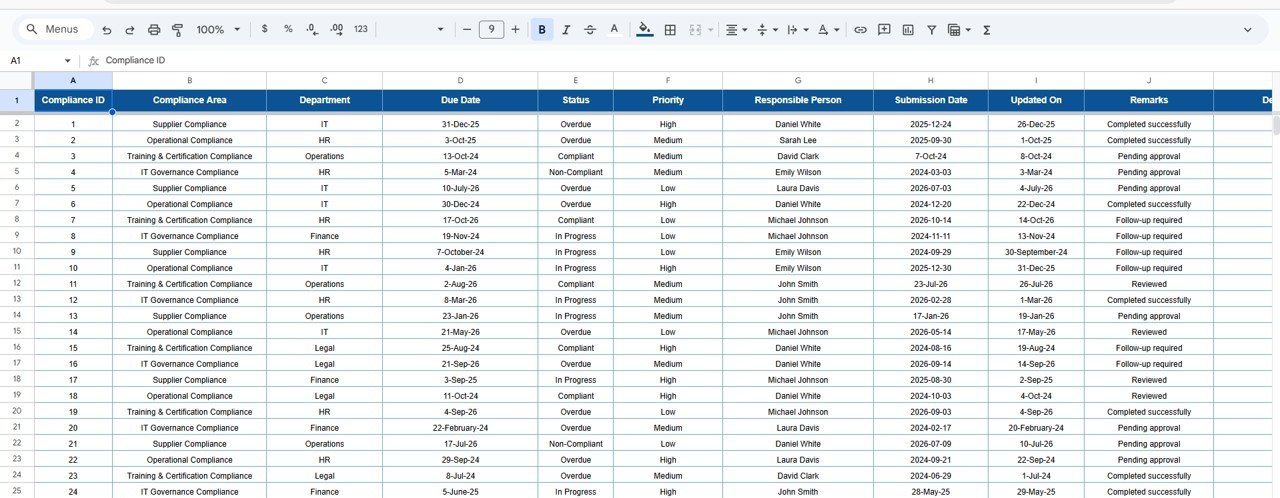
⬜ Data Sheet Tab
The heart of the dashboard.
Enter your compliance records here, including:
Compliance ID, Area, Department, Priority, Due Date, Completion Date, Status, Compliance Score, Urgency Score, Notes, and more.
All charts and dashboards update instantly based on this sheet.
How to Use the Compliance Operations & Risk Insights Dashboard in Google Sheets
This dashboard is incredibly simple to use, even for non-technical users.
🔹 Step 1: Add Compliance Records – Fill in the Data Sheet with tasks, priorities, due dates, and responsible persons.
🔹 Step 2: Track Status – Update completion dates and statuses (On-Time, Delayed, Pending, etc.).
🔹 Step 3: Review KPIs – Use the Overview KPI cards to instantly understand your operational risk level.
🔹 Step 4: Analyze Charts – Check department, priority, and compliance area visuals to identify performance gaps.
🔹 Step 5: Use Search Tab – Quickly filter records for reporting or audits.
🔹 Step 6: Review Monthly Trends – Track improvements and risk movement across months.
All changes reflect instantly across all dashboards.
Who Can Benefit from This Compliance Operations & Risk Insights Dashboard in Google Sheets
This ready-to-use Google Sheets dashboard is perfect for:
🏢 Compliance Teams – Monitor tasks and deadlines effortlessly.
📝 Internal Audit Departments – Validate compliance status before audits.
🛡️ Risk Management Teams – Identify delays and rising risk indicators.
🏥 Healthcare & Pharma – Track clinical, operational, and regulatory compliance.
💼 Finance, HR & Legal Units – Ensure timely and accurate compliance submissions.
💻 IT & Security Teams – Track security compliance, access reviews, and policies.
🏭 Manufacturing & Production Units – Monitor safety and quality compliance.
If your team needs clarity, visibility, and fast decision-making — this dashboard is a perfect fit.
Click here to read the Detailed blog post
Visit our YouTube channel for step-by-step tutorials – Neotech Navigators


Reviews
There are no reviews yet.