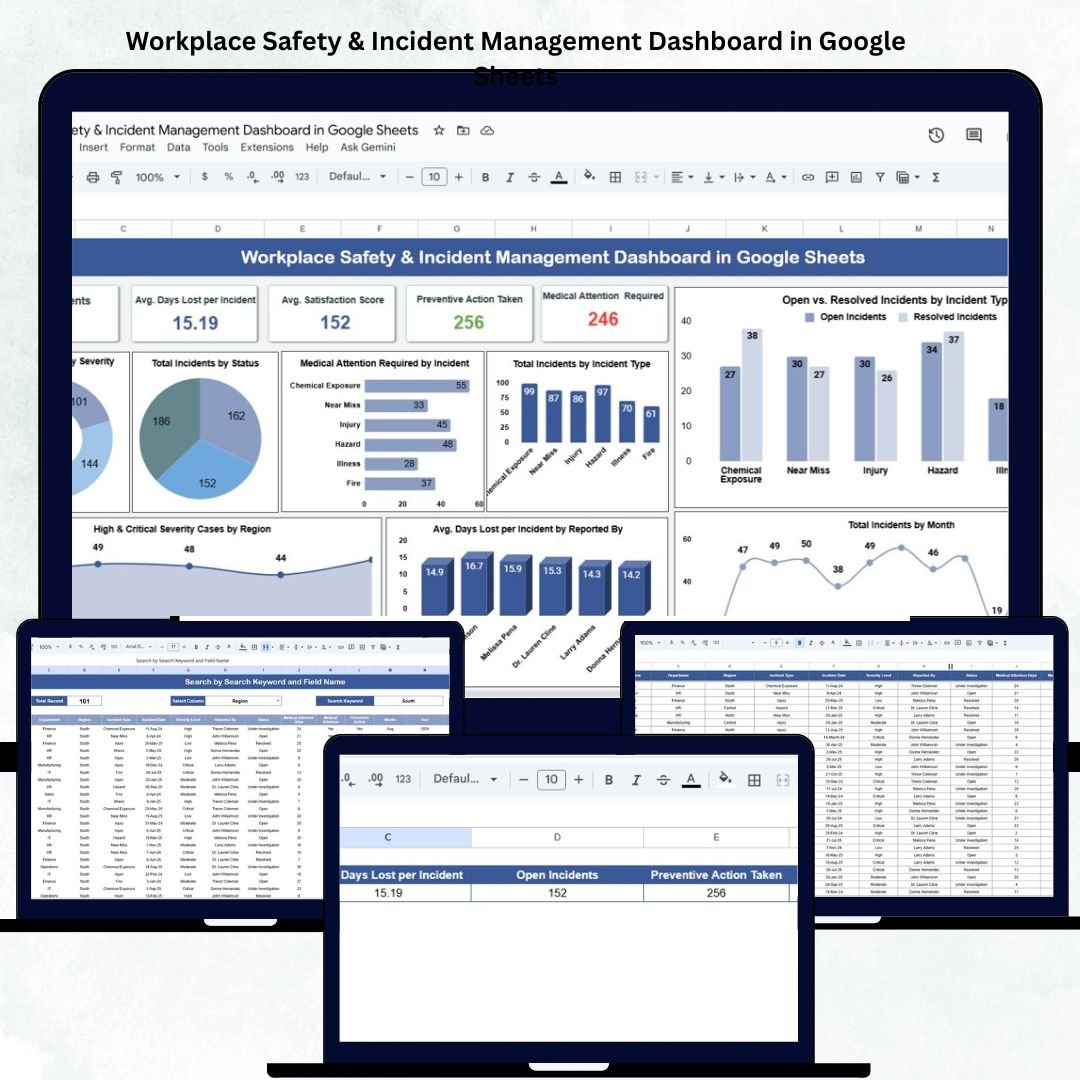
Safety at the workplace is not just a regulatory requirement — it’s a cornerstone of operational excellence. The Workplace Safety & Incident Management Dashboard in Google Sheets is a ready-to-use, cloud-based tool designed to help organizations track, analyze, and manage safety incidents effectively. 🦺📊
Built entirely in Google Sheets, this dashboard centralizes all incident data, visualizes key safety KPIs, and provides department- and category-level insights to improve workplace safety and compliance. With real-time updates, automated charts, and actionable insights, it enables safety managers and HR professionals to make informed, data-driven decisions that keep employees safe and organizations compliant.
🔑 Key Features of the Workplace Safety & Incident Management Dashboard in Google Sheets
📋 Dashboard Sheet Tab (Main Dashboard)
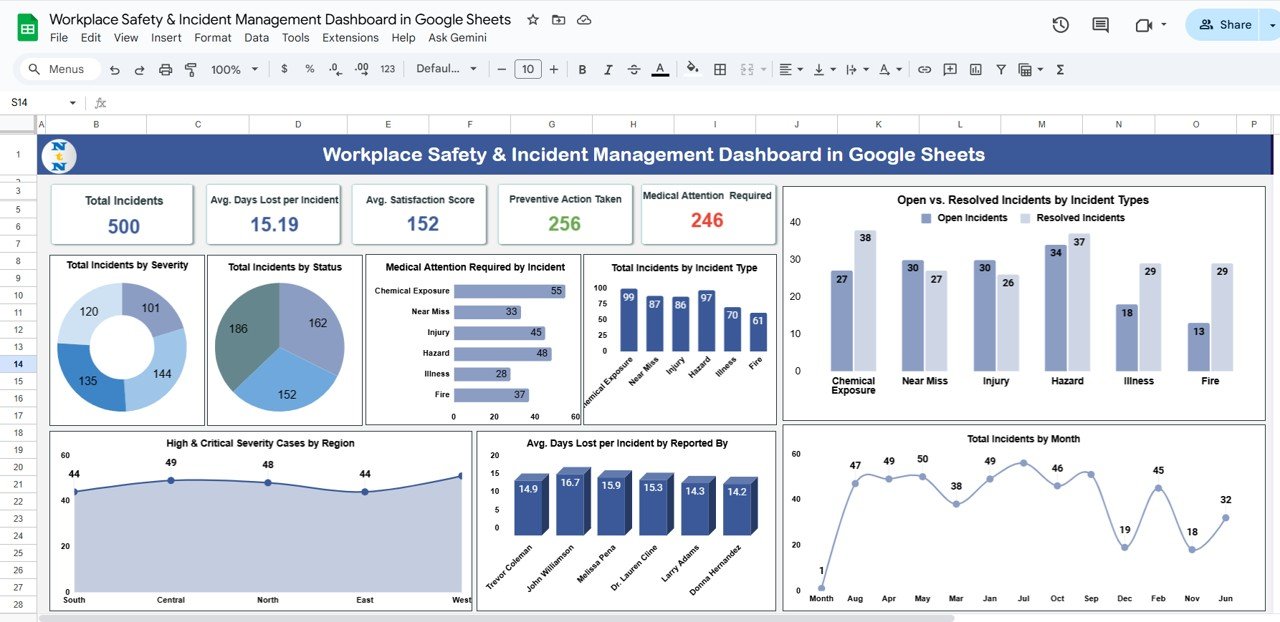
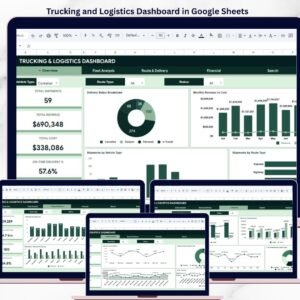
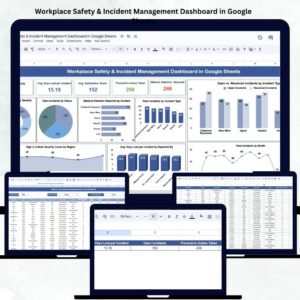
The dashboard sheet provides an interactive and comprehensive overview of workplace safety performance.
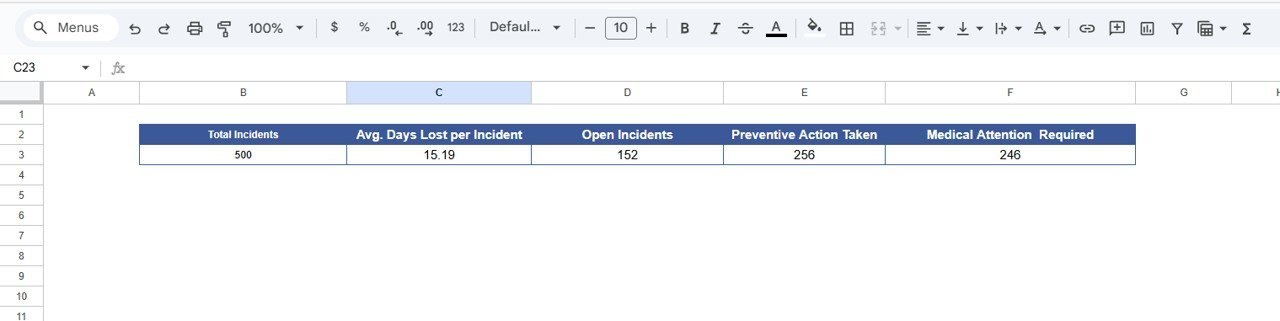
Cards Displayed:
-
🚨 Total Incidents: Overall count of incidents recorded during the reporting period.
-
⏱️ Avg. Days Lost per Incident: Measures lost time efficiency.
-
📂 Open Incidents: Tracks ongoing or unresolved cases.
-
✅ Preventive Actions Taken: Monitors completed corrective or preventive actions.
-
🏥 Medical Attention Required: Counts incidents requiring medical assistance.
Charts Included:
-
📊 Total Incidents by Severity Level – Categorizes incidents into Low, Medium, High, and Critical.
-
🧭 Total Incidents by Status – Monitors Open, Resolved, and Under Review cases.
-
🩺 Medical Attention Required by Incident Type – Analyzes incidents needing healthcare intervention.
-
⚙️ Total Incidents by Type – Breaks down incidents into Injury, Property Damage, Near Miss, etc.
-
🔍 Open vs Resolved Incidents by Type – Evaluates team responsiveness and resolution rates.
-
📅 Total Incidents by Month – Identifies spikes or seasonal patterns in incident occurrence.
-
📍 High & Critical Severity Cases by Region – Highlights high-risk areas for management focus.
These visuals give safety officers a clear understanding of risks, trends, and preventive effectiveness at a glance.
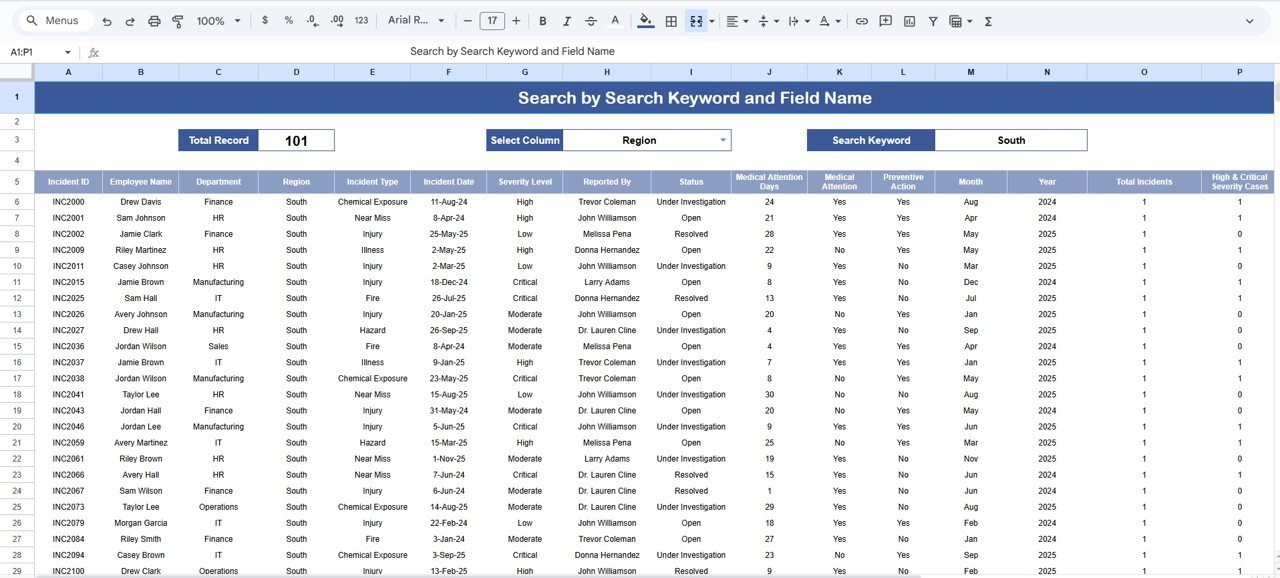
🔍 Search Sheet Tab (Smart Filtering)
Quickly search and filter incident records using keywords or specific fields.
Examples:
-
“Status = Open” → Shows all unresolved incidents.
-
“Severity = Critical” → Lists all major incidents requiring urgent action.
-
“Department = Operations” → Displays department-specific safety data.
This tab streamlines incident review, making it easy for teams to retrieve information without scrolling through large datasets.
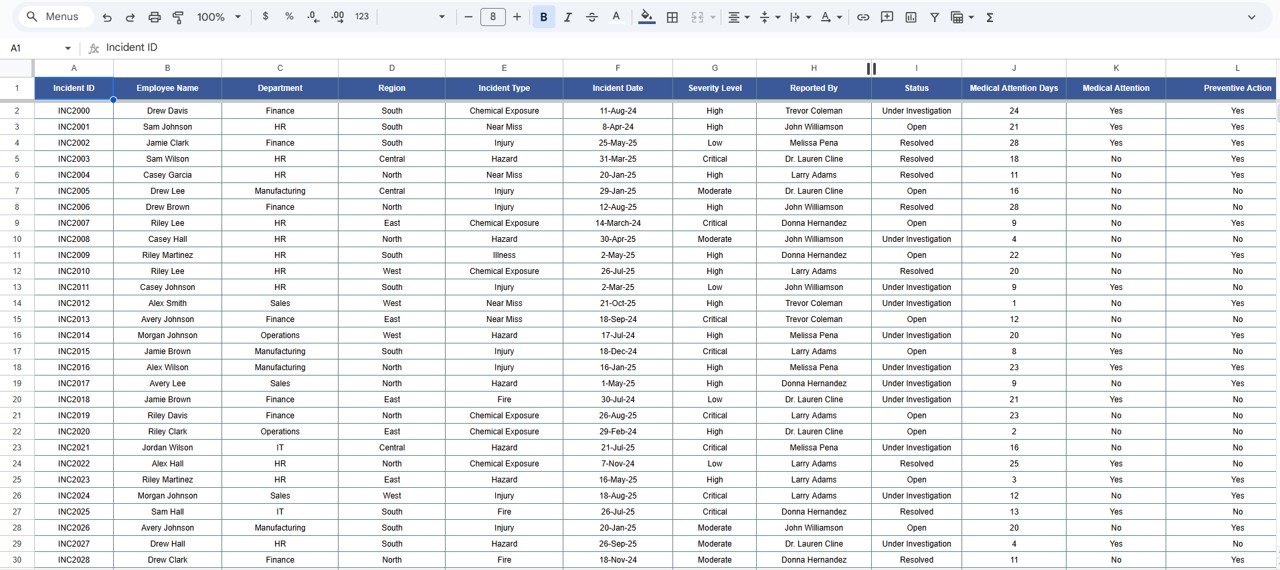
🧾 Data Sheet Tab (Incident Log)
This sheet stores the raw data that powers the dashboard, ensuring every record is traceable and standardized.
Typical Fields Include:
-
Incident ID
-
Department
-
Location/Region
-
Severity Level
-
Incident Type
-
Status
-
Days Lost
-
Reported By
-
Corrective/Preventive Actions
This structure enables automated chart updates and minimizes reporting errors.
⚙️ Support Sheet Tab (Reference Data)
Contains dropdown lists for consistent data entry, such as severity levels, departments, regions, and statuses — ensuring clean and uniform data management across teams.
📦 What’s Inside the Dashboard
✅ Pre-built, interactive Google Sheets dashboard
✅ Real-time KPI visualization
✅ Dynamic charts by severity, type, and department
✅ Smart search functionality
✅ Cloud collaboration support
✅ Customizable data fields and visuals
🧑💼 Who Can Use This Dashboard
🦺 Safety Managers & Officers – Track incidents, response times, and preventive actions.
🏭 Operations Teams – Identify high-risk areas and ensure safety protocol adherence.
👩💼 HR & Compliance Departments – Maintain legal compliance and monitor employee safety.
📊 Executives & Auditors – Gain transparent visibility into organizational safety performance.
Perfect for organizations in manufacturing, construction, logistics, and corporate offices that need centralized safety tracking.
⚙️ Opportunities for Improvement
Enhance the dashboard by adding:
-
Google Forms Integration: Capture real-time incident reports.
-
Email Alerts: Notify managers about high-severity incidents using Google Apps Script.
-
Heat Maps: Visualize incident hotspots by region or facility.
-
Root Cause Analysis (RCA) Tracking: Link causes to preventive measures.
-
Cost Analysis: Track financial impact of incidents.
🧠 Best Practices
✅ Log every incident immediately to maintain accuracy.
✅ Use consistent naming for departments and severity levels.
✅ Update status regularly to keep visuals current.
✅ Review data monthly to spot recurring issues.
✅ Use color-coded alerts for critical or overdue incidents.
🌟 Why Choose the Workplace Safety & Incident Management Dashboard
-
🧭 Centralized safety monitoring system
-
🧩 Real-time, auto-updating KPIs and charts
-
☁️ 100% cloud-based, accessible anywhere
-
🔄 Fully customizable for your organization’s needs
-
🚀 Easy collaboration between HR, Safety, and Operations teams
The Workplace Safety & Incident Management Dashboard in Google Sheets helps organizations stay proactive in managing safety incidents, reducing risks, and creating safer work environments — all through an intuitive and automated system. 🦺✅
🔗 Click here to read the Detailed blog post
Watch the step-by-step video Demo:


Reviews
There are no reviews yet.