In the modern world of architecture, data-driven performance measurement is no longer optional — it’s essential. From tracking design efficiency and project timelines to monitoring profitability and client satisfaction, every architectural firm needs a clear, measurable way to assess its performance.
That’s where the Architecture KPI Scorecard in Excel from NextGenTemplates.com comes in — a ready-to-use, professional, and interactive Excel template designed to help architects, design studios, and project managers analyze performance through well-defined KPIs.
This Excel-based scorecard transforms raw project data into visual insights, enabling you to make informed decisions and optimize your architectural processes — without complex software or coding.
⚙️ Key Features of the Architecture KPI Scorecard in Excel
📊 4 Core Worksheets: Scorecard | KPI Trend | Input Data | KPI Definition
📅 MTD & YTD Analysis: Compare Month-to-Date and Year-to-Date performance.
🎯 Target vs Actual Tracking: Instantly measure results against set benchmarks.
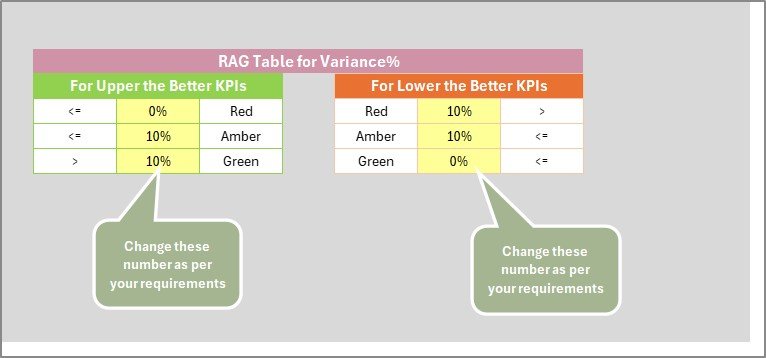
📈 Visual Indicators: Color-coded icons show success or underperformance.
🔄 Automated Updates: Real-time dashboard refreshes when data is entered.
💡 Dropdown Filters: Switch between months or analysis types with ease.
🧩 Customizable KPIs: Add or modify metrics as per project requirements.
💻 No Coding Required: 100% Excel-based and fully editable.
🏗️ Structure of the Architecture KPI Scorecard
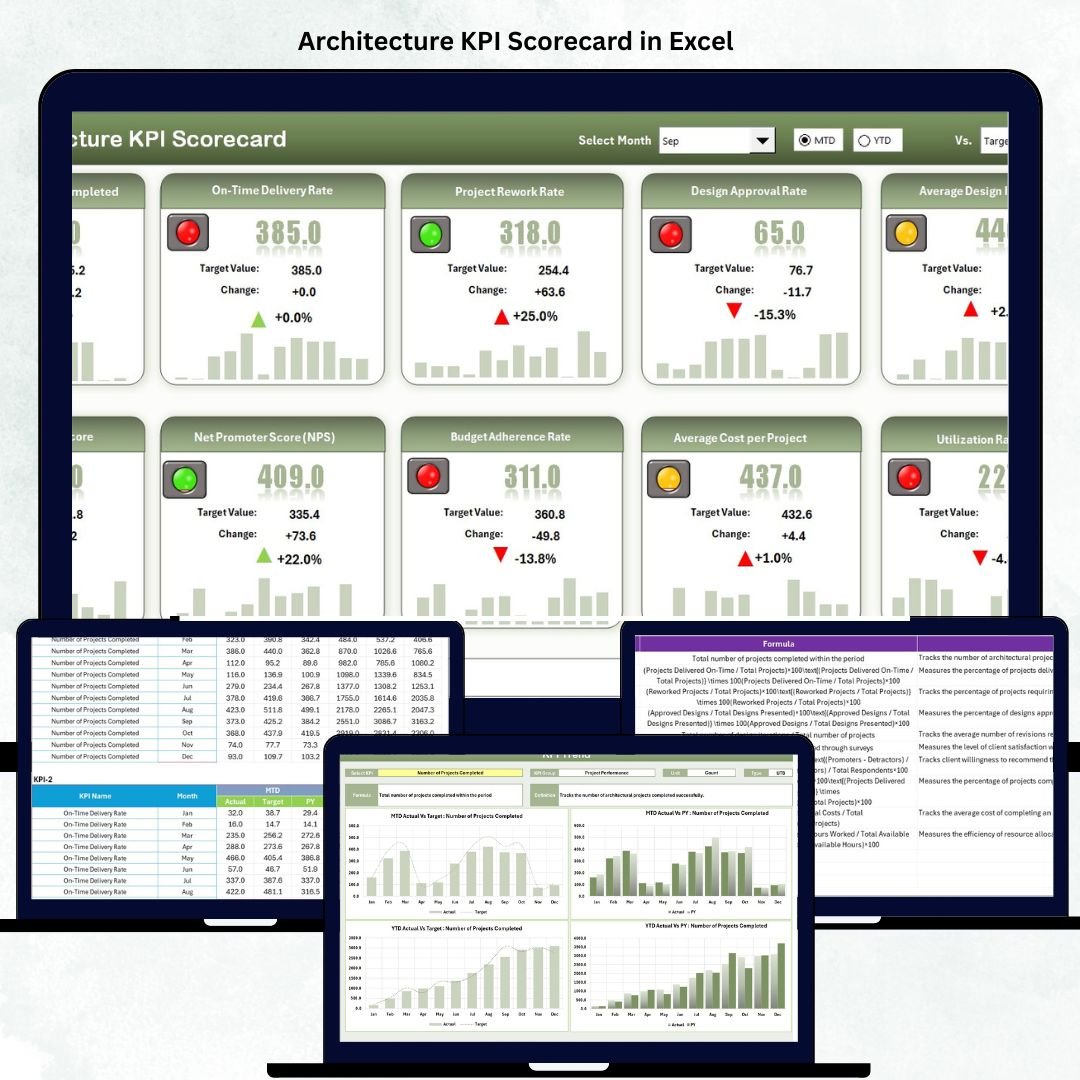
📊 1️⃣ Scorecard Sheet – The Main Performance Dashboard
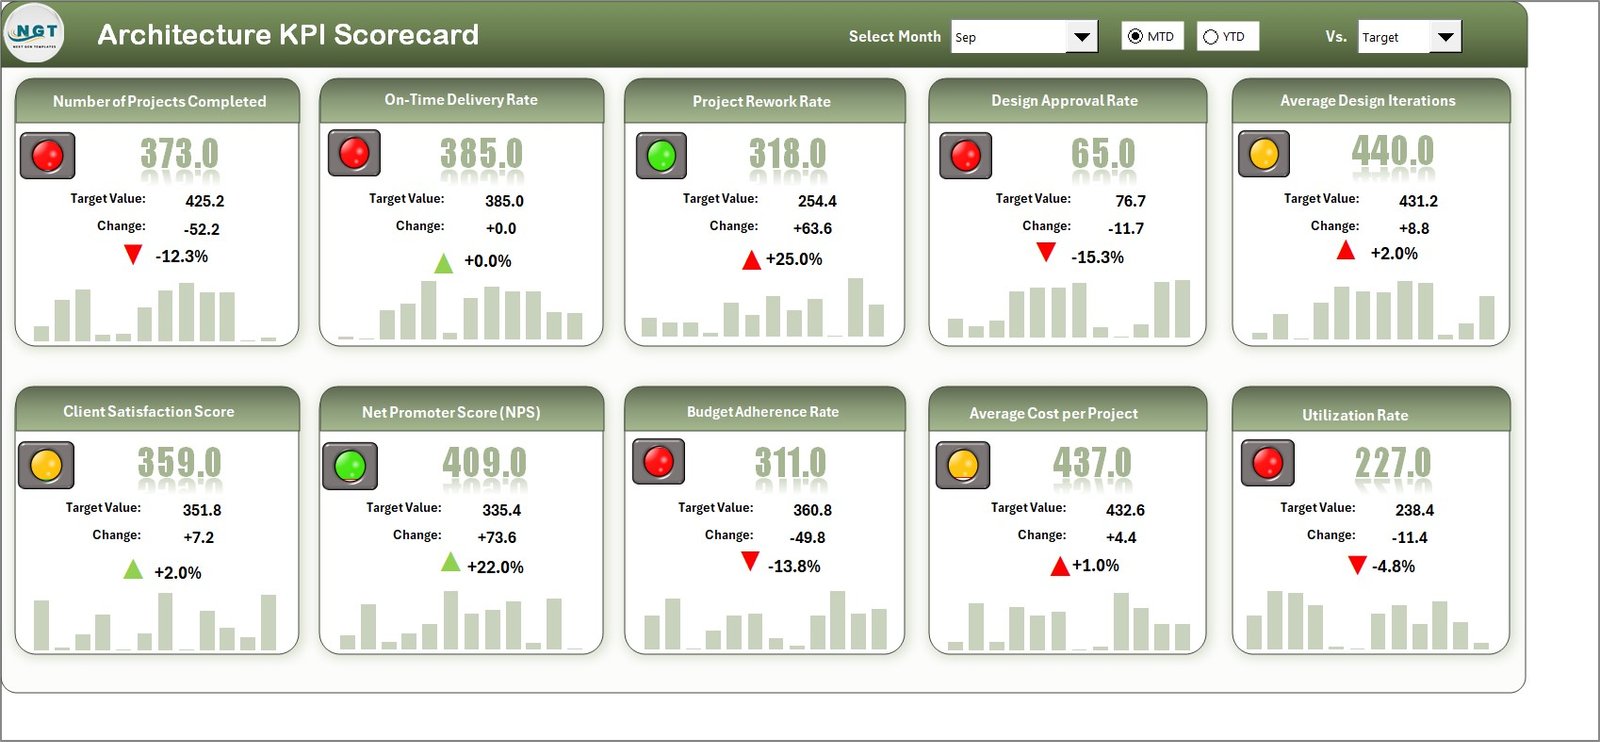
The Scorecard Sheet is the central view where all key KPIs come together.
Highlights:
-
Dropdown menus for month selection and MTD/YTD analysis.
-
Actual vs Target comparisons to measure performance.
-
Color-coded arrows indicating whether KPIs meet, exceed, or fall below targets.
-
Summary of Actual, Target, and Previous Year (PY) results.
💡 Purpose: Provide a one-glance overview of project efficiency, cost control, and client satisfaction.
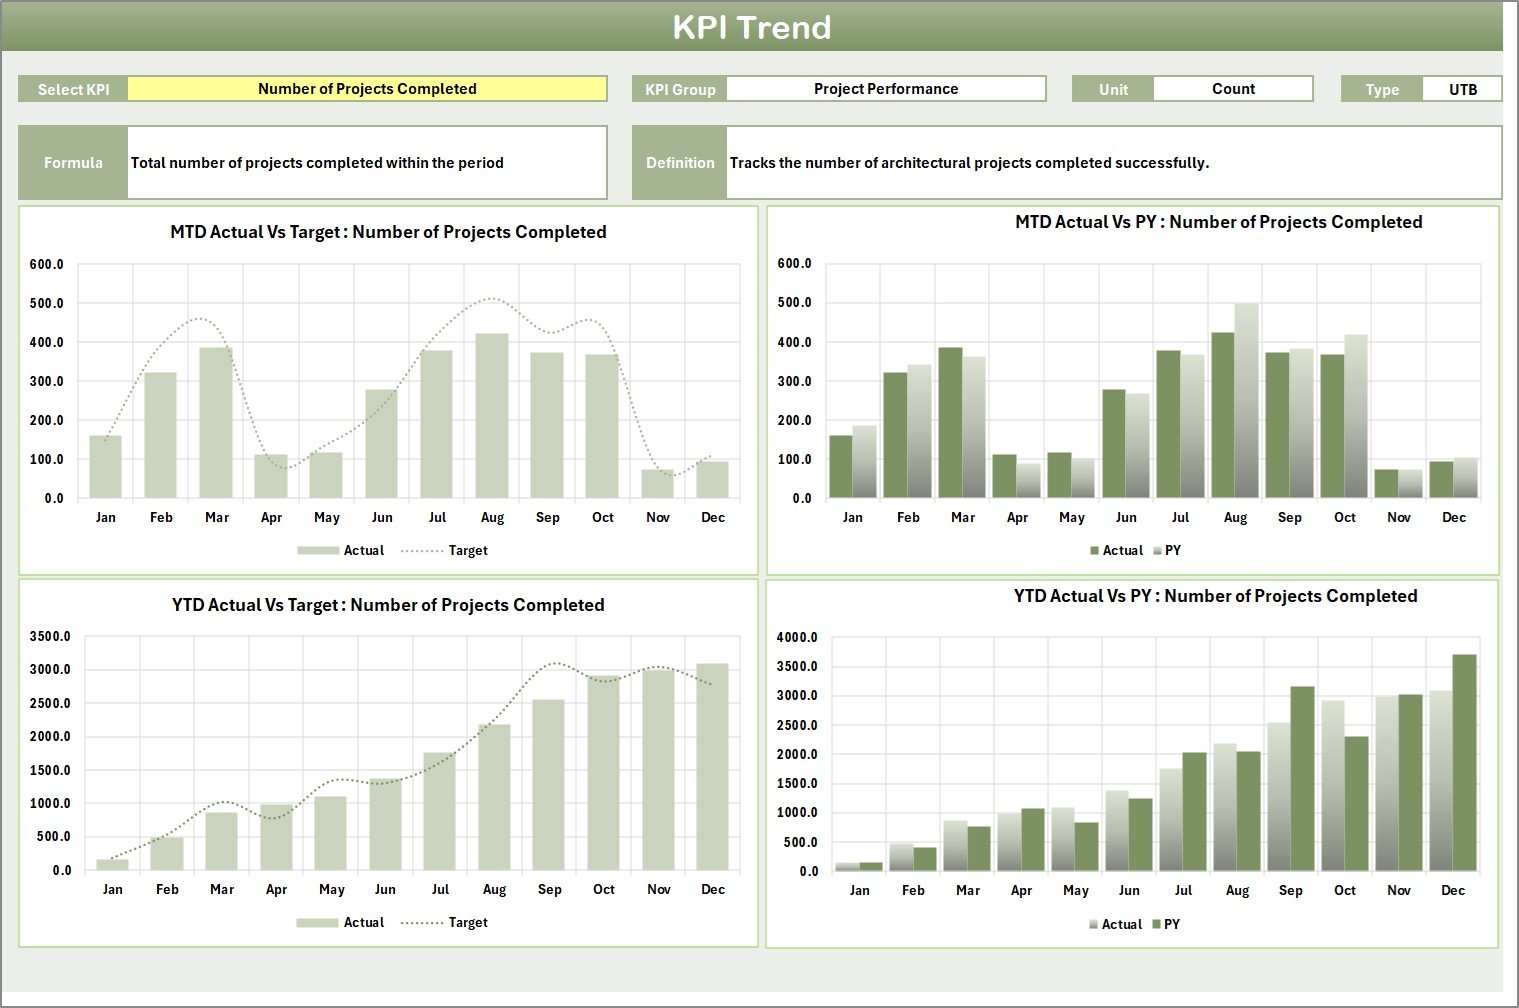
📈 2️⃣ KPI Trend Sheet – Analyze Progress Over Time
Drill deeper into each KPI to uncover monthly or yearly performance trends.
Features:
-
Select any KPI from a dropdown (cell C3).
-
View KPI Group, Unit, Type (LTB/UTB), Formula, and Definition.
-
Dual trend charts for MTD and YTD — comparing Actual, Target, and PY data.
💡 Purpose: Understand long-term trends and patterns to improve future project planning.
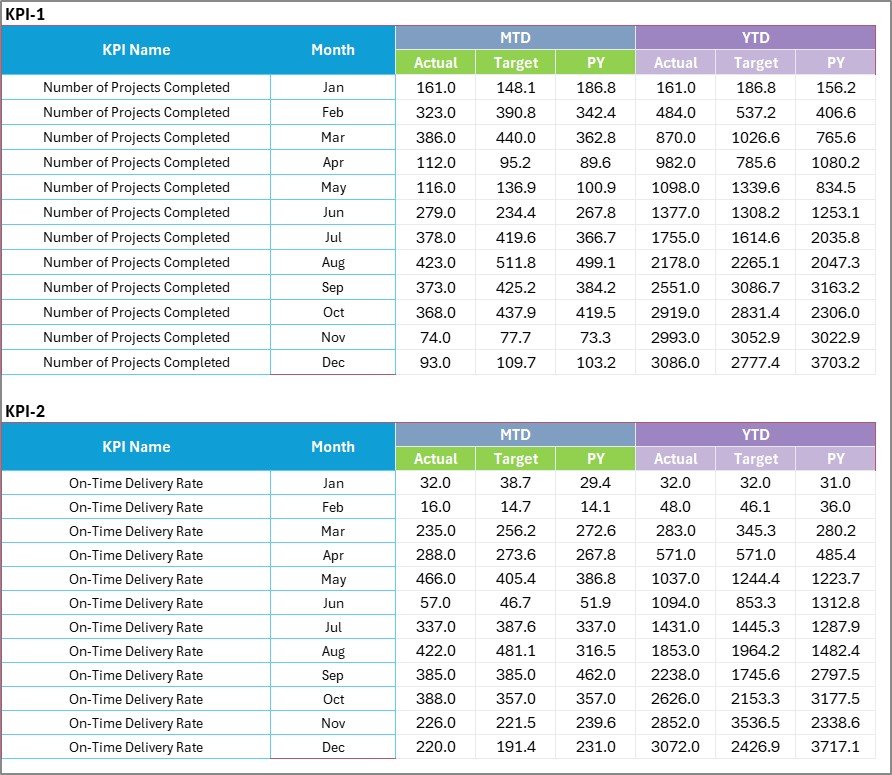
📋 3️⃣ Input Data Sheet – Centralized Data Entry
This is where all actual numbers, targets, and previous year data are recorded.
Highlights:
-
Organized structure for monthly data entry.
-
Automatic updates across all connected charts and formulas.
-
Supports data for multiple projects or departments.
💡 Purpose: Keep your dataset structured and ensure your scorecard stays current and accurate.
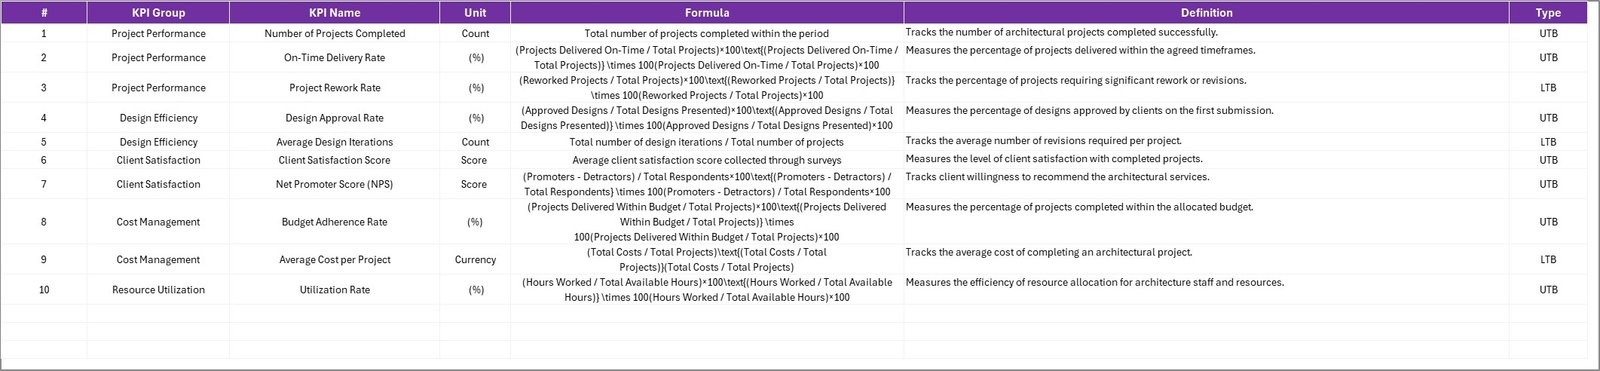
📘 4️⃣ KPI Definition Sheet – Maintain Clarity and Consistency
Your built-in KPI Reference Library ensures every metric is clearly defined.
Includes Columns For:
-
KPI Name
-
KPI Group (Financial, Operational, Client, or Sustainability)
-
Unit of Measurement
-
Formula Used
-
Definition / Description
-
KPI Type (LTB / UTB)
💡 Purpose: Eliminate confusion and maintain standard definitions across the organization.
🌟 Advantages of Using the Architecture KPI Scorecard in Excel
✅ Improved Decision-Making: Access all project KPIs in one visual dashboard.
📊 Enhanced Accountability: Assign ownership and track team-level performance.
📈 Profitability Tracking: Detect budget deviations early and boost financial efficiency.
📅 Project Timeline Monitoring: Identify delays before they impact delivery.
💬 Client Satisfaction Insight: Track customer feedback and experience data.
📉 Real-Time Performance View: Data auto-updates for continuous reporting.
💼 Professional Presentation: Ideal for management reviews and client presentations.
💡 Popular KPIs to Track in Architecture
Financial KPIs:
-
Profit Margin (%)
-
Project Cost Variance (%)
-
Billable Hours Ratio (%)
Operational KPIs:
-
Design Efficiency (%)
-
Project Delivery Timeliness (%)
-
Resource Utilization (%)
Client KPIs:
-
Client Satisfaction Score (1–10)
-
Repeat Business Rate (%)
-
Change Order Frequency
Sustainability KPIs:
-
Green Material Usage (%)
-
Energy Efficiency Rating (%)
-
Compliance with Sustainable Standards (%)
💡 All KPIs are fully customizable for your firm’s specific performance priorities.
🧠 Best Practices for Using This Scorecard
📅 Update data monthly to keep insights current.
📊 Use conditional formatting for visual clarity.
🟢 Green = On Target | 🟡 At Risk | 🔴 Below Target.
🔄 Compare MTD and YTD regularly for balanced analysis.
🧩 Benchmark performance using PY data.
🔐 Protect formula cells to prevent accidental edits.
👥 Share the scorecard with project teams to promote collaboration.
👩💼 Who Can Use This Template
🏗️ Architecture Firms & Design Studios
📐 Project Managers & Design Coordinators
🏢 Construction Consultants & Engineers
📊 Business Analysts & Firm Directors
🧩 Conclusion
The Architecture KPI Scorecard in Excel is more than a spreadsheet — it’s a complete performance management solution for architectural professionals.
It empowers firms to track efficiency, cost, client satisfaction, and sustainability — all within an easy-to-use Excel file.
With interactive visuals, trend charts, and automated KPIs, this scorecard delivers real-time insights that drive smarter design, stronger profitability, and improved project outcomes.
🏗️ Measure success. Optimize design. Deliver excellence — with NextGen Templates’ Architecture KPI Scorecard in Excel.


Reviews
There are no reviews yet.