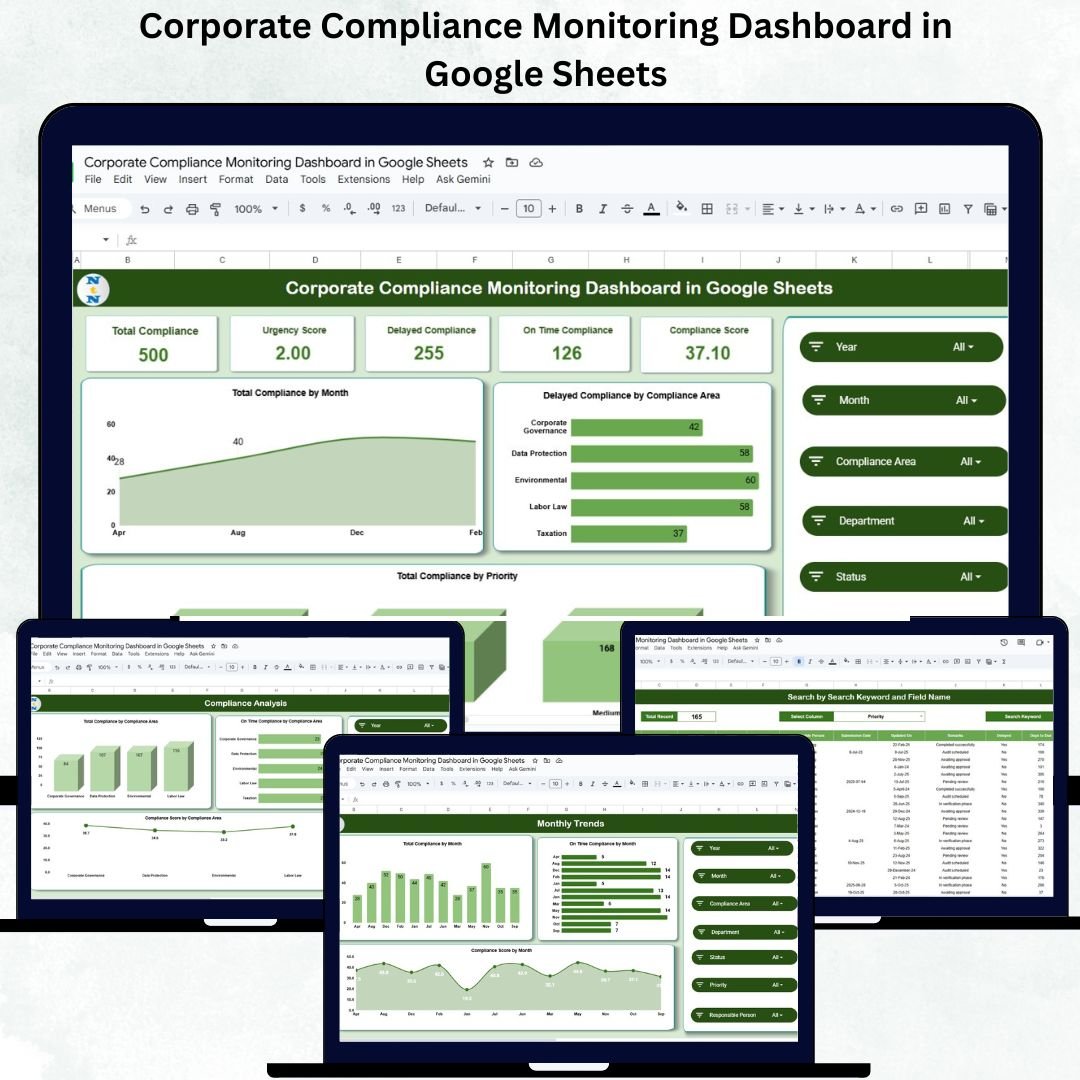
Maintaining compliance is no longer just a legal requirement — it’s a business necessity. The Corporate Compliance Monitoring Dashboard in Google Sheets offers a smart, visual, and ready-to-use solution for tracking regulatory adherence, monitoring departmental compliance, and ensuring timely completion of all compliance activities. ⚖️📊
Built entirely in Google Sheets, this interactive dashboard gives compliance officers and management teams real-time visibility into on-time vs delayed tasks, urgency scores, and overall compliance performance. With automated KPIs, dynamic charts, and an intuitive interface, you can manage corporate governance seamlessly — without any complex software setup.
🔑 Key Features of the Corporate Compliance Monitoring Dashboard in Google Sheets
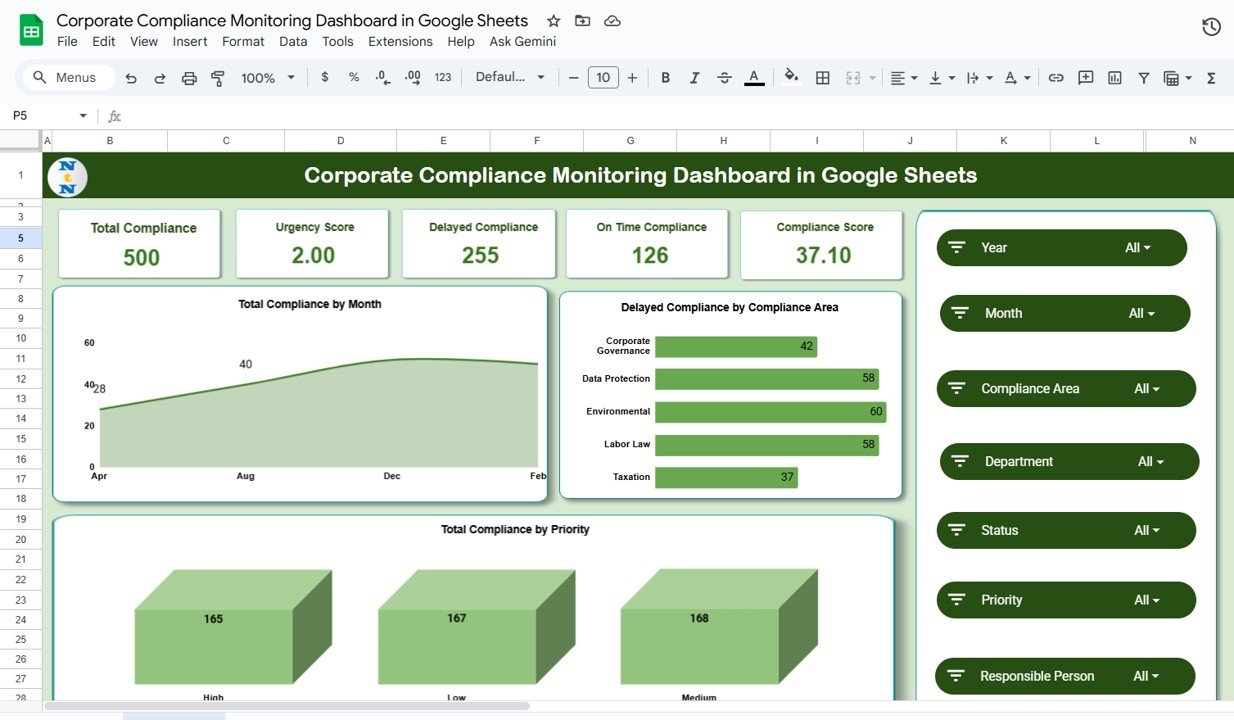
📋 Overview Sheet Tab (Main Dashboard)
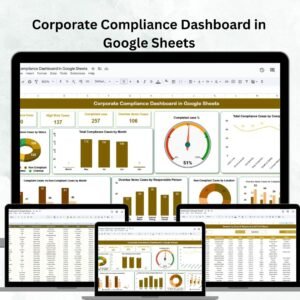
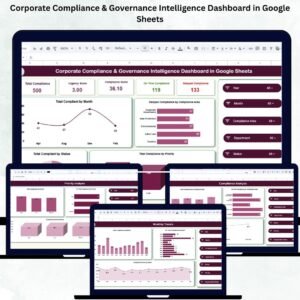
The Overview tab provides a consolidated, top-level view of compliance performance through KPIs and interactive charts.
Cards Displayed:
-
Total Compliance: Total number of compliance activities recorded.
-
Urgency Score: A weighted score representing the overall urgency of compliance actions.
-
Delayed Compliance: Total compliance items not completed by their due dates.
-
On-Time Compliance: Compliance tasks completed within deadlines.
-
Compliance Score: Overall adherence percentage calculated from timely completions.
Charts Included:
-
📅 Total Compliance by Month – Monitors monthly compliance workload.
-
⚠️ Delayed Compliance by Compliance Area – Identifies recurring problem areas.
-
🧭 Total Compliance by Priority – Analyzes compliance activities by priority level (High, Medium, Low).
This sheet acts as your command center for compliance health tracking and performance measurement.
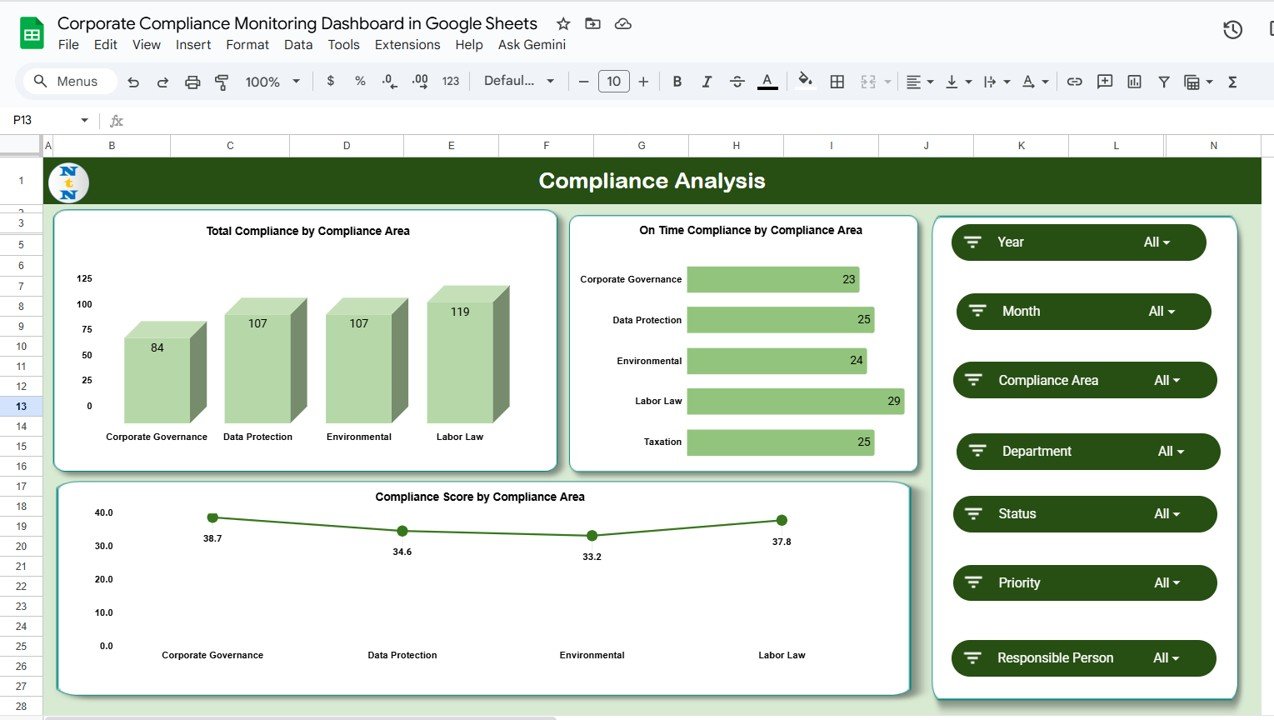
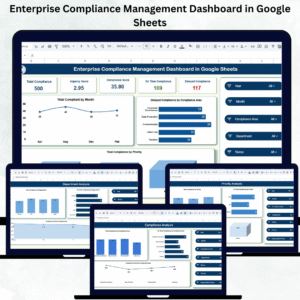
📈 Compliance Analysis Tab
Dive deeper into compliance data by specific areas such as Finance, HR, Legal, or Operations.
Charts Included:
-
Total Compliance by Compliance Area
-
On-Time Compliance by Compliance Area
-
Compliance Score by Compliance Area
This analysis enables leadership to focus on underperforming areas and allocate resources effectively.
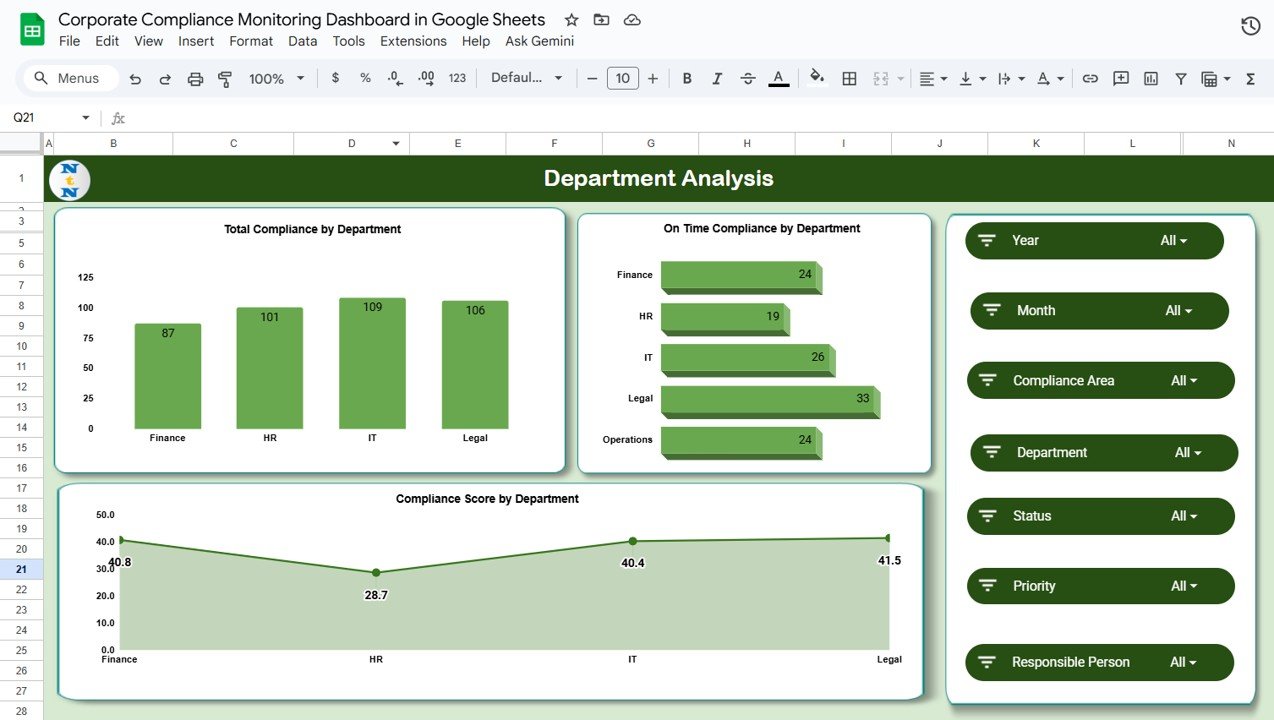
🏢 Department Analysis Tab
Evaluate compliance performance across departments to ensure accountability and transparency.
Charts Included:
-
Total Compliance by Department
-
On-Time Compliance by Department
-
Compliance Score by Department
This helps identify high-performing teams and highlight those that may need additional training or process improvements.
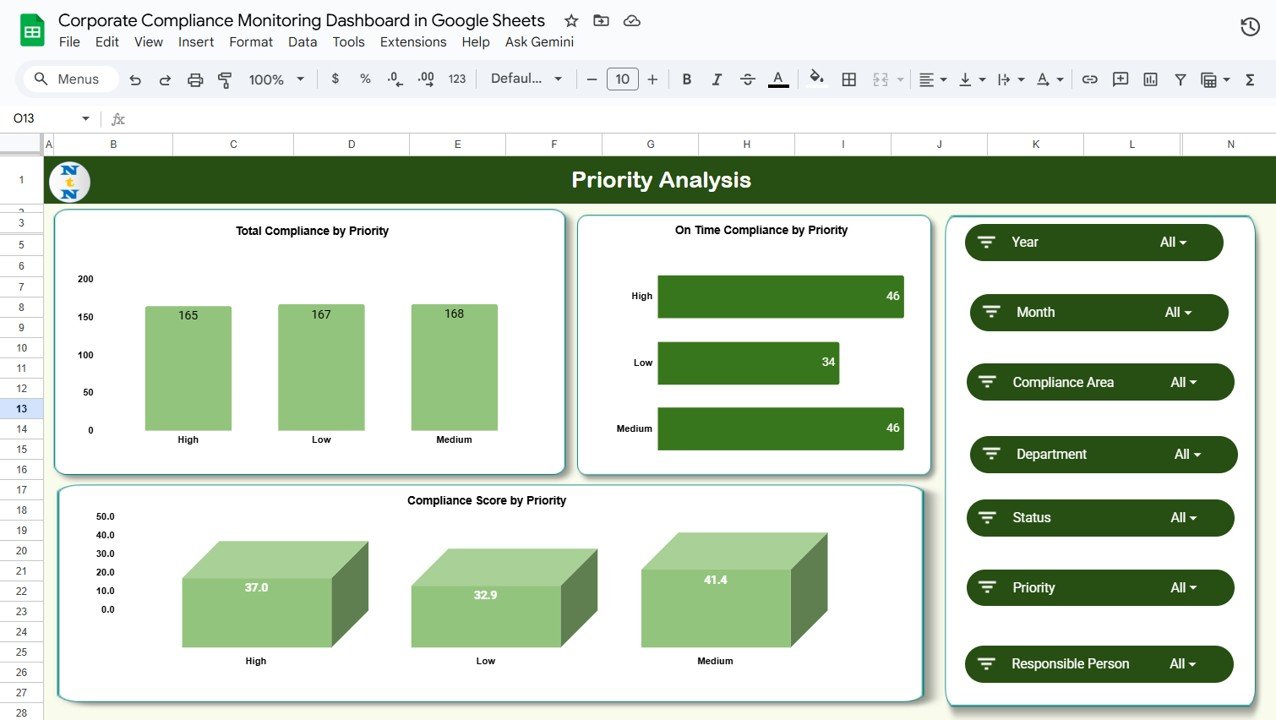
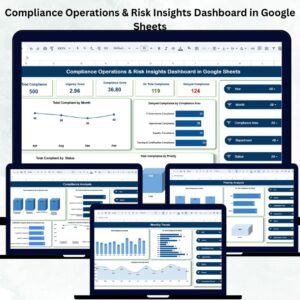
🚨 Priority Analysis Tab
Assess compliance effectiveness based on urgency levels.
Charts Included:
-
Total Compliance by Priority
-
On-Time Compliance by Priority
-
Compliance Score by Priority
Use this data to ensure critical compliance items receive the fastest attention and resolution.
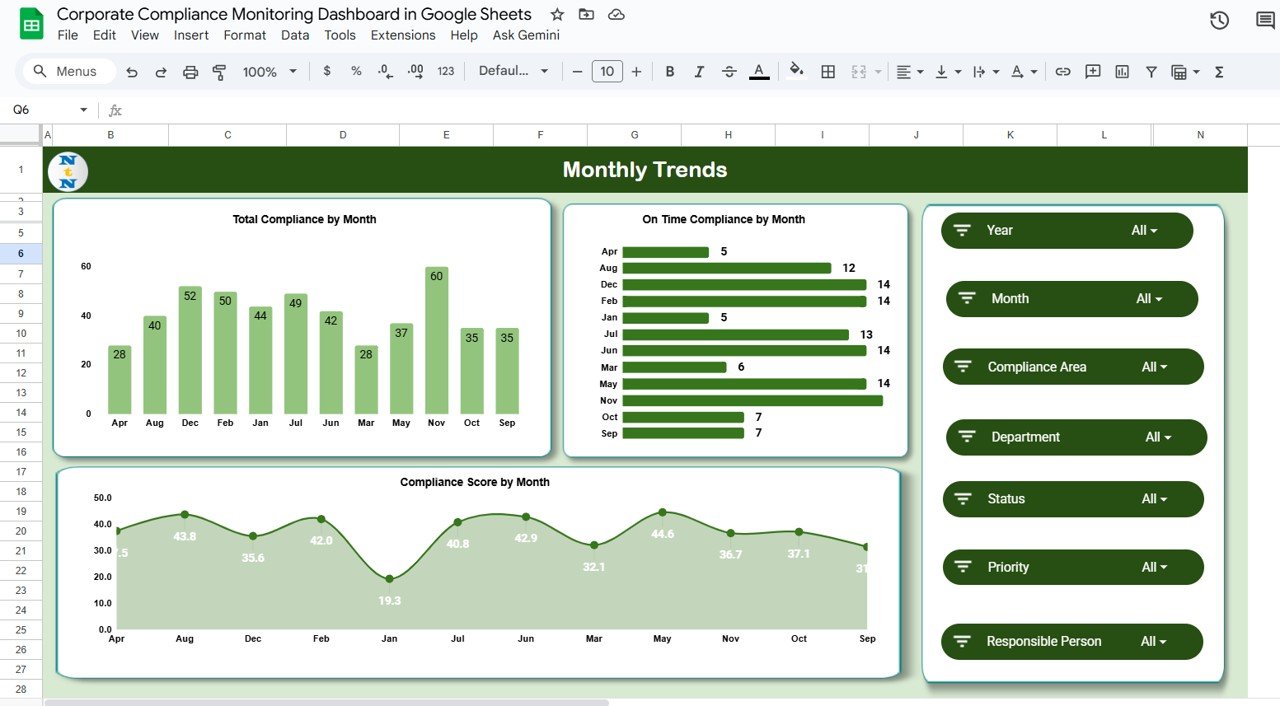
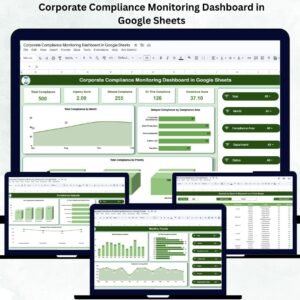
📅 Monthly Trends Tab
Visualize compliance performance over time.
Charts Included:
-
Total Compliance by Month
-
On-Time Compliance by Month
-
Compliance Score by Month
Spot recurring delays, seasonal trends, and performance improvements instantly.
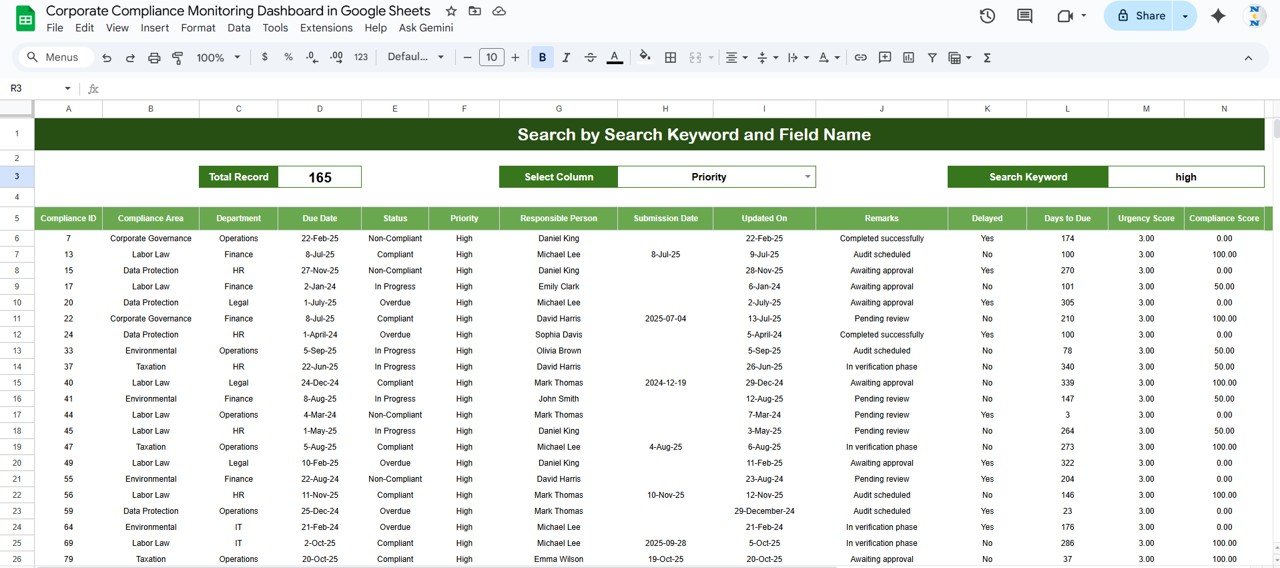
🔍 Search Sheet Tab
Quickly locate specific compliance records using filters.
You can search by:
-
Compliance Area
-
Department
-
Priority
-
Status (Completed, Delayed, Ongoing)
-
Compliance ID or Keyword
Example: Type “High Priority” to view all critical compliance activities instantly.
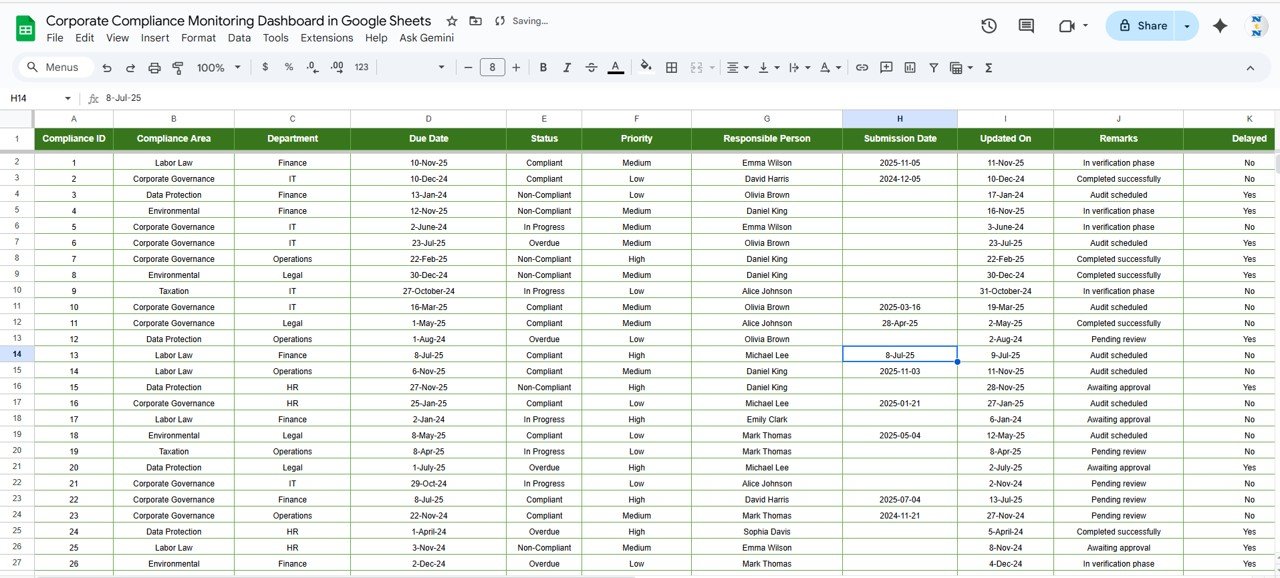
🧾 Data Sheet Tab (Input Data Source)
The data foundation of the dashboard — where compliance information is stored. Every chart and KPI updates automatically as new entries are added.
📦 What’s Inside the Dashboard
✅ Pre-built Google Sheets file with visual dashboard
✅ KPI cards for performance tracking
✅ Department, Priority, and Trend-based analysis
✅ Real-time data updates and automation
✅ Easy search and filter functionality
✅ Fully customizable chart setup
✅ Multi-user collaboration for team access
🧑💼 Who Can Benefit from This Dashboard
⚖️ Compliance Officers & Legal Teams – Track obligations and avoid missed deadlines.
🏢 Department Heads – Monitor compliance status across functions.
💼 Executives & Board Members – Get high-level visibility into compliance health.
📊 Internal Auditors – Maintain detailed, audit-ready compliance reports.
🌍 Corporates & Enterprises – Ideal for organizations managing multi-departmental compliance.
🧪 How to Use the Dashboard
1️⃣ Enter Compliance Data – Add compliance items, departments, priorities, and deadlines in the Data Sheet.
2️⃣ Review the Overview Tab – View overall compliance KPIs and charts.
3️⃣ Analyze Performance by Department or Area – Drill down to identify bottlenecks.
4️⃣ Monitor Trends Monthly – Track improvement or recurring issues.
5️⃣ Search Records – Instantly find compliance activities using filters.
💡 Pro Tip: Automate reminders for overdue tasks using Google Apps Script or integrate Google Forms for direct compliance submissions.
🌟 Why Choose This Dashboard
-
Real-time visibility into compliance progress
-
Automated and color-coded KPI visualization
-
Fully cloud-based and accessible anywhere
-
Easy customization and scalability
-
Perfect for multi-departmental tracking
-
Saves hours of manual reporting every month
The Corporate Compliance Monitoring Dashboard in Google Sheets empowers organizations to strengthen accountability, improve transparency, and maintain regulatory readiness — effortlessly. 🌟


Reviews
There are no reviews yet.