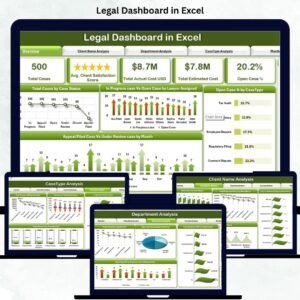
In the modern legal landscape, data isn’t just information — it’s power. ⚡ Whether you’re managing multiple cases, monitoring client satisfaction, or tracking departmental performance, having all your insights in one place can save hours every week. That’s exactly what the Legal Dashboard in Excel is designed to do — turn your complex legal data into simple, visual, and actionable insights.
Built entirely in Microsoft Excel, this ready-to-use dashboard empowers legal professionals to manage performance efficiently. No need for expensive software or complicated setups — just plug in your data and watch it transform into dynamic charts and KPIs instantly.
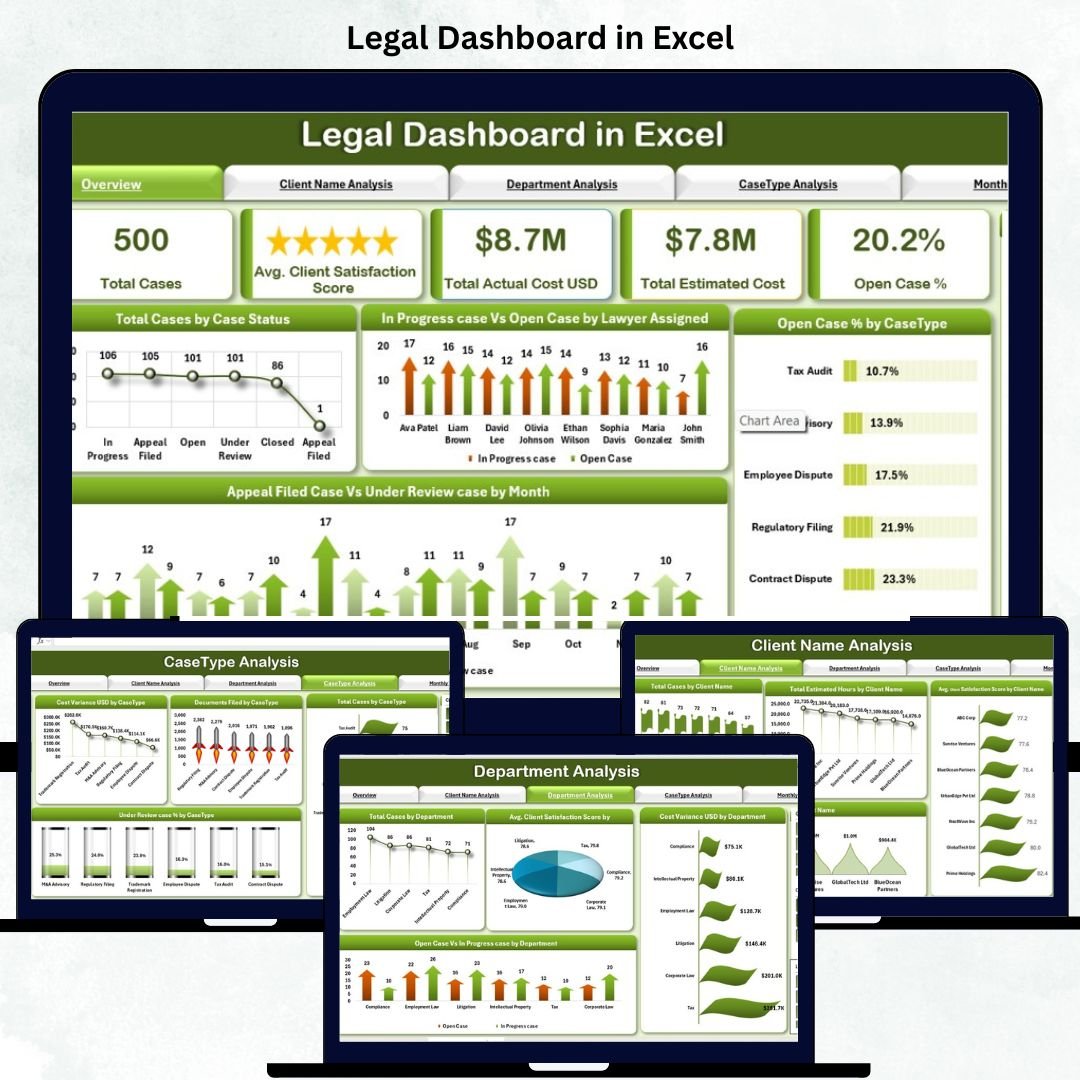
✨ Key Features of Legal Dashboard in Excel
✅ Real-Time Case Tracking: Instantly monitor the total number of cases, their status (open, closed, in-progress), and performance metrics.
📊 Client Satisfaction Analysis: Measure and visualize satisfaction scores to understand which clients are happiest and where improvements are needed.
💰 Cost & Budget Insights: Compare total actual costs versus estimated costs to detect budget variances and enhance financial control.
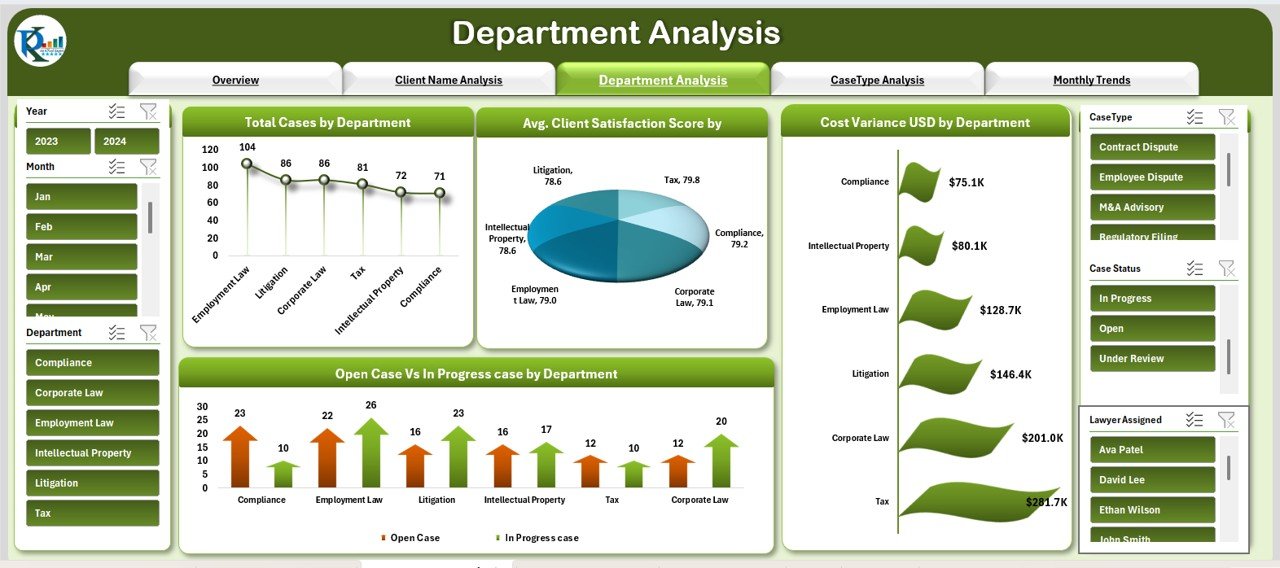
🏛️ Department-Wise Analysis: Evaluate the productivity and efficiency of each department with automated charts and KPIs.
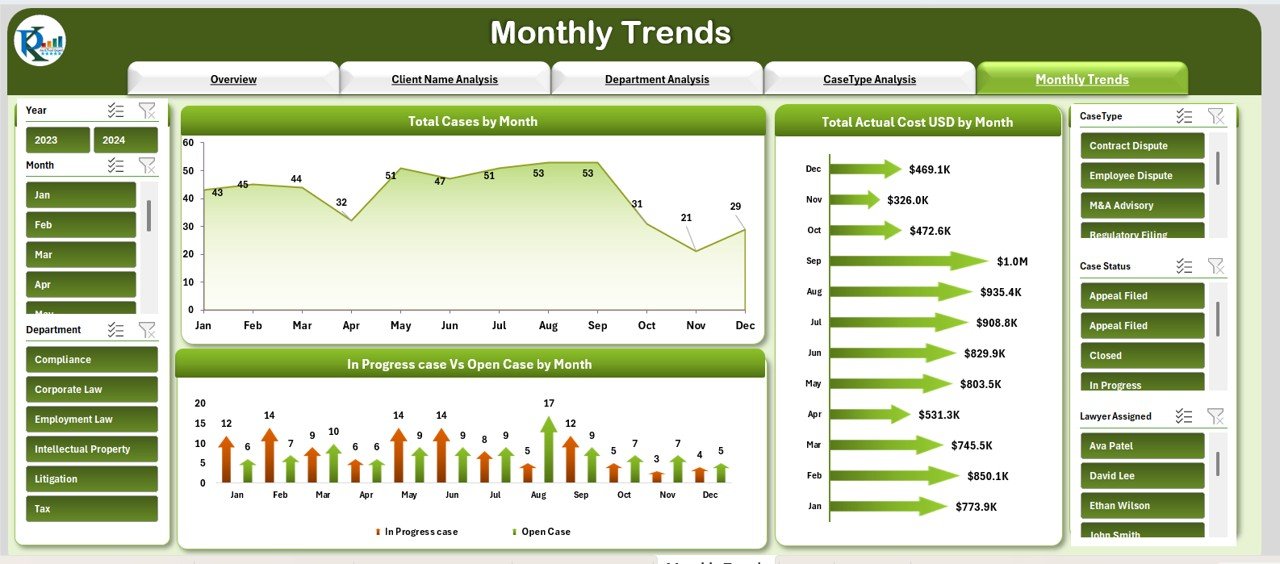
🧾 Monthly Trend Visualization: Track monthly changes in total cases, open cases, and cost performance to identify key trends.
⚙️ Fully Automated Calculations: All metrics update automatically as soon as new data is entered in the data sheet.
📈 Data-Driven Decisions: Use built-in charts and visuals to make informed strategic choices about clients, cases, and costs.
🧠 Easy Customization: Add new KPIs, case types, or departments with just a few clicks — perfect for growing legal teams.
📦 What’s Inside the Legal Dashboard in Excel
When you download this digital product, you’ll get a professionally structured Excel file with multiple pre-designed sheet tabs:
-
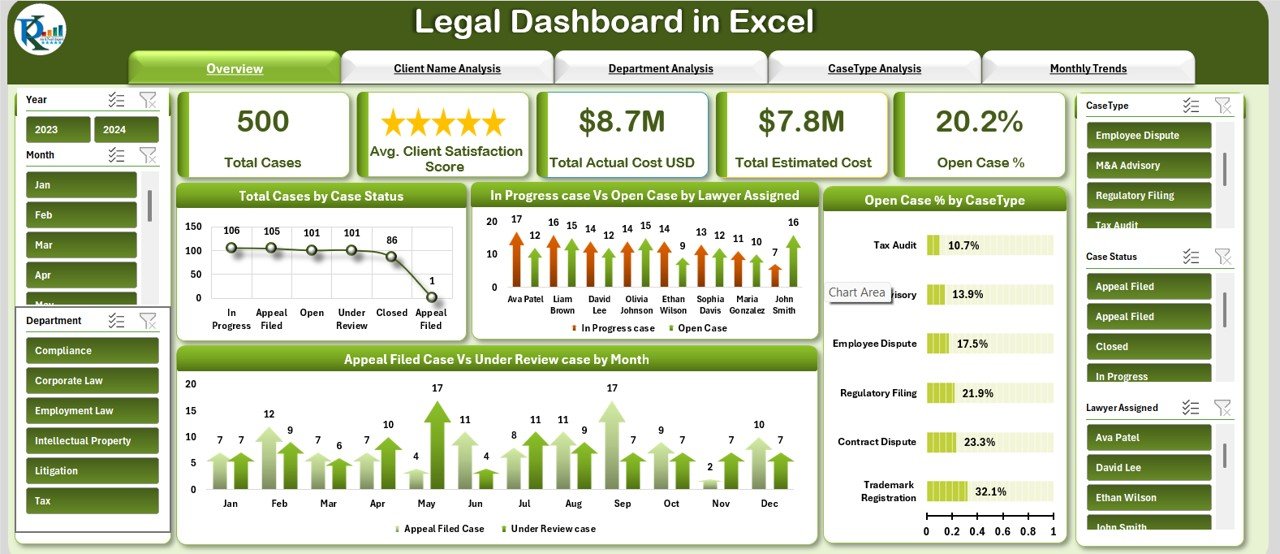
Overview Sheet: Displays key performance indicators like Total Cases, Avg. Client Satisfaction, Total Actual & Estimated Costs, and Open Case %.
-
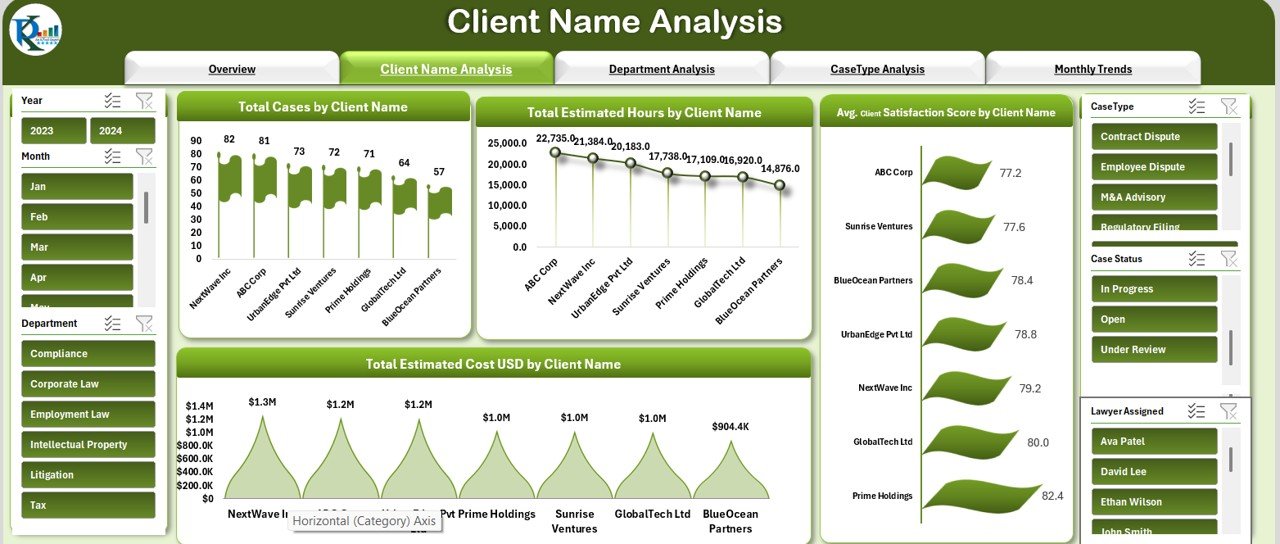
Client Name Analysis: View total cases, estimated hours, and satisfaction scores by each client.
-
Department Analysis: Compare departments based on total cases, satisfaction scores, and cost variance.
-
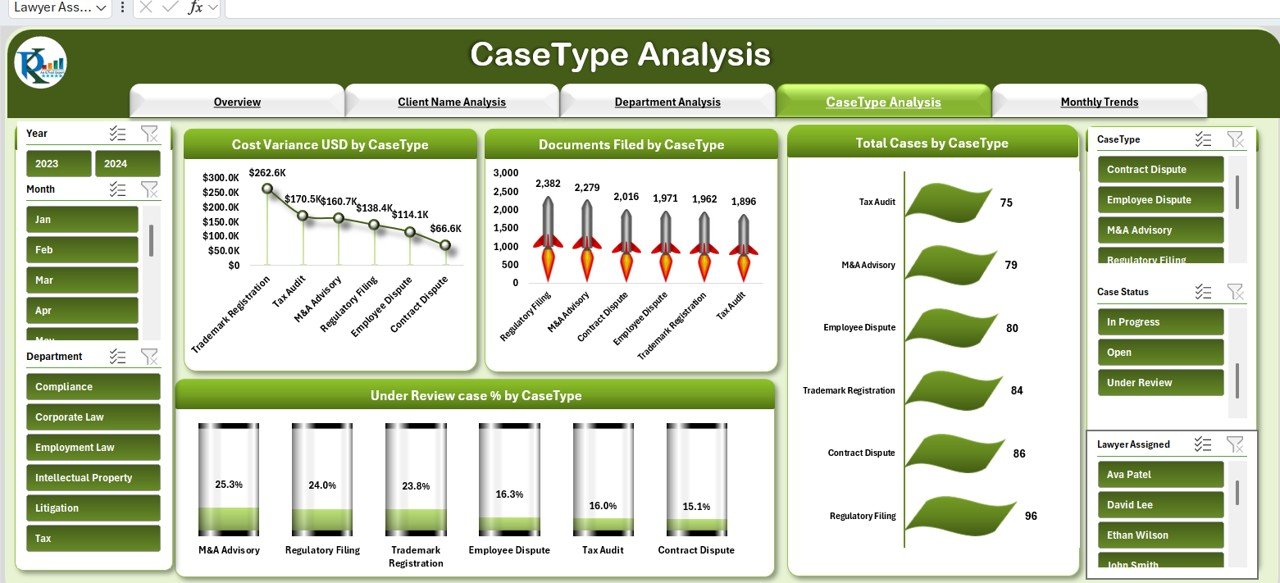
Case Type Analysis: Identify which case types are most profitable or time-consuming.
-
Monthly Trends: Review how cases and costs evolve over months.
-
Data Sheet: The core data entry area where all your raw information lives — every chart updates automatically from here.
All formulas, charts, and pivot tables are pre-built — so you can focus on insights, not setup.
🧭 How to Use the Legal Dashboard in Excel
Using this dashboard is incredibly simple — even if you’re not an Excel expert!
1️⃣ Enter Your Data: Fill in the Data Sheet with client, department, case type, and cost details.
2️⃣ Analyze Instantly: See automatic updates in the Overview and Analysis tabs.
3️⃣ Drill Down: Explore by client, department, or month to uncover patterns.
4️⃣ Share Reports: Export your dashboard as a PDF or Excel file for presentations.
5️⃣ Customize Easily: Add new KPIs, rename tabs, or apply slicers for interactive filters.
Within minutes, your raw legal data turns into a smart visual report ready to present to partners or clients.
🎯 Who Can Benefit from This Legal Dashboard in Excel
👩⚖️ Law Firms — Track performance, control costs, and enhance client satisfaction.
🏢 Corporate Legal Departments — Manage compliance, litigation, and resource allocation efficiently.
📚 Consulting Firms — Monitor client engagements and profitability across cases.
⚖️ Independent Attorneys — Simplify case tracking and improve client management.
🌍 Legal Process Outsourcing Firms (LPOs) — Streamline multi-client performance monitoring.
Whether you’re managing five cases or five hundred, this dashboard scales effortlessly with your workload.
Click here to read the Detailed blog post
Watch the step-by-step video tutorial:
Visit our YouTube channel to learn step-by-step video tutorials


Reviews
There are no reviews yet.