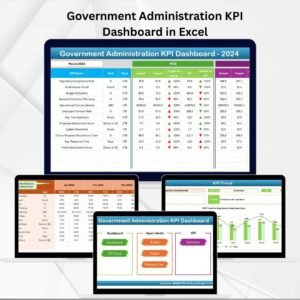
In the world of global development, data transparency and measurable results are essential for impact-driven decision-making. That’s exactly what the International Development KPI Dashboard in Excel delivers — a ready-to-use, professional, and interactive Excel tool that helps NGOs, government agencies, and donor-funded programs monitor progress, evaluate results, and make informed strategic decisions.International Development KPI Dashboard in Excel
This smart dashboard turns complex data into clear visual insights — empowering project managers and M&E professionals to track KPIs, compare performance against targets, and enhance accountability across all programs.
🧩 Key Features of the International Development KPI Dashboard in Excel
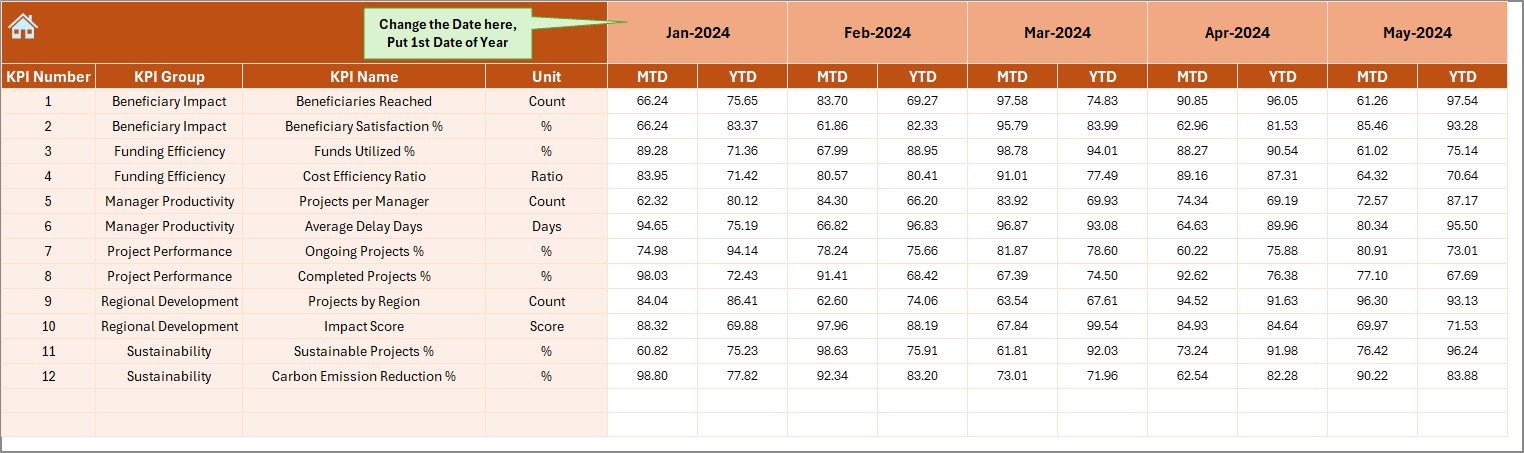
✨ Interactive Month Selector – Choose any month and watch the entire dashboard refresh automatically with updated MTD and YTD numbers.
📊 MTD & YTD Analysis – Instantly compare Month-to-Date and Year-to-Date performance with Actual, Target, and Previous Year metrics.International Development KPI Dashboard in Excel
🎯 Conditional Formatting Indicators – Visual up/down arrows highlight performance trends at a glance.
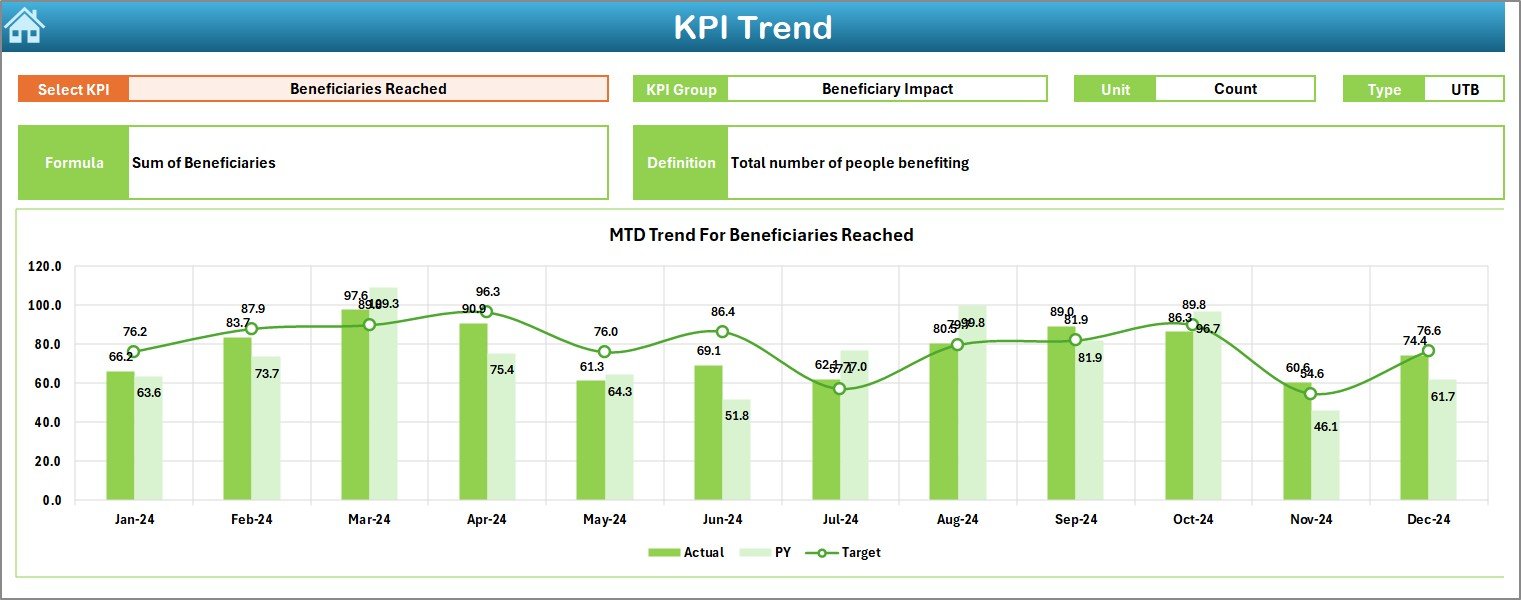
📈 Dynamic KPI Trend Charts – Dive deeper into each KPI with dynamic charts and performance visuals.
🧮 Auto-Updated Calculations – Built-in formulas compute comparisons automatically, eliminating manual effort.
💼 Professional Layout – Clean and visually appealing design suitable for donor reports and board reviews.
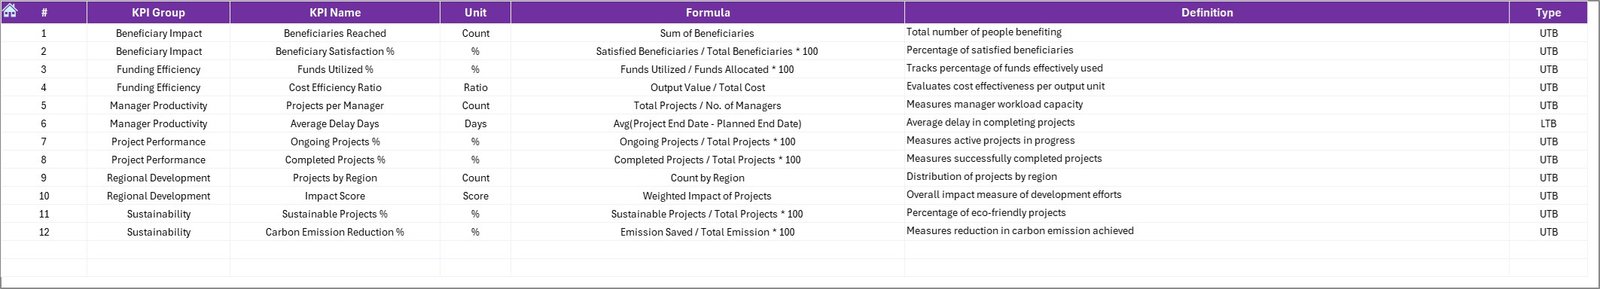
🧾 KPI Definition Reference – Clear KPI formulas, units, and descriptions for easy interpretation.
🖥️ No Coding or VBA Needed – Fully Excel-based, works offline, and requires no special installation.
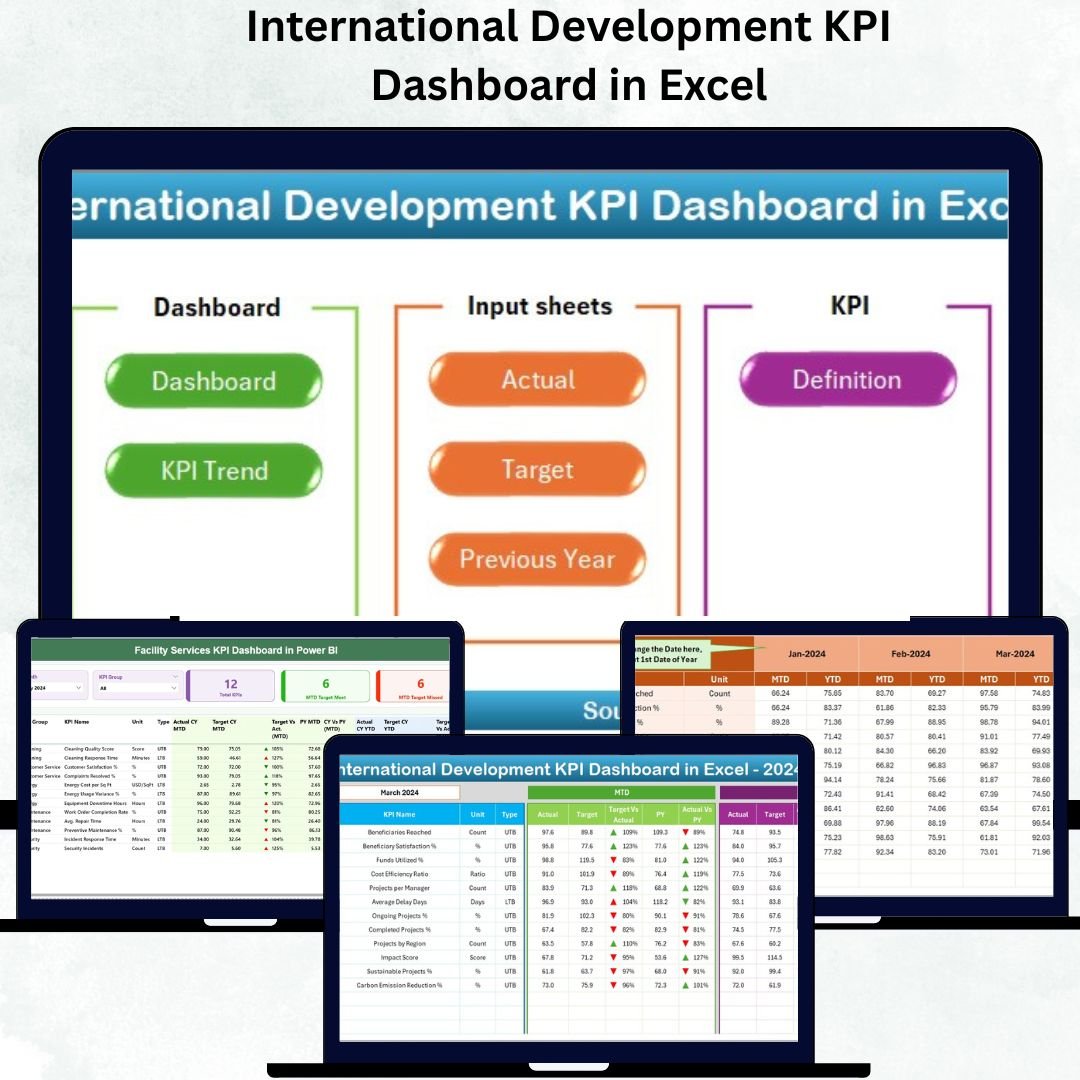
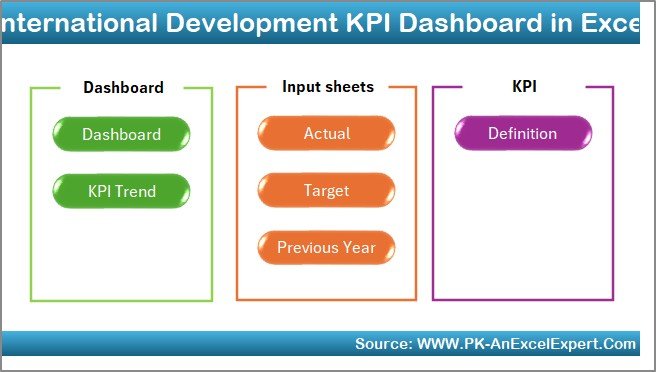
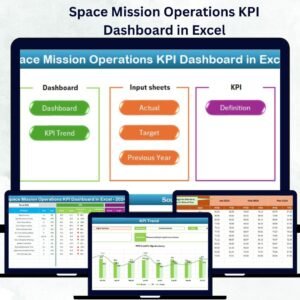
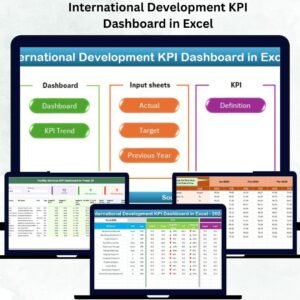
📁 Comprehensive Sheets – Includes Home, Dashboard, KPI Trend, Actual, Target, Previous Year, and Definition sheets.
📂 What’s Inside the International Development KPI Dashboard in Excel
This template is structured with 7 powerful worksheets, each designed for efficiency and clarity:International Development KPI Dashboard in Excel
1️⃣ Home Sheet – Acts as the central navigation panel with clickable buttons to jump across sections.
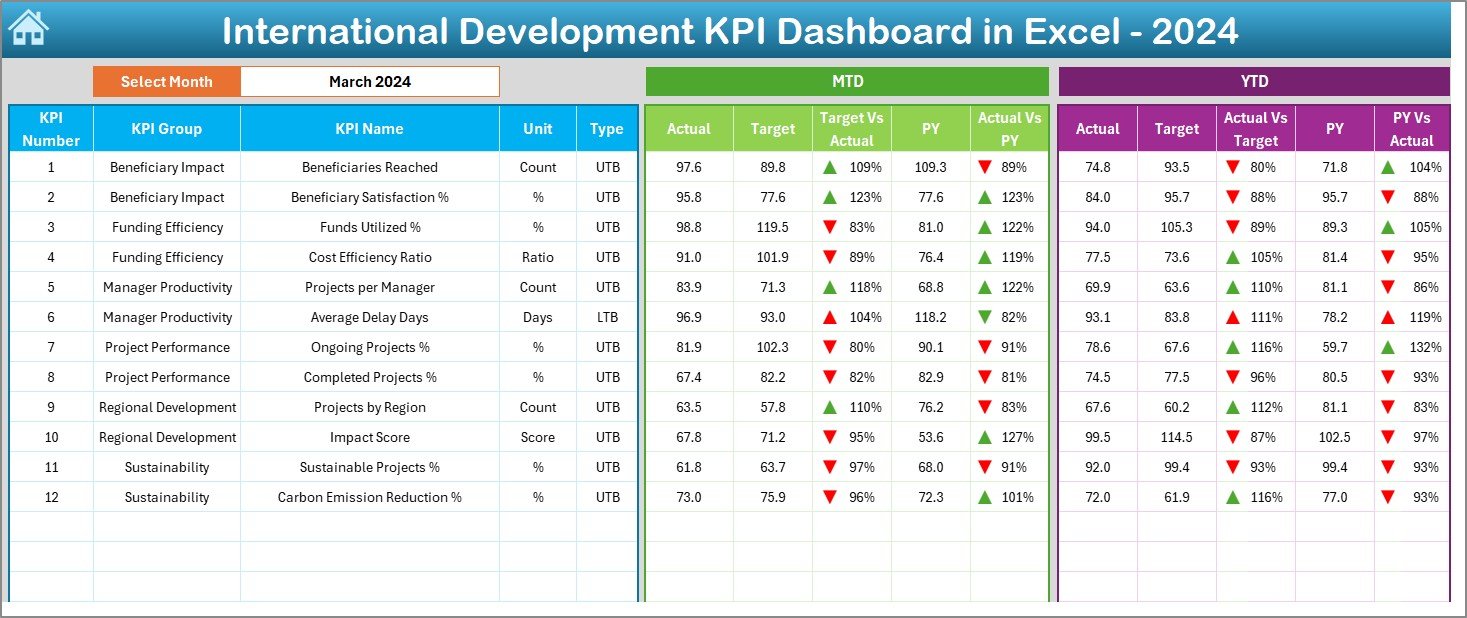
2️⃣ Dashboard Sheet – The main analytics page that visualizes MTD, YTD, Actual vs Target, and PY comparisons with color-coded arrows.
3️⃣ KPI Trend Sheet – Analyze individual KPIs with drop-down selectors, dynamic trend charts, and historical data.
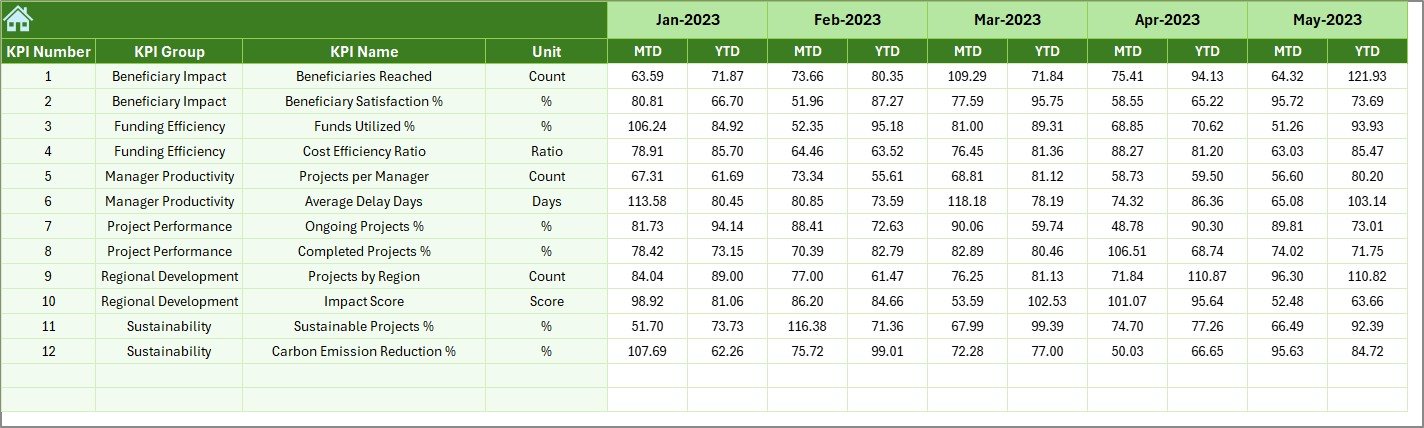
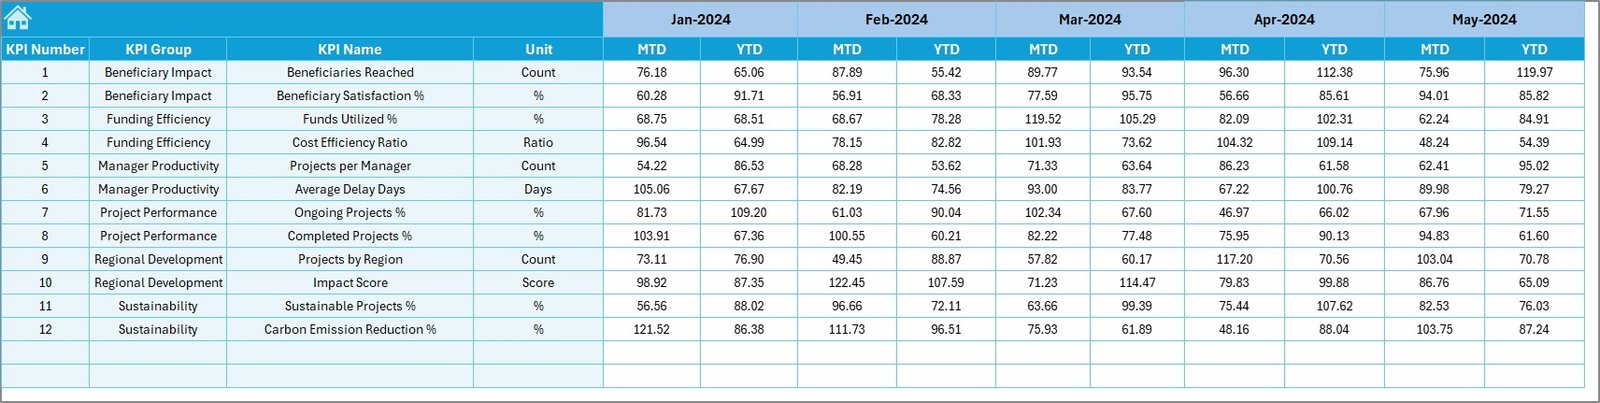
4️⃣ Actual Numbers Sheet – Enter real-time data for monthly performance tracking.
5️⃣ Target Sheet – Define monthly and annual targets to measure progress effectively.
6️⃣ Previous Year Sheet – Benchmark growth against last year’s achievements.
7️⃣ KPI Definition Sheet – Lists KPI names, formulas, units, and types (UTB/LTB) for transparency and consistency.
Everything is automated — just update your data, and the visuals refresh instantly!
⚙️ How to Use the International Development KPI Dashboard in Excel
🚀 Step 1: Open the Home Sheet and use navigation buttons to explore.
📅 Step 2: Select the reporting month to view dynamic KPI updates.
✍️ Step 3: Enter Actual Data in the “Actual Numbers” sheet.
🎯 Step 4: Set performance goals in the “Target Sheet.”
📊 Step 5: Add Previous Year values for benchmarking.
📘 Step 6: Update KPI Definitions to match your organization’s framework.
📈 Step 7: Analyze MTD and YTD trends using the main dashboard and KPI trend views.
No advanced Excel skills required — the dashboard is plug-and-play ready!
👥 Who Can Benefit from This International Development KPI Dashboard
🌐 NGOs & Donor Agencies: Track funding utilization, project outcomes, and beneficiary reach.
🏛️ Government Programs: Evaluate policy implementation across departments and regions.
🤝 International Aid Organizations: Monitor field performance and regional development results.
📚 Educational & Health Initiatives: Measure progress toward key social and economic targets.
💼 M&E Professionals: Streamline reporting, visualize trends, and make data-backed recommendations.
📈 Project Managers: Instantly see which KPIs are improving or declining.
Whether you’re managing programs in Africa, Asia, or Latin America — this Excel tool gives you the clarity and confidence to manage global development projects effectively.


Reviews
There are no reviews yet.